. 2019 Jun 26;14(6):e0218186.
doi: 10.1371/journal.pone.0218186. eCollection 2019.

Inhibition of hepatocellular carcinoma by metabolic normalization

Affiliations

Inhibition of hepatocellular carcinoma by metabolic normalization

Huabo Wang et al. PLoS One. .

Abstract

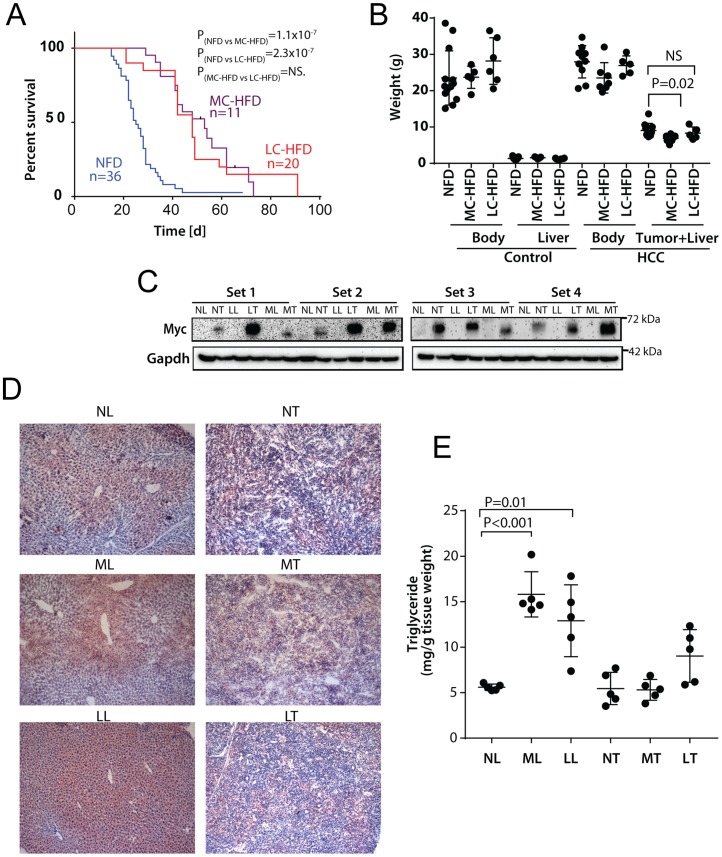
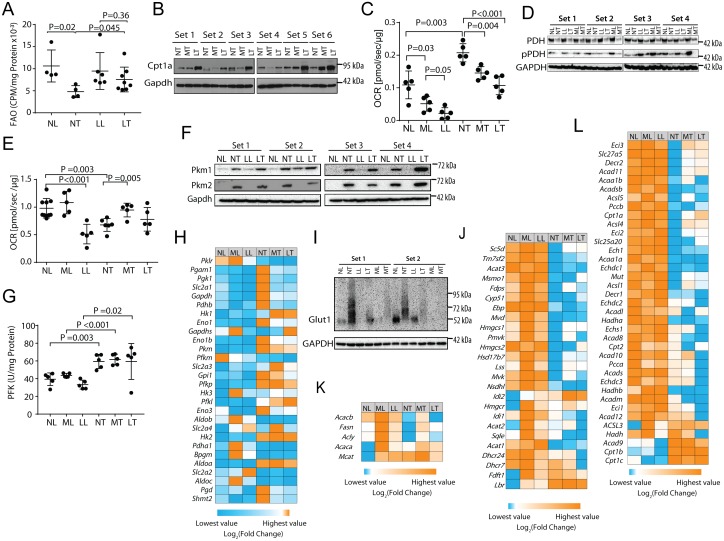
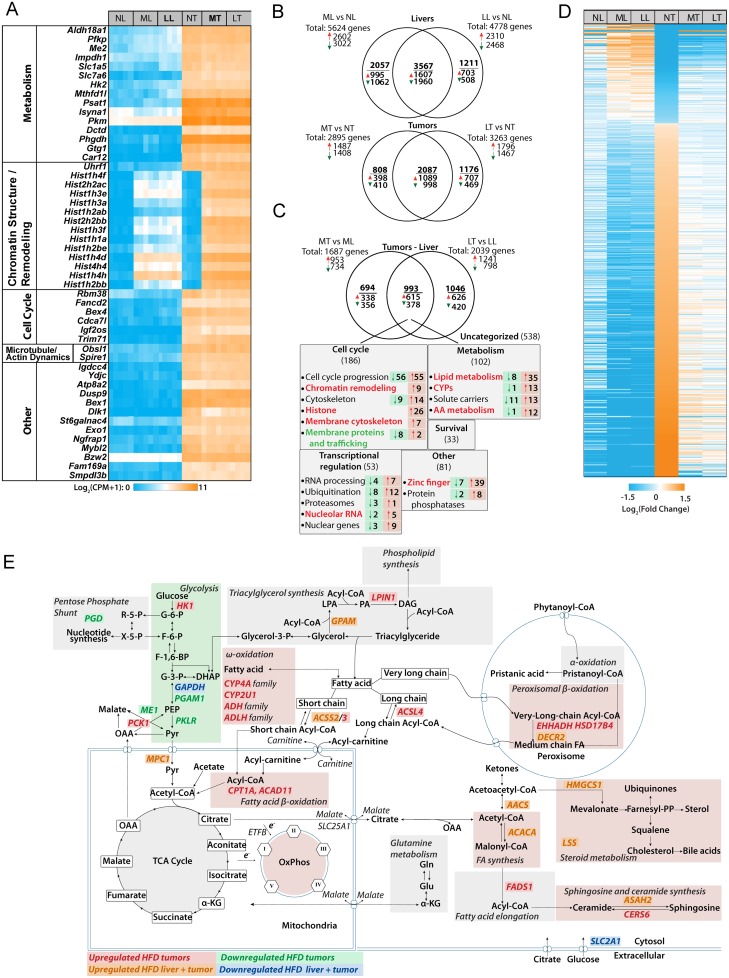
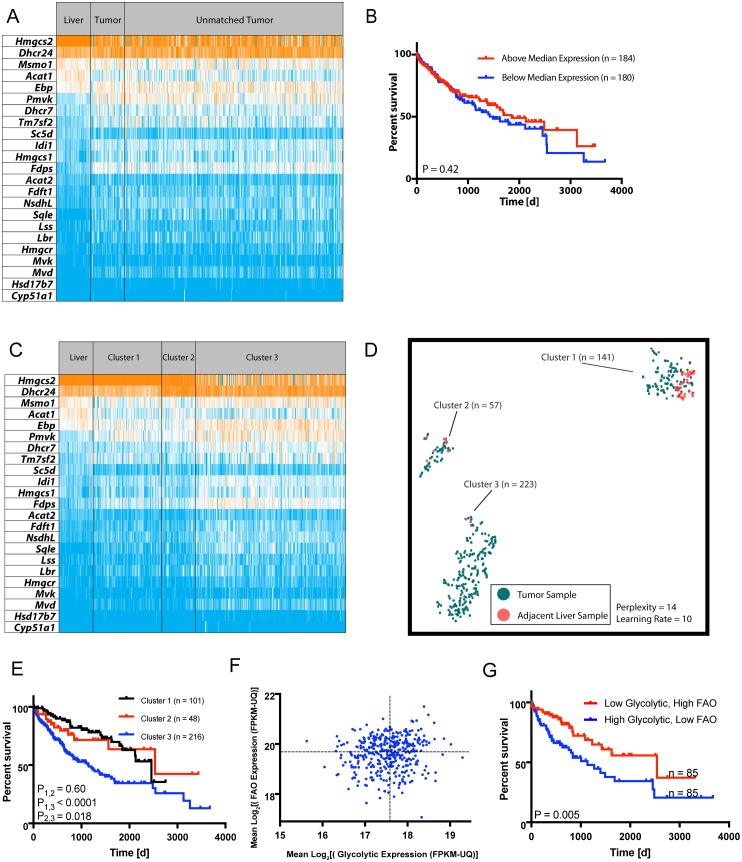
In two different mouse liver cancer models, we recently showed that a switch from oxidative phosphorylation (Oxphos) to glycolysis (the Warburg effect) is invariably accompanied by a marked decline in fatty acid oxidation (FAO) and a reciprocal increase in the activity of pyruvate dehydrogenase (PDH), which links glycolysis to the TCA cycle. We now show that short-term implementation of either medium-chain (MC) or long-chain (LC) high fat diets (HFDs) nearly doubled the survival of mice with c-Myc oncoprotein-driven hepatocellular carcinoma (HCC). Mechanistically, HFDs forced tumors to become more reliant on fatty acids as an energy source, thus normalizing both FAO and PDH activities. More generally, both MC- and LC-HFDs partially or completely normalized the expression of 682 tumor-dysregulated transcripts, a substantial fraction of which are involved in cell cycle control, proliferation and metabolism. That these same transcripts were responsive to HFDs in livers strongly suggested that the changes were the cause of tumor inhibition rather than its consequence. In seven different human cancer cohorts, patients with tumors containing high ratios of FAO-related:glycolysis-related transcripts had prolonged survival relative to those with low ratios. Furthermore, in 13 human cancer types, the expression patterns of transcripts encoding enzymes participating in FAO and/or cholesterol biosynthesis also correlated with significantly prolonged survival. Collectively, our results support the idea that the survival benefits of HFDs are due to a reversal of the Warburg effect and other tumor-associated metabolic and cell cycle abnormalities. They also suggest that short-term dietary manipulation, either alone or in combination with more traditional chemotherapeutic regimens, might be employed as a relatively non-toxic and cost-effective means of enhancing survival in certain cancer types.


Conflict of interest statement

The authors have declared that no competing interests exist.

Figures

Fig 1
Fig 1. HFDs extend lifespans of HCC-bearing mice.
A, Kaplan-Meier survival curves. NFDs, MC-HFDs or LC-HFDs were initiated one wk prior to Myc induction. Median survival times for each group were: NFD = 25+/-1.7 d, MC-HFD = 53+/-6.3 d, LC-HFD = 48+/-4.2 d. P values were determined by a log-rank comparison between each of the indicated groups. B. Total body, liver and tumor weights at the time of sacrifice. The control groups were comprised of non-tumor-bearing mice maintained on Dox and provided with the indicated diets for three months. C. Representative Myc protein levels in four sets of livers (L) and tumors (T) maintained on NFDs (NL or NT), MC-HFDs (ML or MT) or LC-HFDs (LL or LT). D, Representative liver and tumor sections stained with H&E and Oil Red O. E, Triglyceride content of livers and tumors maintained on the indicated diets.
Fig 2
Fig 2. HFDs force metabolic re-programming.
A, FAO by isolated mitochondria. Mitochondria from the indicated tissues were incubated with 3H-palmitate-BSA and the release of water-soluble products was quantified. B, Cpt1a immuno-blots showing increased expression of Cpt1a in tumors from mice maintained on LC-HFDs but not on MC-HFDs (P = 0.025). C, PDH activities. OCRs were quantified following the addition of malate, ADP and pyruvate to isolated mitochondria. D, PDH and pPDH immuno-blots. No significant differences among the different tumor groups were noted. E, OCRs in response to the TCA substrates pyruvate, malate, glutamate and succinate in each of the six tissue groups [–19]. F, Immuno-blots of pyruvate kinase isoforms, PKM1 and PKM2 in the indicated tissues. No significant differences among the different tumor groups were noted. G, PFK activities were quantified on extracts from the indicated tissues. Each point represents the mean of duplicate assays of the same tissue. H, Heat map for transcripts encoding key glycolytic enzymes as well as the glucose transporter Slc2a1/GLUT1 and the rate-limiting enzymes 6Pgd and Shmt2. Each column depicts the mean expression of samples obtained from five randomly chosen mice. See S1A Fig for quantification of transcript levels. I, Immuno-blots for Slc2a1/GLUT1 in the indicated tissues. J, Expression of transcripts encoding cholesterol biosynthetic enzymes. See S1B Fig for the proper order of these enzymes along the pathway and S1C Fig for actual expression levels of each transcript across all tissues. K, Heat map for transcripts encoding key enzymes in the FAS pathway. These include malonyl-CoA-acyl carrier protein transacylase (Mcat), AcCoA carboxylase a&b (Acaca & Acacb), ATP citrate lyase (acly) and fatty acid synthase (Fasn). See S2A Fig for actual quantification of each transcript across all tissues. L, Heat map for transcripts encoding key enzymes in the FAO pathway. See S2B & S2C Fig for each transcript’s position in the FAO pathway and its actual quantification across all tissues, respectively. For panels H,J,K and L, each column represents the mean values obtained from five tissues.
Fig 3
Fig 3. Differences among liver and tumor groups maintained on NDs or HFDs.
A, The 50 most highly de-regulated transcripts that distinguish livers and tumors. Transcripts are grouped according to their known or assumed functional categories. See S4 Fig for actual expression levels and S2 Table for the actual functional categories into which these transcripts could be grouped. B, Venn diagram of differential transcript expression among NFD livers and tumors and those maintained on MC-HFDs and LC-HFDs. C, Venn diagram of differential transcript expression that distinguishes NFD-tumors from MC-HFD tumors and LC-HFD tumors. The 993 common transcripts represent those that are uniquely deregulated only in tumors maintained on both HFDs. See S3 Table for a full list of these. D, Heat map of the 682 transcripts that are de-regulated in NFD tumors and normalized by both MC-LFDs and LC-HFD (q<0.05) (See S4 Table for the complete list of these transcripts and their expression levels in each of the tumor groups. E, Predicted pathway de-regulation in HFD tumors based on IPA predictions. The indicated genes are taken from C and D and S3 Table. They represent transcripts that de-regulated in NFD tumors and normalized by both MC-LFDs and LC-HFD.
Fig 4
Fig 4. Deregulation of transcripts involved in lipid metabolism correlate with human HCC survival.
A, Expression of transcripts encoding the cholesterol biosynthetic enzymes depicted in S1B Fig in 50 matched liver and HCC samples along with 371 additional unmatched HCCs. Transcripts are arranged from the most to the least abundant based on their mean expression in NFD murine livers. All values were obtained from analyses of human tissues previously deposited in TCGA. B, Kaplan-Meier survival curves of HCC patients with the highest and lowest mean levels of cholesterol transcript expression relative to control livers from A. C, The tumors depicted in A were re-arranged into three groups with distinct differences in their patterns of transcript expression. D, Unsupervised t-SNE-based clustering of the normal liver and three tumor groups from panel C showing improved resolution of transcript expression pattern differences [17]. E, Kaplan-Meier survival curves of the three HCC patient cohorts shown in C and D. Significant differences in survival among the groups based on log-rank test are indicated. F, HCCs from A were analyzed for their mean levels of transcripts encoding FAO- and glycolysis-related enzymes and plotted on corresponding axes of the graph. G, Kaplan-Meier survival of HCC patients with FAO- and glycolysis-related transcript level ratios from the upper left quartile (high FAO/low glycolysis) and the lower right quartile (low FAO/high glycolysis) of panel F. Significant differences in survival among the groups based on log-rank test are indicated.

References

    1. Hanahan D, Weinberg RA. Hallmarks of cancer: the next generation. Cell. 2011;144(5):646–74. 10.1016/j.cell.2011.02.013 . - DOI - PubMed
    1. Altman BJ, Stine ZE, Dang CV. From Krebs to clinic: glutamine metabolism to cancer therapy. Nat Rev Cancer. 2016;16(10):619–34. 10.1038/nrc.2016.71 . - DOI - PMC - PubMed
    1. L MG, Boulay K, Topisirovic I, Huot ME, Mallette FA. Oncogenic activities of IDH1/2 mutations: from epigenetics to cellular signaling. Trends Cell Biol. 2017;27(10):738–52. 10.1016/j.tcb.2017.06.002 . - DOI - PubMed
    1. Pavlova NN, Thompson CB. The emerging hallmarks of cancer metabolism. Cell Metab. 2016;23(1):27–47. 10.1016/j.cmet.2015.12.006 . - DOI - PMC - PubMed
    1. Bayin NS, Frenster JD, Sen R, Si S, Modrek AS, Galifianakis N, et al. Notch signaling regulates metabolic heterogeneity in glioblastoma stem cells. Oncotarget. 2017;8(39):64932–53. 10.18632/oncotarget.18117 . - DOI - PMC - PubMed

Publication types

Substances