. 2019 Jun 26;14(6):e0216393.
doi: 10.1371/journal.pone.0216393. eCollection 2019.

Synbiotics suppress colitis-induced tumorigenesis in a colon-specific cancer mouse model

Affiliations

Synbiotics suppress colitis-induced tumorigenesis in a colon-specific cancer mouse model

Yasufumi Saito et al. PLoS One. .

Abstract

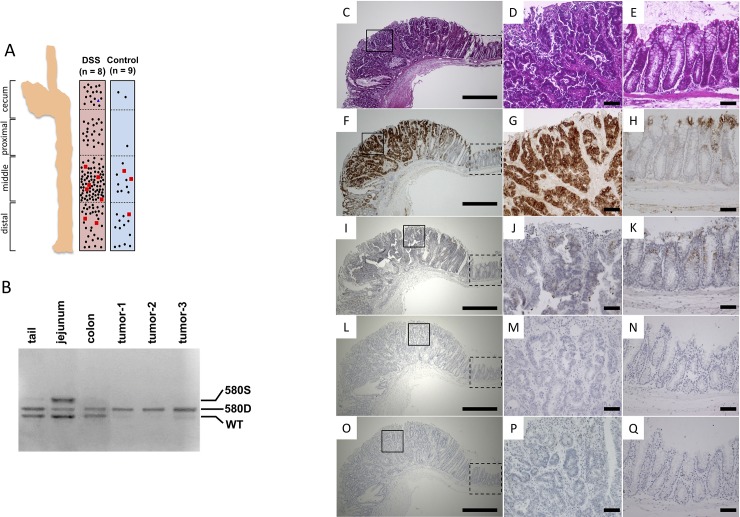
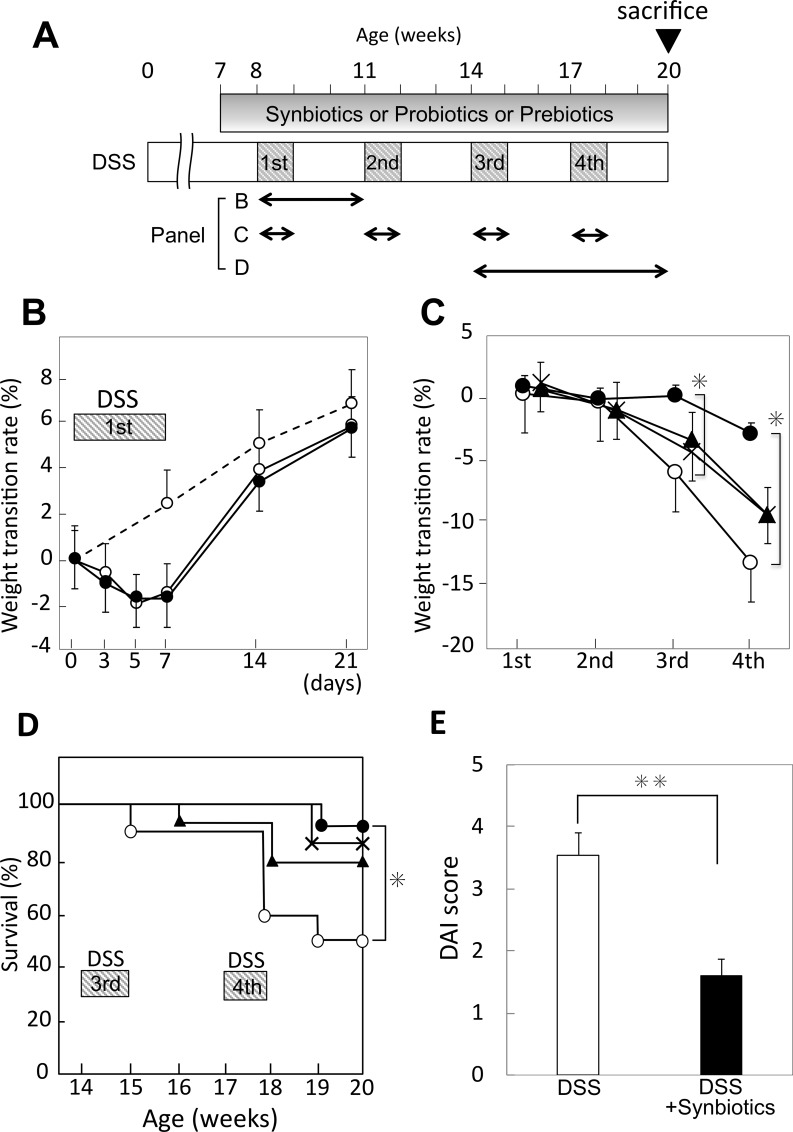
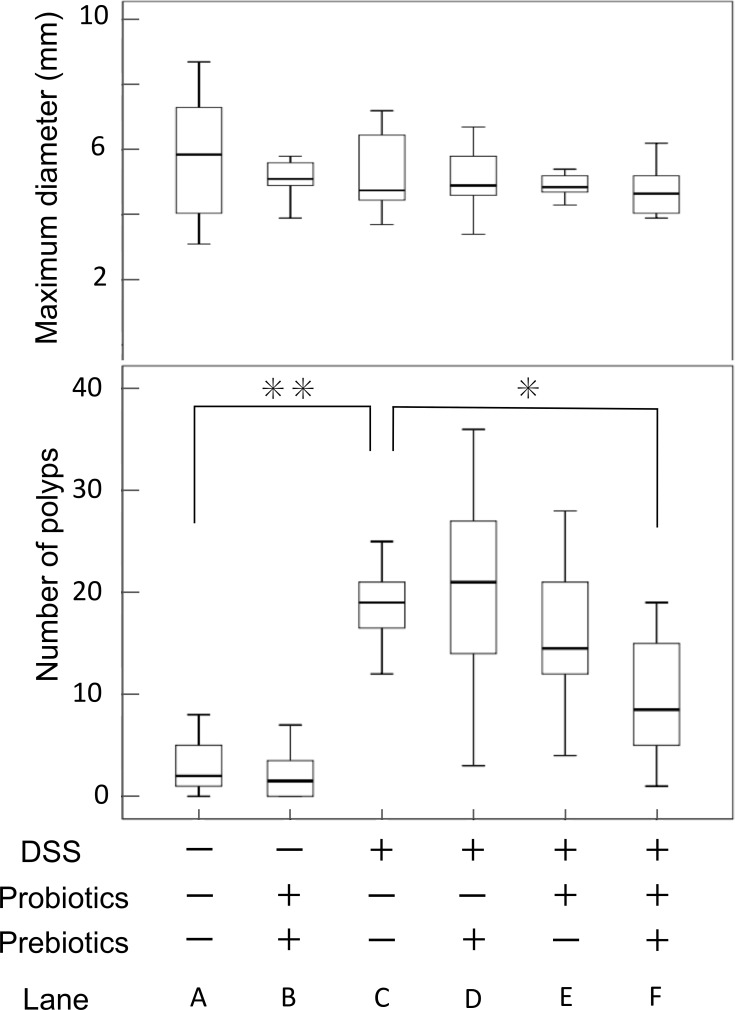
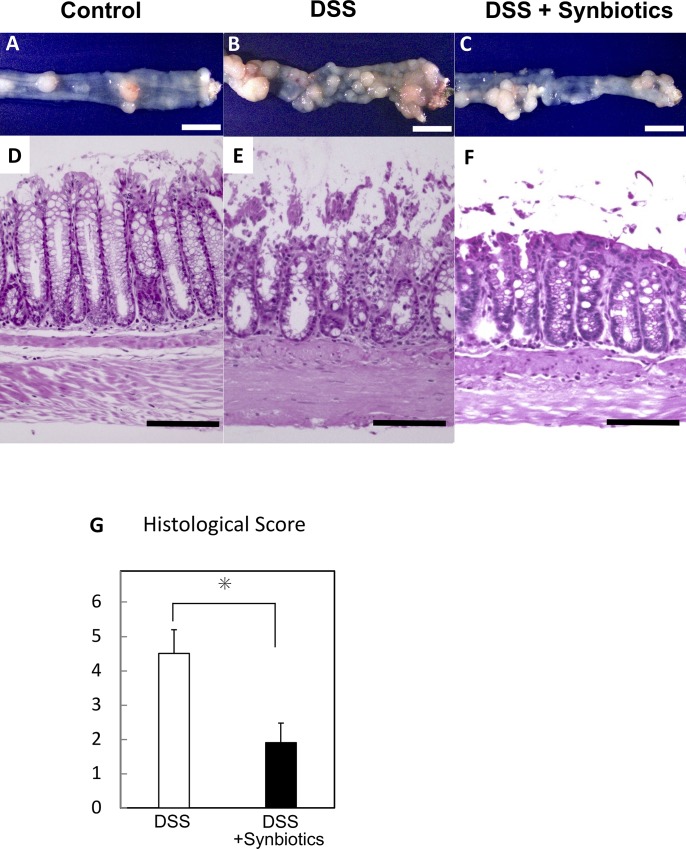
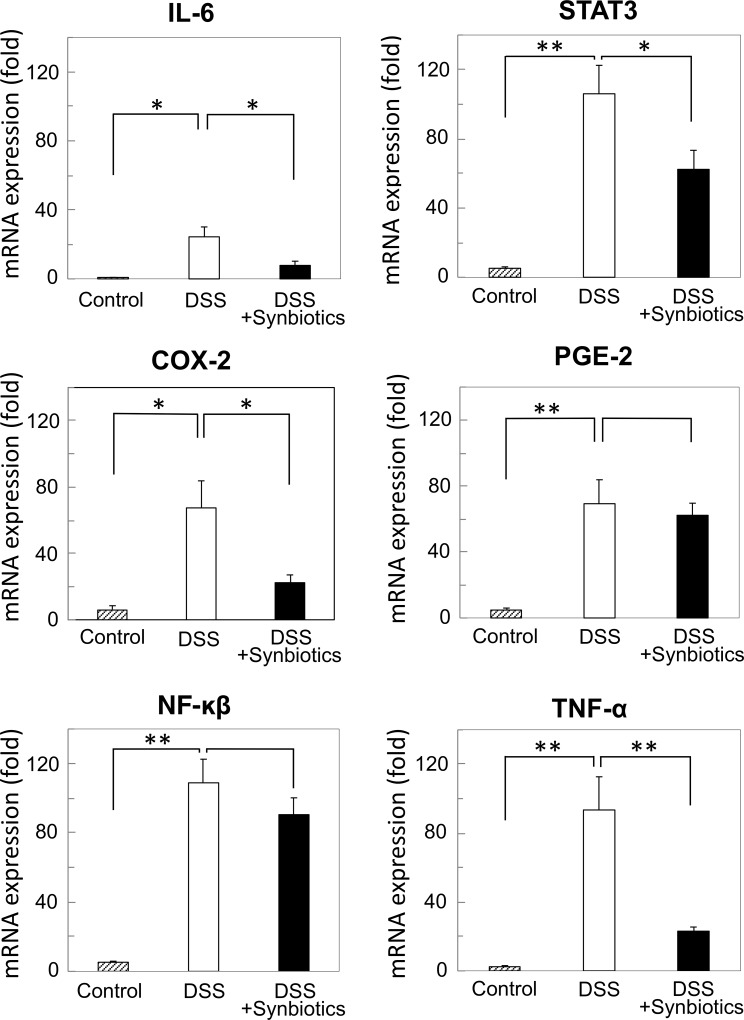
Although synbiotics may be effective in maintaining remission of inflammatory bowel disease, their anticarcinogenic effects are still debated. To address this issue, we evaluated the effects of synbiotics, probiotics, and prebiotics on tumorigenesis using a CDX2P-Cre; Apc+/flox mouse model harboring a colon-specific Apc knock out, which develops adenoma and adenocarcinoma of the colon. Dextran sodium sulfate (DSS)-administration promoted colonic tumor development in CDX2P-Cre; Apc+/flox mice, and these tumors were associated with loss of Apc heterozygosity, as confirmed by observation of well-differentiated adenocarcinomas with β-catenin accumulation in tumor cell cytoplasm. Synbiotics-treatment suppressed dextran sodium sulfate-induced colitis in CDX2P-Cre; Apc+/flox mice, thereby reducing mortality, and inhibited tumorigenesis accelerated by DSS-administration. Conversely, neither probiotics nor prebiotics had any effect on inflammation and tumorigenesis. Lactobacillus casei and Bifidobacterium breve were detected in the fecal microbiota of probiotics-treated mice. Synbiotics-treatment suppressed DSS-induced expression of IL-6, STAT-3, COX-2, and TNF-α gene transcripts in normal colonic epithelium, indicating the possibility of suppressing tumor development. Importantly, these genes may be potential therapeutic targets in inflammation-associated colon cancer.


Conflict of interest statement

The authors have declared that no competing interests exist.

Figures

Fig 1
Fig 1. Evaluation of tumor formation and histological analysis.
(A) Comparison of tumor number and site of occurrence in the large intestine between DSS-administered CPC;Apc mice and control mice. Solid circles indicate a tumor of 5 mm or more and less than 10 mm. Blue triangles indicate a tumor less than 5 mm. Red squares indicate a tumor of 10 mm or more. (B) Estimation of Apc loss of heterozygosity by multiplex PCR. Histological analysis of tumors in DSS-administered CPC;Apc mice. Hematoxylin and eosin-stained (C, D, E) and immunohistochemical staining of β-catenin (F, G, H), CDX2 (I, J, K), p53 (L, M, N), and Ki-67 (O, P, Q). (C, F, I, L, O: 40×, box with a solid line indicates a tumor; box with a broken line indicates normal colon epithelium. D, G, J, M, P: tumor 200×. E, H, K, N, Q: normal colon epithelium 200×.
Fig 2
Fig 2. Administration schedule of DSS, probiotics and prebiotics.
Evaluation of body weight change and survival of mice and intestinal inflammation. (A) Timetable of DSS-administration and drug-treatment with probiotics and prebiotics. (B) Weight transition for DSS-administration during course 1 (day 0–21, open circle and broken line: control, open circle and solid line: DSS-administered mice, solid circle and solid line: DSS-administered and synbiotics-treated mice). (C) Weight change during each DSS-administration course (1st to 4th) in mice administered DSS and treated with probiotics and/or prebiotics (open circle: DSS-administration only, solid circle: DSS-administered and synbiotics-treated mice, cross: DSS-administration and probiotics-treatment, solid triangle: DSS-administration and prebiotics-treatment). (D) Percent survival of each group, with treatments indicated by the same symbols shown in (C).”(E) Disease activity index (DAI) of DSS-administered mice and mice administered DSS and treated with synbiotics. *: P < 0.01, **: P < 0.001.
Fig 3
Fig 3. Comparison of tumor number and maximum tumor diameter.
(A) CPC;Apc mice [average tumor number, average tumor maximum diameter (n = 8); 4.0, 5.9], (B) CPC;Apc mice + synbiotics [average tumor number, average tumor maximum diameter (n = 9); 3.5, 5.0], (C) CPC;Apc mice + DSS [average tumor number, average tumor maximum diameter (n = 8); 19.5, 4.4], (D) CPC;Apc mice + prebiotics (average tumor number, average tumor maximum diameter (n = 7); 21, 4.6), (E) CPC;Apc mice + probiotics [average tumor number, average tumor maximum diameter (n = 7); 14, 4.6], (F) CPC;Apc mice + synbiotics [average tumor number, average tumor maximum diameter (n = 8); 8.2, 4.5]. *: P = 0.01, **: P = 0.002.
Fig 4
Fig 4. Analysis of background inflammation in the normal colon epithelium of DSS-administered and synbiotics-treated CPC;Apc mice using hematoxylin and eosin (H&E) staining and histological score.
(A) control; CPC;Apc mouse. (B) CPC;Apc mouse administered DSS. (C) CPC;Apc mouse administered DSS with synbiotics-treatment (yellow scale 1 cm). H&E staining of normal colon epithelium (D; control, E; DSS-administered mouse, F; mouse administered with DSS and treated with synbiotics: ×200, black scale 100 μm) in CPC;Apc mouse. (G) Estimation of histological score of colon epithelium inflammation. (DSS vs. DSS + synbiotics; 4.5 ± 0.7 vs. 1.9 × 0.6, P < 0.01). *: P < 0.01.
Fig 5
Fig 5. Expression analysis was performed for inflammation- and tumorigenesis-associated genes in normal colon epithelium by quantitative real-time PCR.
Gene expression of total RNA samples from 20-week-old CPC;Apc mice (C: control, n = 8), 20-week-old DSS-administered CPC;Apc mice (D: DSS, n = 8), and 20-week-old CPC;Apc mice administered DSS and treated with synbiotics (DS: DSS + synbiotics, n = 8) was analyzed using commercial high-density oligonucleotide arrays. *: P < 0.05, **: P < 0.001.

Similar articles

Cited by

References

    1. Kim YJ, Hong KS, Chung JW, Kim JH, Hahm KB. Prevention of colitis-associated carcinogenesis with infliximab. Cancer Prev Res. 2010;3: 1314–1333. - PubMed
    1. Rosenstock E, Farmer RG, Petras R, Sivak MV Jr, Rankin GB, Sullivan BH. Surveillance for colonic carcinoma in ulcerative colitis. Gastroenterology. 1985;89: 1342–1346. - PubMed
    1. Langholz E, Munkholm P, Davidsen M, Binder V. Course of ulcerative colitis: Analysis of changes in disease activity over years. Gastroenterology. 1994;107: 3–11. - PubMed
    1. Burstein E, Fearon ER. Colitis and cancer: A tale of inflammatory cells and their cytokines. J Clin Invest. 2008;118: 464–467. 10.1172/JCI34831 - DOI - PMC - PubMed
    1. Grivennikov SI. Inflammation and colorectal cancer: Colitis-associated neoplasia. Semin Immunopathol. 2013;35: 229–244. 10.1007/s00281-012-0352-6 - DOI - PMC - PubMed

Publication types

MeSH terms