. 2019 Jun 25;27(13):3741-3751.e4.
doi: 10.1016/j.celrep.2019.05.101.

Early Seizure Activity Accelerates Depletion of Hippocampal Neural Stem Cells and Impairs Spatial Discrimination in an Alzheimer's Disease Model

Affiliations

Early Seizure Activity Accelerates Depletion of Hippocampal Neural Stem Cells and Impairs Spatial Discrimination in an Alzheimer's Disease Model

Chia-Hsuan Fu et al. Cell Rep. .

Abstract

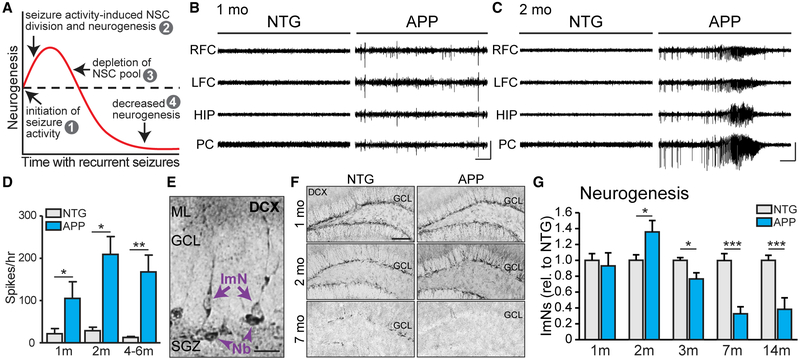
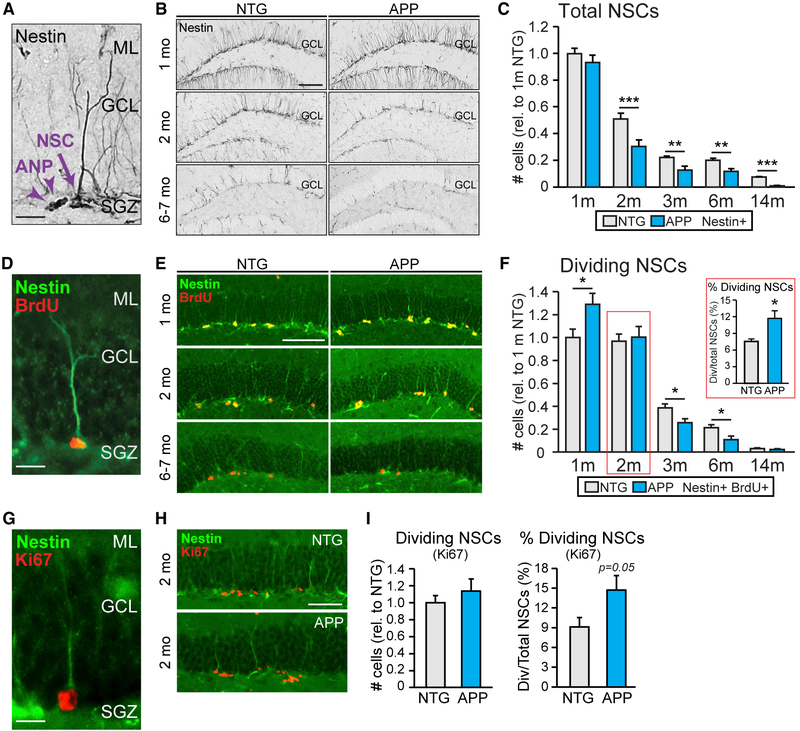
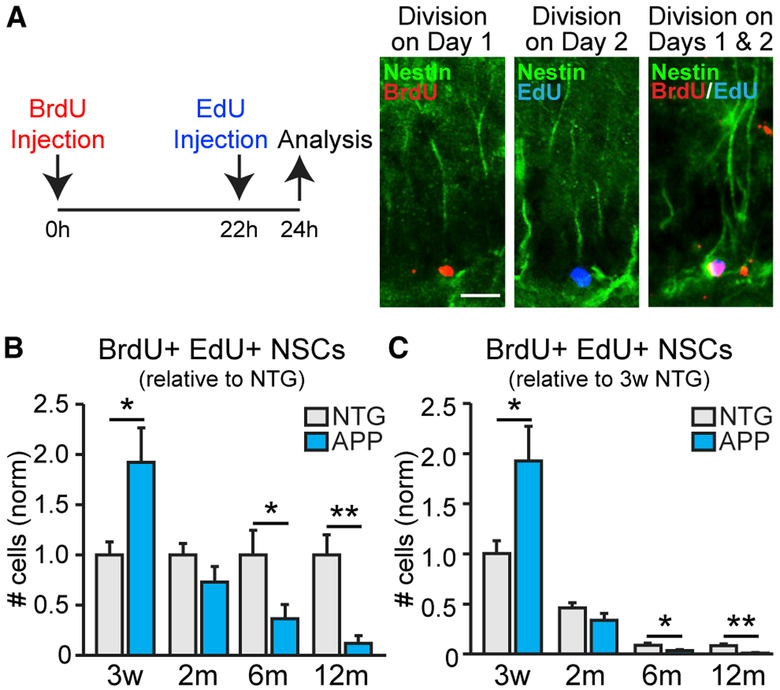
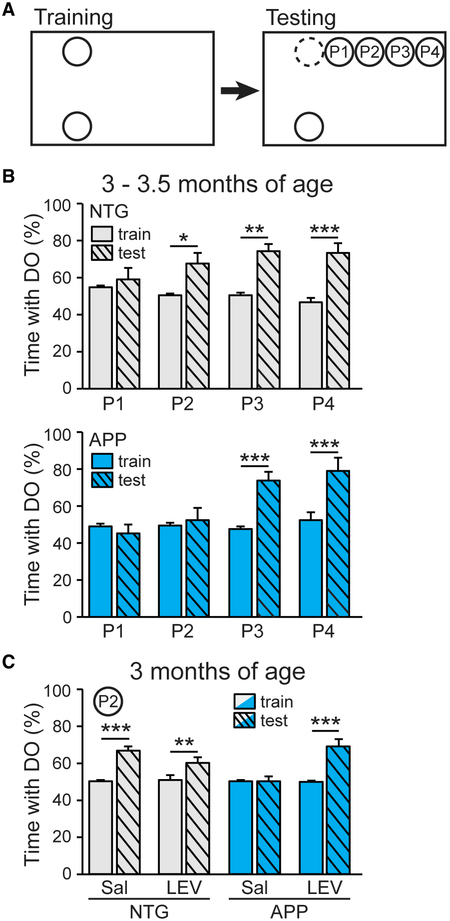
Adult hippocampal neurogenesis has been reported to be decreased, increased, or not changed in Alzheimer's disease (AD) patients and related transgenic mouse models. These disparate findings may relate to differences in disease stage, or the presence of seizures, which are associated with AD and can stimulate neurogenesis. In this study, we investigate a transgenic mouse model of AD that exhibits seizures similarly to AD patients and find that neurogenesis is increased in early stages of disease, as spontaneous seizures became evident, but is decreased below control levels as seizures recur. Treatment with the antiseizure drug levetiracetam restores neurogenesis and improves performance in a neurogenesis-associated spatial discrimination task. Our results suggest that seizures stimulate, and later accelerate the depletion of, the hippocampal neural stem cell pool. These results have implications for AD as well as any disorder accompanied by recurrent seizures, such as epilepsy.

Keywords: Alzheimer; cognition; dentate gyrus; epilepsy; hippocampus; memory; mouse model; neural stem cell pool; neurogenesis; seizure.


Conflict of interest statement

DECLARATION OF INTERESTS

The authors declare no competing interests.

Figures

Figure 1.
Figure 1.. The Rate of Adult Hippocampal Neurogenesis in APP Mice Increases after Seizure Activity Starts and Then Decreases with Age
(A) Model illustrating how seizure activity may induce changes in neurogenesis. (B and C) Representative electroencephalogram (EEG) traces from NTG and APP mice at 1 and 2 months of age, with epileptiform spikes at 1 month of age (B) and a seizure at 2 months of age (C) in APP mice. Electrodes were in left and right frontal cortices (LFC and RFC), hippocampus (HIP), and parietal cortex (PC). Scale bars, 1 mV, 10 s. (D) The number of epileptic spikes per hour in NTG or APP mice at 1, 2, and 4–6 months of age (n = 3–5 mice per genotype and age). (E) Immunophenotyping of immature neurons (ImN) and neuroblasts (Nb) by examining morphology of cells that express doublecortin (DCX). Scale bar, 20μm. (F) DCX staining in NTG and APP mice at 1, 2, and 7 months of age. Scale bar, 100 μm. (G) DCX expression at 1 month of age (n = 9–12 mice per genotype) and number of DCX+ ImNs at 2 (n = 6 mice per genotype), 3 (n = 8 mice per genotype), 7 (n = 9–10 mice per genotype), and 14 (n = 11–12 mice per genotype) months of age, normalized to NTG at each time point. *p < 0.05; **p < 0.01; ***p < 0.001; two-tailed unpaired Student’s t test comparing means between NTG and APP mice at each age. Values indicate mean ± SEM. See also Figures S1–S4 and Tables S1 and S2.
Figure 2.
Figure 2.. APP Mice Exhibit Increased NSC Division Followed by Accelerated NSC Pool Depletion
(A) Immunophenotyping of NSCs and neuronal precursors called amplifying neural progenitors (ANP) that express nestin. Scale bar, 20μm. (B) Nestin immunostaining in NTG and APP mice at 1, 2, and 6 to 7 months of age. Scale bar, 100 μm. (C) The number of NSCs in NTG and APP mice at 1 (n = 10–11 mice per genotype), 2 (n = 14 mice per genotype), 3 (n = 8 mice per genotype), 6 (n = 9–10 mice per genotype), and 14 (n = 11–12 mice per genotype) months of age. Cell counts were normalized to the average of 1-month-old NTG mice. (D) Immunophenotyping of dividing NSCs based on nestin expression and presence of BrdU. Scale bar, 20 μm. (E) Nestin and BrdU staining in NTG and APP mice at 1, 2, and 6–7 months of age. Scale bar, 100 μm. (F) The number of BrdU+ dividing NSCs in NTG and APP mice at 1 (n = 9–10 mice per genotype), 2 (n = 8 mice per genotype), 3 (n = 8 mice per genotype), 6 (n = 8 mice per genotype), and 14 (n = 11–12 mice per genotype) months of age. Cell counts were normalized to the average of 1-month-old NTG mice. Inset shows the proportion of dividing NSCs to total NSCs at the 2-month time point. (G) Immunophenotyping of dividing NSCs based on nestin expression and presence of Ki67. Scale bar, 20 μm. (H) Nestin and Ki67 staining in NTG and APP mice at 2 months of age. Scale bar, 50 μm. (I) The total number of Ki67+ dividing NSCs in 2-month-old NTG and APP mice. Cell counts were normalized to the average of NTG mice (left; n = 8 mice per genotype). The percentage of dividing NSCs was calculated as the number of Ki67+ Nestin+ dividing NSCs divided by the total number of NSCs in NTG and APP mice (right). *p < 0.05; **p < 0.01; ***p < 0.001; two-tailed unpaired Student’s t test comparing means between NTG and APP mice at each age. Values indicate mean ± SEM. See also Figures S1, S3, S5, and S6 and Tables S1 and S2.
Figure 3.
Figure 3.. APP Mice Have Higher Fraction of NSCs Engaged in Consecutive Divisions Early in Life than NTG Mice Do
(A) Administration of BrdU and EdU 22 h apart captures NSCs that were dividing only on day 1 (BrdU+ NSCs), only on day 2 (EdU+ NSCs), or on both days 1 and 2 (BrdU+ EdU+ NSCs; “consecutively dividing NSCs”). Scale bar, 20 μm. (B and C) Number of consecutively dividing NSCs at 3 weeks (n = 6 mice per genotype) and at 2 (n = 6–8 mice per genotype), 6 (n = 6–8 mice per genotype), and 12 (n = 5–8 mice per genotype) months of age, normalized to the average of the NTG mice at each time point (B) or 3-week-old NTG mice (C). *p < 0.05; **p < 0.01; two-tailed unpaired Student’s t test comparing means between NTG and APP mice at each age. Values indicate mean ± SEM. See also Figure S6 and Tables S1 and S2.
Figure 4.
Figure 4.. Chronic Levetiracetam Treatment Normalizes Neurogenesis in APP Mice
(A) After 2 weeks of treatment with saline or levetiracetam (LEV; 75 mg/kg), 2-month-old NTG and APP mice (n = 9–11 mice per genotype and treatment) were sacrificed, and the percentage of Ki67+ Nestin+ dividing NSCs was quantified. Two-way ANOVA: genotype (p < 0.01), treatment (p < 0.05). Scale bar, 100 μm. (B) The total number of Nestin+ NSCs in NTG and APP mice treated with saline or LEV. Two-way ANOVA: genotype (p < 0.05), treatment and genotype interaction (p < 0.05). Scale bar, 100 μm. (C) DCX expression in NTG and APP mice treated with saline or LEV. Two-way ANOVA: treatment (p < 0.0001), treatment and genotype interaction (p < 0.05). Scale bar, 100 μm. *p < 0.05; **p < 0.01; ***p < 0.001; Holm Sidak post hoc test. Values indicate mean ± SEM. See also Figures S7 and S8 and Tables S1 and S2.
Figure 5.
Figure 5.. Chronic Levetiracetam Treatment Improves Spatial Discrimination in APP Mice
(A) Spatial discrimination task. Mice were trained with two identical objects placed on one side of cage, then tested with one object displaced to one of four positions (P1–P4). (B) Percentage of time spent with the displaced object (DO) in 3–3.5-month-old NTG (top) and APP (bottom) mice at each of the four positions (P1, P2, P3, P4) during training and test trials (n = 6–8 mice per genotype and position, total 57 mice). NTG mice (top), two-way ANOVA: test phase (p < 0.0001), position and test phase interaction (p < 0.001). APP mice (bottom), two-way ANOVA: test position (p < 0.01), phase (p < 0.001), position and test phase interaction (p < 0.001). (C) Percentage of time spent with the DO at P2 in 3-month-old NTG and APP mice after 4 weeks of treatment with saline or levetiracetam (n = 6–8 per genotype/treatment, total 30 mice). Two-way ANOVA: treatment (p < 0.001), test phase (p < 0.0001), treatment and test phase interaction (p < 0.001). *p < 0.05; **p < 0.01; ***p < 0.001; Holm-Sidak post hoc test. Values indicate mean ± SEM. See also Figures S7 and S9 and Table S2.

References

    1. Aimone JB, Deng W, and Gage FH (2011). Resolving new memories: a critical look at the dentate gyrus, adult neurogenesis, and pattern separation. Neuron 70, 589–596. - PMC - PubMed
    1. Aimone JB, Li Y, Lee SW, Clemenson GD, Deng W, and Gage FH (2014). Regulation and function of adult neurogenesis: from genes to cognition. Physiol. Rev 94, 991–1026. - PMC - PubMed
    1. Ally BA, Hussey EP, Ko PC, and Molitor RJ (2013). Pattern separation and pattern completion in Alzheimer’s disease: evidence of rapid forgetting in amnestic mild cognitive impairment. Hippocampus 23, 1246–1258. - PMC - PubMed
    1. Anacker C, and Hen R (2017). Adult hippocampal neurogenesis and cognitive flexibility - linking memory and mood. Nat. Rev. Neurosci 18, 335–346. - PMC - PubMed
    1. Apostolopoulou M, Kiehl TR, Winter M, Cardenas De La Hoz E, Boles NC, Bjornsson CS, Zuloaga KL, Goderie SK, Wang Y, Cohen AR, and Temple S (2017). Non-monotonic Changes in Progenitor Cell Behavior and Gene Expression during Aging of the Adult V-SVZ Neural Stem Cell Niche. Stem Cell Rep. 9, 1931–1947. - PMC - PubMed

Publication types