. 2019 Jun 25;27(13):3956-3971.e6.
doi: 10.1016/j.celrep.2019.05.095.

Small Extracellular Vesicles Are Key Regulators of Non-cell Autonomous Intercellular Communication in Senescence via the Interferon Protein IFITM3

Affiliations

Small Extracellular Vesicles Are Key Regulators of Non-cell Autonomous Intercellular Communication in Senescence via the Interferon Protein IFITM3

Michela Borghesan et al. Cell Rep. .

Abstract

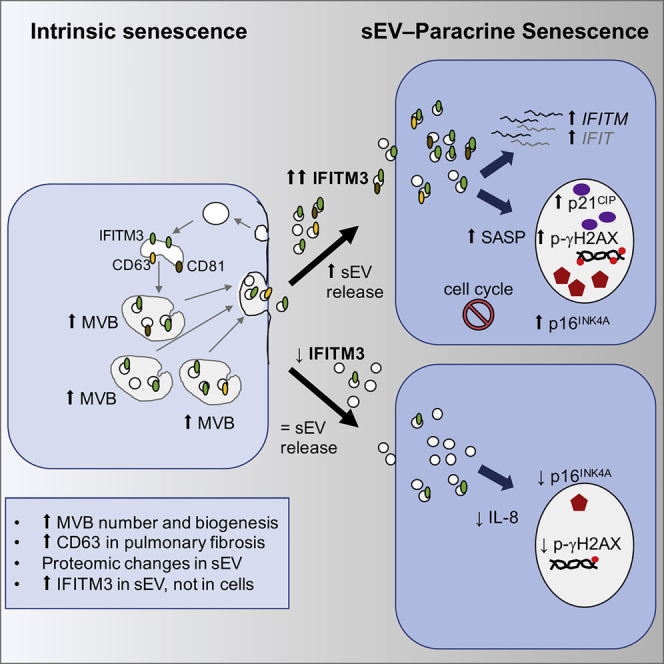
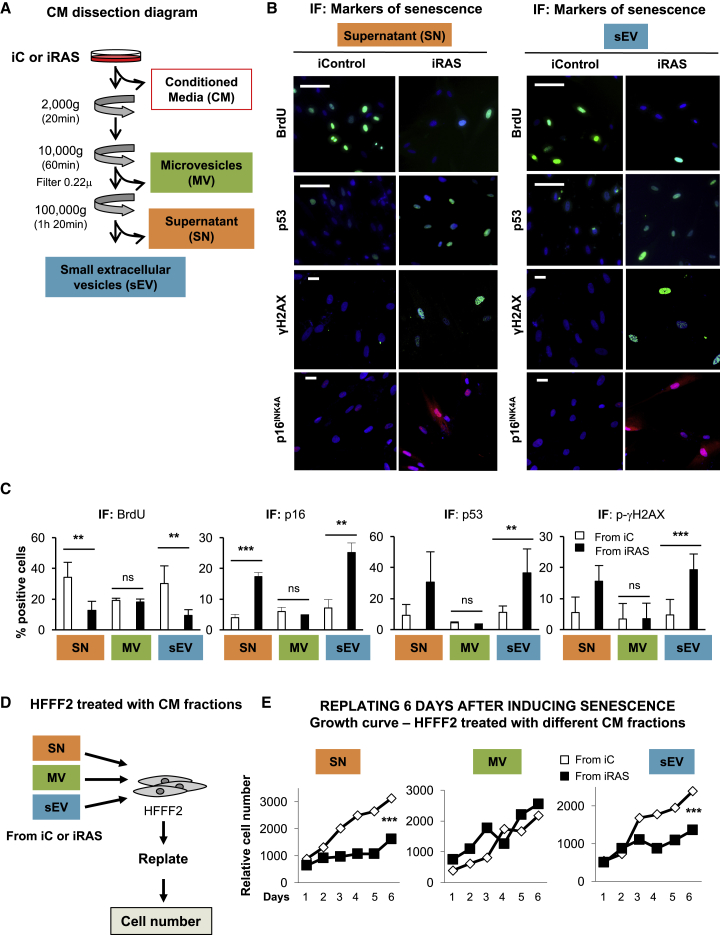
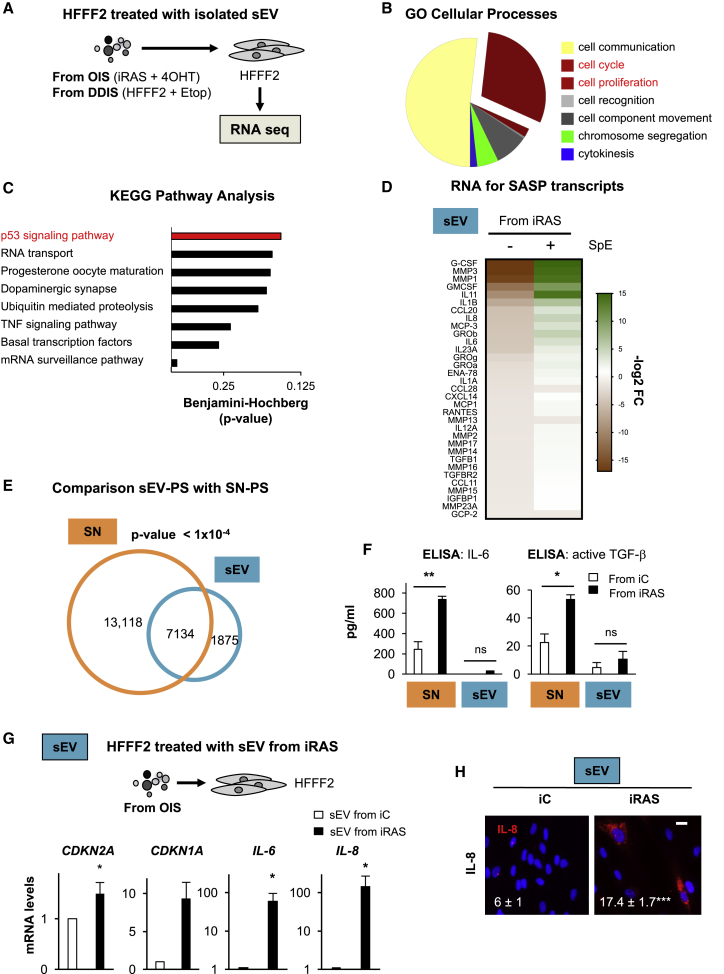
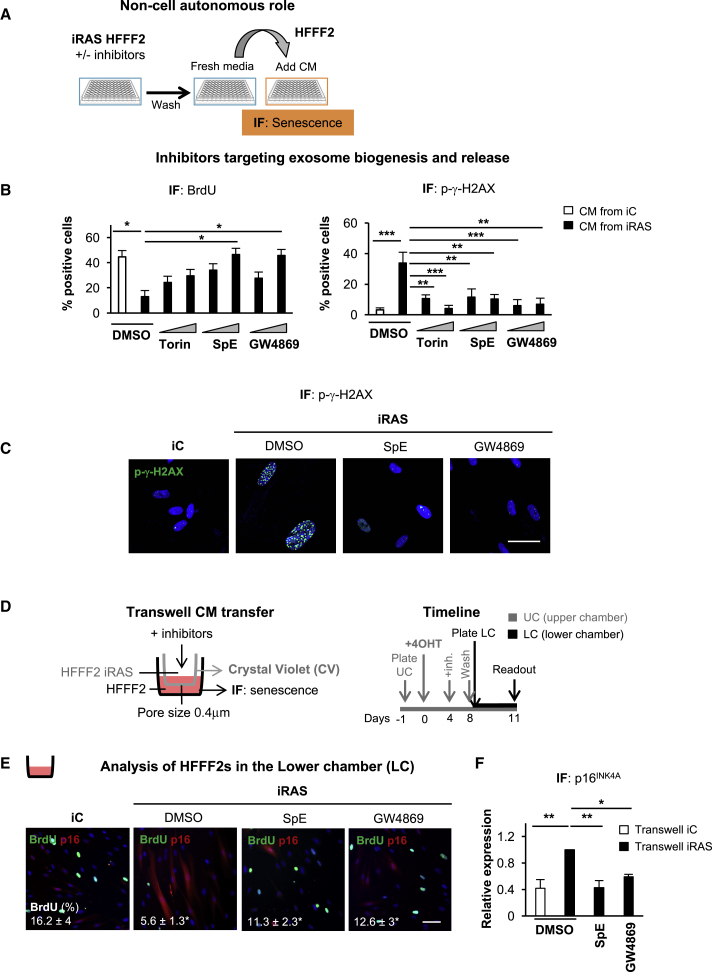
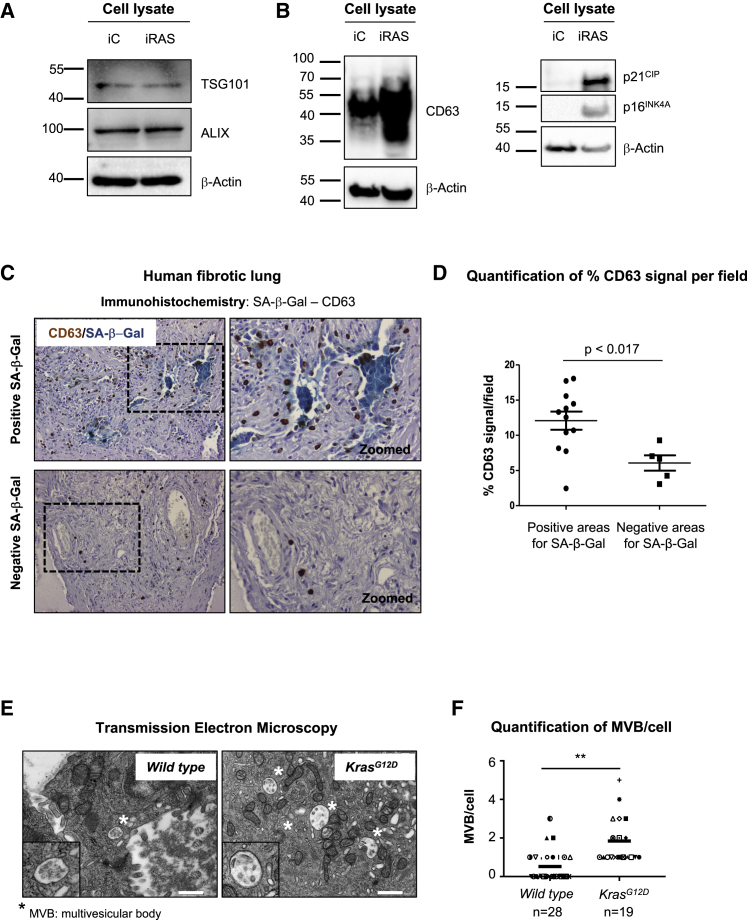
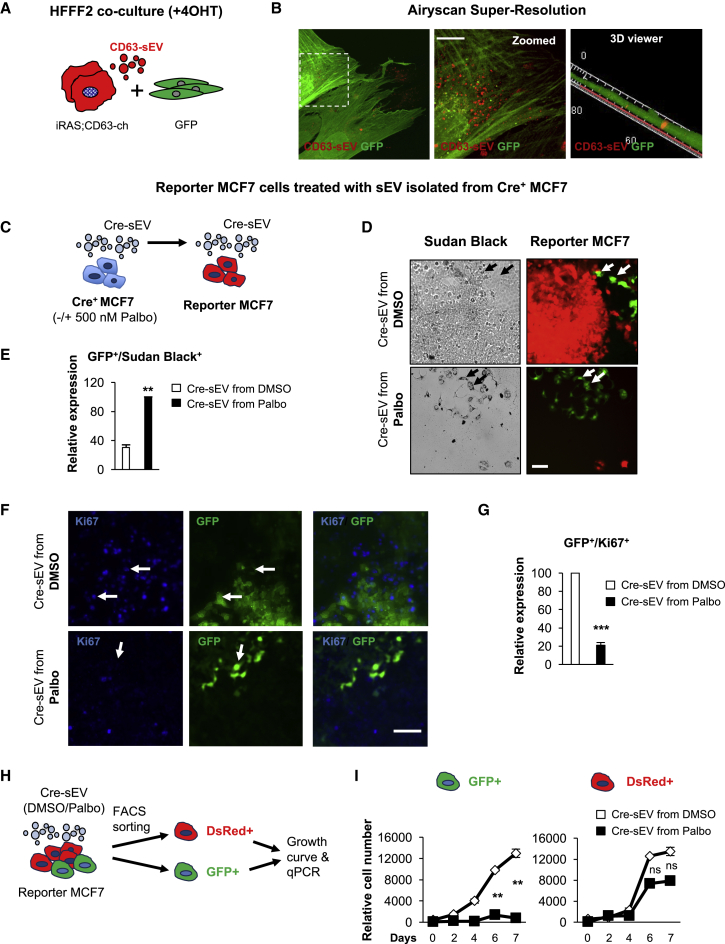
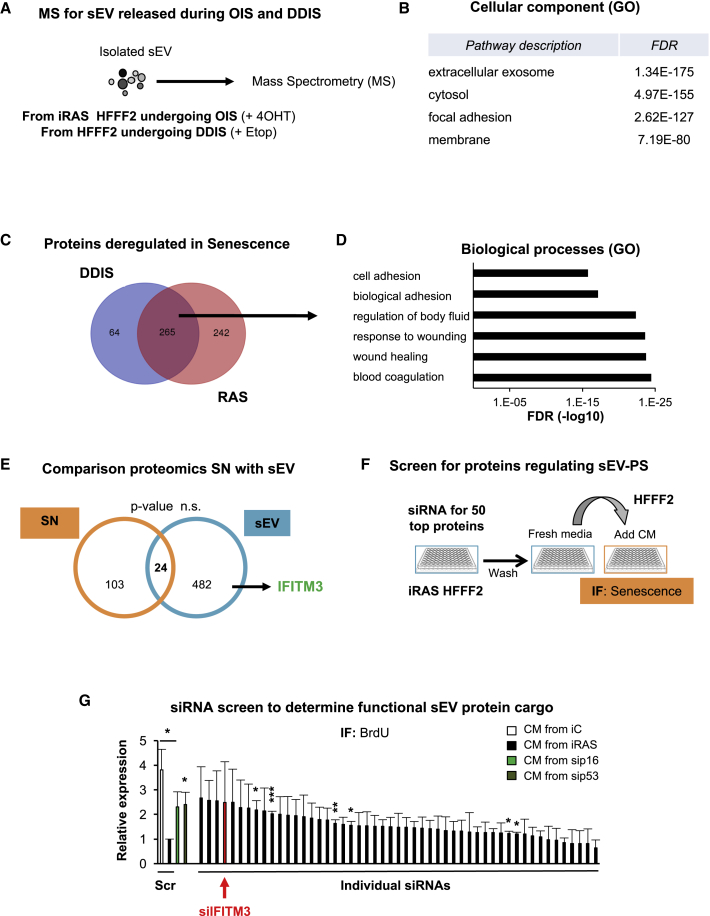
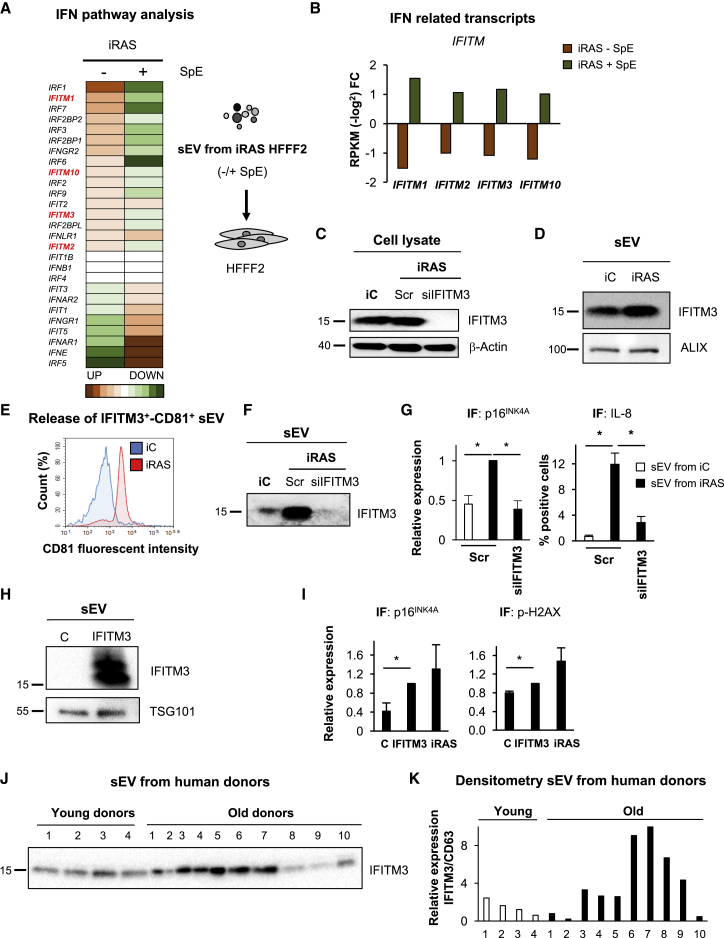
Senescence is a cellular phenotype present in health and disease, characterized by a stable cell-cycle arrest and an inflammatory response called senescence-associated secretory phenotype (SASP). The SASP is important in influencing the behavior of neighboring cells and altering the microenvironment; yet, this role has been mainly attributed to soluble factors. Here, we show that both the soluble factors and small extracellular vesicles (sEVs) are capable of transmitting paracrine senescence to nearby cells. Analysis of individual cells internalizing sEVs, using a Cre-reporter system, show a positive correlation between sEV uptake and senescence activation. We find an increase in the number of multivesicular bodies during senescence in vivo. sEV protein characterization by mass spectrometry (MS) followed by a functional siRNA screen identify interferon-induced transmembrane protein 3 (IFITM3) as being partially responsible for transmitting senescence to normal cells. We find that sEVs contribute to paracrine senescence.

Keywords: DDIS; EV; IFITM3; OIS; aging; exosomes; fragilis; interferon; paracrine senescence; small extracellular vesicles.


Figures

None
Graphical abstract
Figure 1
Figure 1
Small Extracellular Vesicles (sEVs) and Soluble Factors Form Part of the Senescent Secretome and Mediate Paracrine Senescence in Normal HFFF2s (A) Schematic representation of the proof-of-concept experiments performed to show that sEVs form part of the senescent secretome. HFFF2 human primary fibroblasts expressing a vector encoding an inducible form of H-RASG12V ER:RAS (iRAS) or an empty vector (iC) were treated with 200 nM 4OHT for 2 days and allowed to produce conditioned media (CM) for a further 3–5 days. This CM was taken from iC or iRAS HFFF2s and tested for the ability to induce senescence in HFFF2 as a whole (Figure S1A) or (Figures 1B–1E) processed by serial ultracentrifugation to evaluate the effect of the different fractions: supernatant (SN), large extracellular vesicles (MVs), or sEVs to induce paracrine senescence in HFFF2s. (B and C) HFFF2 fibroblasts were treated for 72 h with the different fractions of the CM (SN, MV, or sEV) from iC or iRAS cells, and the endogenous expression of different markers of senescence was determined as shown in (B) representative pictures and by (C) quantifying the percentage of cells staining positive for different antibodies by IF. The graphs represent the means ± SDs of 2–6 independent experiments. Scale bars: 100 μm for BrdU and p53 and 30 μm for p-γH2AX and p16INK4A. (D and E) HFFF2 cells were treated twice for 72 h with the different fractions of the CM, replated, and counted on different days. (D) Scheme of the experiments performed. (E) Growth curves showing the mean of 3 independent experiments. See also Figure S1.
Figure 2
Figure 2
Transcriptome Analysis Shows that sEVs Induce a Senescent Signature (A) Schematic representation of the experimental setting where HFFF2s were treated for 72 h, with sEVs isolated from iRAS cells (mimicking OIS) or HFFF2s treated with Etop (mimicking DDIS) and sent for RNA sequencing. (B) Gene Ontology (GO) analysis for genes involved in cellular processes with >2 log2 fold differential expression and p < 0.05 in both OIS- and DDIS-treated HFFF2s. The pie chart shows a high proportion of genes related to the “cell-cycle” and “cell proliferation” pathways. (C) Kyoto Encyclopedia of Genes and Genomes (KEGG) pathway analysis shows the “p53 signaling pathway” as representative upon HFFF2 treatment with sEVs isolated from senescent cells (from both OIS and DDIS). (D) Bioinformatics analysis of SASP mRNA transcripts in HFFF2 treated with sEVs from iRAS and iC cells. The upregulation of SASP transcripts is prevented when iRAS cells were treated with 5 μM spiroepoxide (SpE; inhibitor of the enzyme neutral sphingomyelinase N-SMase). Data have been normalized to the control and represent the reads per kilobase million (RPKM)-log2 fold difference. (E) Comparison between the paracrine senescence (PS) signature identified by Acosta et al. (2013) by soluble factors (SN) with the sEV-PS signature. (F) ELISA to determine the concentration of IL-6 and active TGF-β present in the SN and sEV lysed fractions. (G and H) HFFF2 treated with sEVs derived from iRAS cells induce an upregulation of cell-cycle inhibitors (CDKN2A, CDKN1A) and SASP (IL-6, IL-8) at the mRNA level, as shown by qPCR analysis (G) and an increase in the percentage of cells staining positive for IL-8 by IF (H). Scale bar, 30 μm. All data represent means ± SDs of 2–4 experiments. See also Figure S2.
Figure 3
Figure 3
Inhibition of the Enzyme Neutral Sphingomyelinase, N-SMase, Prevents Paracrine Senescence (A) Schematic representation of the experimental settings to determine whether inhibition of N-SMase influences paracrine senescence. iRAS cells were treated with 200 nM 4OHT for 2 days, followed by treatment with different concentrations of Torin-2 (25 and 50 nM) or 2 independent N-SMase inhibitors: GW4869 (1 and 10 μM) and SpE (2 and 5 μM) for 3 days. After the incubation with the inhibitors, cells were washed and allowed to produce fresh CM for 72 h. Normal HFFF2s were then incubated with this CM for a further 72 h. (B) CM-treated HFFF2 fibroblasts were then stained to assess for the percentage of cells expressing markers of senescence: incorporation of BrdU and p-γH2AX by IF (means ± SEMs of 3–4 experiments; one-way ANOVA). (C) Representative pictures for p-γH2AX by IF of HFFF2s treated with the CM from iRAS with or without SpE or GW4869. Scale bar, 50 μm. (D) Schematic representation of the experimental settings and timings to test the implication of small EVs using the Transwell system with a membrane pore size of 0.4 μm. (E and F) The lower chamber was stained to quantify the percentage of cells incorporating BrdU and expressing p16INK4A by IF. Representative pictures and the quantification of BrdU incorporation (E) and p16INK4A (F) are shown. Scale bar, 100 μm. One-way ANOVA test was performed. All data show the means ± SEMs of 2–3 independent experiments. See also Figure S3.
Figure 4
Figure 4
Increase in CD63 Staining and Multivesicular Body Formation during Senescence In Vivo (A and B) Immunoblot for endogenous expression of (A) ALIX and TSG101 and (B) CD63. p21CIP and p16INK4A upregulation are positive controls to confirm the induction of senescence. β-Actin represents the loading control. (C) Immunohistochemistry for SA-β-Gal (blue staining) and CD63 (brown signal) in a representative human sample of lung fibrosis. H&E staining is shown (violet). Pictures at top represent areas enriched in SA-β-Gal+ cells, and pictures at bottom show areas with low SA-β-Gal+ cells. (D) Quantification of positive pixels for CD63 per field, normalized by the H&E staining. The Mann-Whitney test was performed. (E) Representative transmission electron microscopy images of multivesicular bodies (MVBs) in wild-type (WT) and KrasG12D-derived PanIN (KrasG12D). Scale bar, 500 nm. (F) Quantification of MVB per cell in WT (n = 28 cells) and PanINs (n = 19 cells). See also Figure S4.
Figure 5
Figure 5
The Uptake of sEVs Derived from Cells Undergoing Senescence Induces Paracrine Senescence (A) Schematic representation of HFFF2 fibroblasts used for the co-culture experiments. Co-culture of HFFF2 expressing a GFP plasmid and iRAS HFFF2 fibroblasts expressing a retroviral construct encoding for mCherry-CD63 (iRAS;CD63-ch). Cells were plated in a 1:1 ratio and treated with 4OHT for 48 h, followed by 3–4 days with fresh media. (B) Representative images showing the uptake of CD63-cherry+ sEVs (CD63-sEV) in GFP cells acquired with the super-resolution microscope Airyscan. Right, a 3D reconstruction of confocal z stack images showing CD63-sEVs inside GFP cells. Scale bar, 20 μm. (C) MCF7 breast cancer cells expressing a Cre recombinase construct (Cre+ MCF7) were treated with DMSO or 500 nM palbociclib (Palbo) for 10 days to induce senescence. sEVs were purified from Cre+ MCF7 cells (Cre-sEV) and used to treat MCF7 cells expressing a fluorescent reporter gene, which switches from expressing DsRed to eGFP upon sEV internalization (reporter MCF7). (D) Representative pictures showing sEV uptake (GFP+ cells) in reporter MCF7s treated with sEVs isolated from Cre+ MCF7 treated with DMSO or Palbo. GFP+ cells are also Sudan Black+. (E) Quantification of the percentage of GFP+ reporter MCF7 treated with sEVs presenting with Sudan Black staining. (F) Pictures display sEV uptake (GFP+) in reporter MCF7 cells incubated with Cre-sEVs from DMSO- or Palbo-treated cells. Arrows show that GFP+ cells treated with Cre-sEV from DMSO cells are also positive for Ki67, while GFP+ cells incubated with Cre-sEV from Palbo-treated cells are negative for Ki67. (G) Quantification of the percentage of GFP+/Ki67+ reporter MCF7 treated with sEVs purified from DMSO- or Palbo-treated Cre+ MCF7. (D and F) Scale bar, 100 μm. (H and I) GFP+ and DsRed+ MCF7 treated with sEVs from both DMSO and Palbo cells were sorted by FACS. (H) Scheme of the experimental settings. (I) Growth curve showing the GFP+ and DsRed+ MCF7 populations. See also Figure S5.
Figure 6
Figure 6
MS Proteomic Analysis Reveals a Specific Cargo in sEVs Derived from Senescent Cells (A) Scheme showing the mass spectrometry (MS) approach. sEVs were isolated from HFFF2 undergoing either OIS or DDIS from 2 independent experiments and were sent for label-free MS analysis. (B) DAVID GO analysis for the 1,600 proteins detected by the MS group into the “extracellular exosome” pathway. FDR, false discovery rate. (C) Venn diagram for proteins with >2 log2 differential expression and <0.01 FDR in sEVs released during OIS and DDIS compared to controls shows 265 common proteins that are deregulated during senescence. (D) GO analysis groups the 265 proteins into biological processes related to senescence-like “wound healing” and “response to wound healing.” (E) Comparison of the components of the soluble factors (SN) reported by Acosta et al. (2013) and the protein composition found within sEVs during senescence. IFITM3 is an example of a protein found specifically in the sEV fraction during senescence. (F) Schematic diagram showing the strategy used for the performance of the siRNA screen. Briefly, after transfection with the siRNA, the whole CM was washed out and replenished with fresh media for 72 h. (G) Screen using SMARTpool siRNA targeting the 50 most upregulated proteins in both OIS and DDIS with >4 peptide fold difference between control and senescence. Data show BrdU staining by IF for HFFF2s treated with different CM. A scramble siRNA (Scr) and siRNA targeting TP53 (sip53) and CDKN2A (sip16) were used as negative and positive controls (green bars). siIFITM3 is highlighted in red. Data represent the means ± SEMs of 3 independent experiments. See also Figure S6.
Figure 7
Figure 7
IFITM3 within sEVs Is Partially Responsible for Inducing Paracrine Senescence (A and B) HFFF2s incubated with sEVs derived from iRAS cells show an increase in transcripts related to the interferon (IFN) pathway (A)—in particular, IFITM (in red) and IFIT mRNAs, which are downregulated when treated with SpE. (B) IFITM transcripts are specifically shown. Data in (A) and (B) have been normalized to the control and represent the mean of 3 independent experiments (RPKM-log2 fold difference). (C and D) Immunoblotting analysis for IFITM3 in (C) cell lysates derived from iRAS HFFF2s transfected with Src or siIFITM3 and in (D) sEV (3 × 109 particles) from iC and iRAS cells. β-Actin and ALIX are used as loading controls. (E) sEVs from iC and iRAS were captured onto IFITM3-coated beads and the presence of CD81-PE determined by FACS. (F) Immunoblotting showing the absence of IFITM3 in sEVs (3 × 109 particles) derived from siIFITM3-treated cells. (G) IF staining for p16INK4A and IL-8 in HFFF2s treated with the same number of sEV (1 × 107 particles) derived from iC or iRAS transfected with or without siIFITM3. (H) Immunoblotting for IFITM3 present in sEVs derived from HFFF2 expressing an ectopic IFITM3 construct. (I) IF staining for p16INK4A and p-γH2AX in HFFF2s treated with sEVs derived from cells expressing IFITM3. (J and K) Immunoblotting (J) and quantification (K) for IFITM3 and CD63 protein expression levels in sEVs derived from the plasma of young (∼33 years old) and old (∼80 years old) donors. Gels were loaded based on equal protein levels. (A–I) Data representative of >3 experiments. See also Figure S7.

References

    1. Acosta J.C., O’Loghlen A., Banito A., Guijarro M.V., Augert A., Raguz S., Fumagalli M., Da Costa M., Brown C., Popov N. Chemokine signaling via the CXCR2 receptor reinforces senescence. Cell. 2008;133:1006–1018. - PubMed
    2. Acosta, J.C., O’Loghlen, A., Banito, A., Guijarro, M.V., Augert, A., Raguz, S., Fumagalli, M., Da Costa, M., Brown, C., Popov, N., et al. (2008). Chemokine signaling via the CXCR2 receptor reinforces senescence. Cell 133, 1006-1018. - PubMed
    1. Acosta J.C., Banito A., Wuestefeld T., Georgilis A., Janich P., Morton J.P., Athineos D., Kang T.W., Lasitschka F., Andrulis M. A complex secretory program orchestrated by the inflammasome controls paracrine senescence. Nat. Cell Biol. 2013;15:978–990. - PMC - PubMed
    2. Acosta, J.C., Banito, A., Wuestefeld, T., Georgilis, A., Janich, P., Morton, J.P., Athineos, D., Kang, T.W., Lasitschka, F., Andrulis, M., et al. (2013). A complex secretory program orchestrated by the inflammasome controls paracrine senescence. Nat. Cell Biol. 15, 978-990. - PMC - PubMed
    1. Caldwell M.E., DeNicola G.M., Martins C.P., Jacobetz M.A., Maitra A., Hruban R.H., Tuveson D.A. Cellular features of senescence during the evolution of human and murine ductal pancreatic cancer. Oncogene. 2012;31:1599–1608. - PMC - PubMed
    2. Caldwell, M.E., DeNicola, G.M., Martins, C.P., Jacobetz, M.A., Maitra, A., Hruban, R.H., and Tuveson, D.A. (2012). Cellular features of senescence during the evolution of human and murine ductal pancreatic cancer. Oncogene 31, 1599-1608. - PMC - PubMed
    1. Cossetti C., Iraci N., Mercer T.R., Leonardi T., Alpi E., Drago D., Alfaro-Cervello C., Saini H.K., Davis M.P., Schaeffer J. Extracellular vesicles from neural stem cells transfer IFN-γ via Ifngr1 to activate Stat1 signaling in target cells. Mol. Cell. 2014;56:193–204. - PMC - PubMed
    2. Cossetti, C., Iraci, N., Mercer, T.R., Leonardi, T., Alpi, E., Drago, D., Alfaro-Cervello, C., Saini, H.K., Davis, M.P., Schaeffer, J., et al. (2014). Extracellular vesicles from neural stem cells transfer IFN-γ via Ifngr1 to activate Stat1 signaling in target cells. Mol. Cell 56, 193-204. - PMC - PubMed
    1. Demaria M., O’Leary M.N., Chang J., Shao L., Liu S., Alimirah F., Koenig K., Le C., Mitin N., Deal A.M. Cellular Senescence Promotes Adverse Effects of Chemotherapy and Cancer Relapse. Cancer Discov. 2017;7:165–176. - PMC - PubMed
    2. Demaria, M., O’Leary, M.N., Chang, J., Shao, L., Liu, S., Alimirah, F., Koenig, K., Le, C., Mitin, N., Deal, A.M., et al. (2017). Cellular Senescence Promotes Adverse Effects of Chemotherapy and Cancer Relapse. Cancer Discov. 7, 165-176. - PMC - PubMed

Publication types