. 2019 Jun 25;27(13):3972-3987.e6.
doi: 10.1016/j.celrep.2019.05.089.

Physical and Molecular Landscapes of Mouse Glioma Extracellular Vesicles Define Heterogeneity

Affiliations

Physical and Molecular Landscapes of Mouse Glioma Extracellular Vesicles Define Heterogeneity

Aron Gyuris et al. Cell Rep. .

Abstract

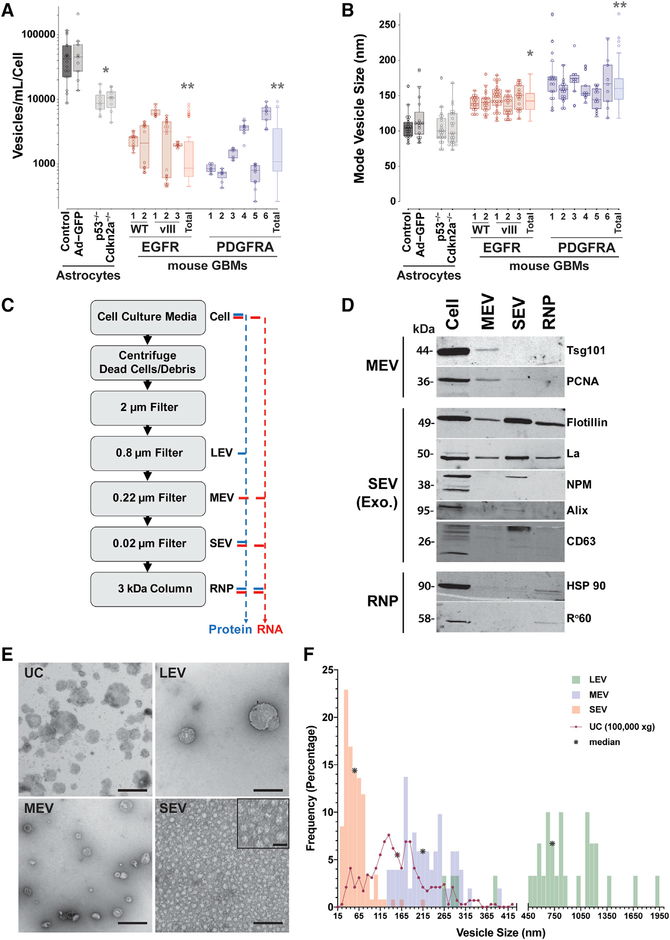
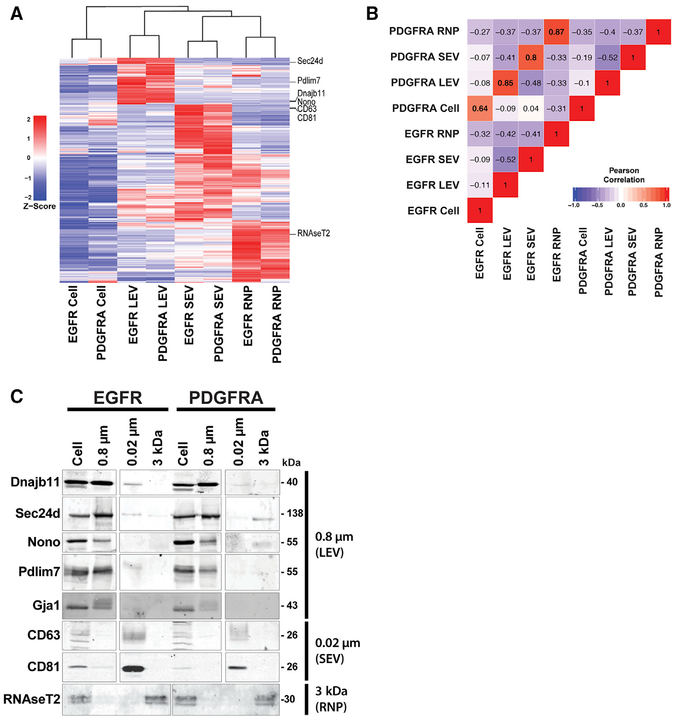
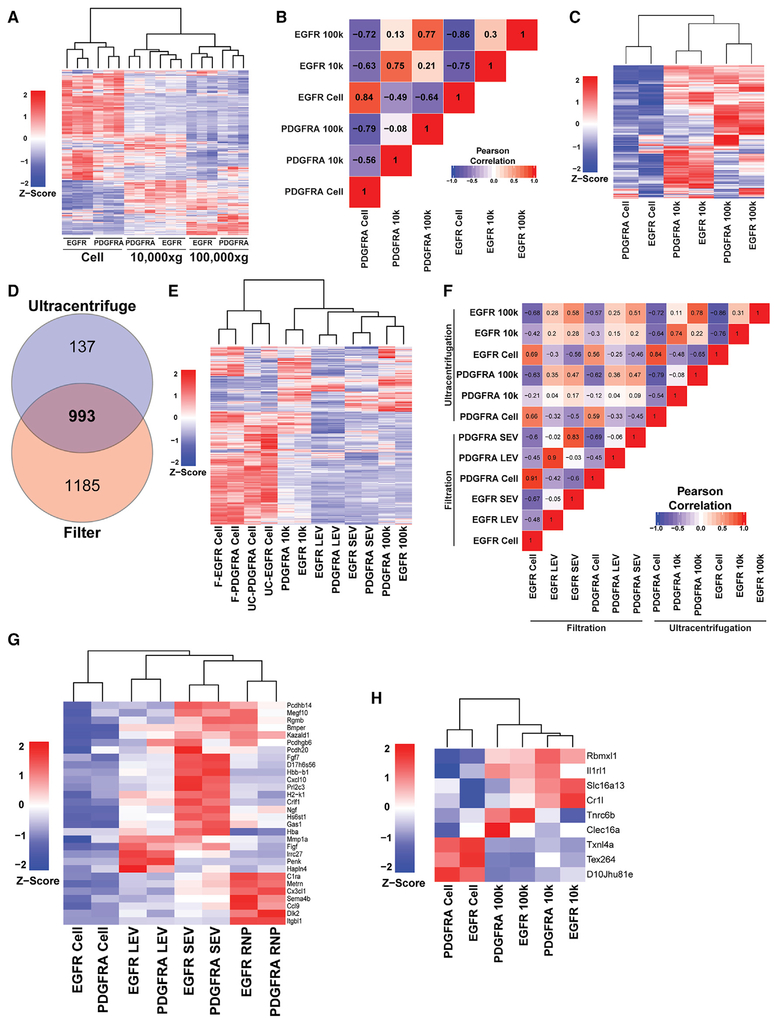
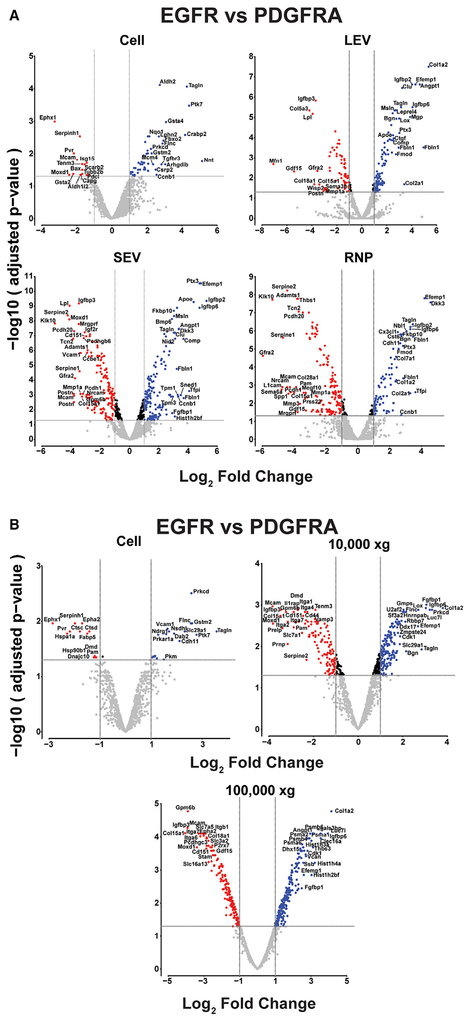
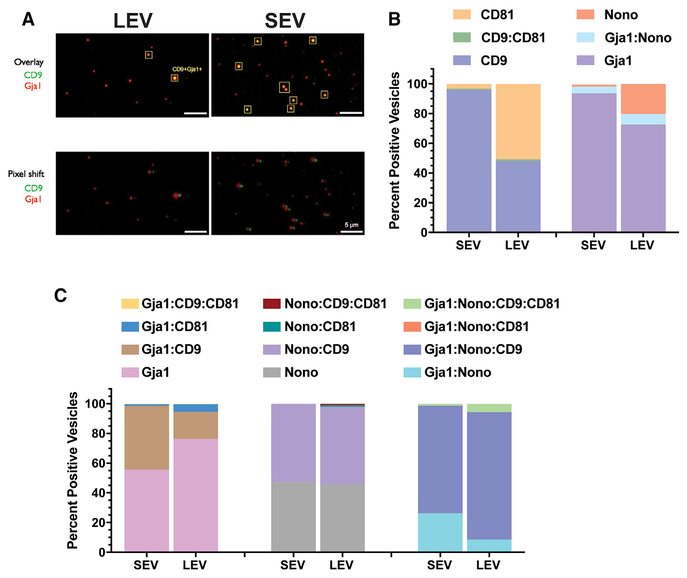
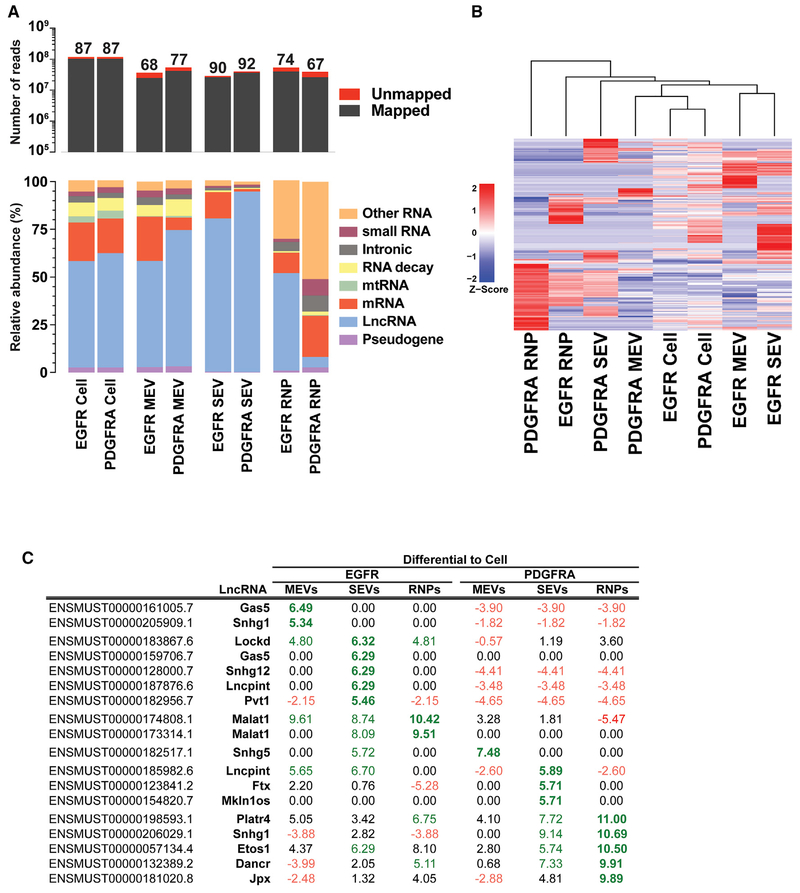
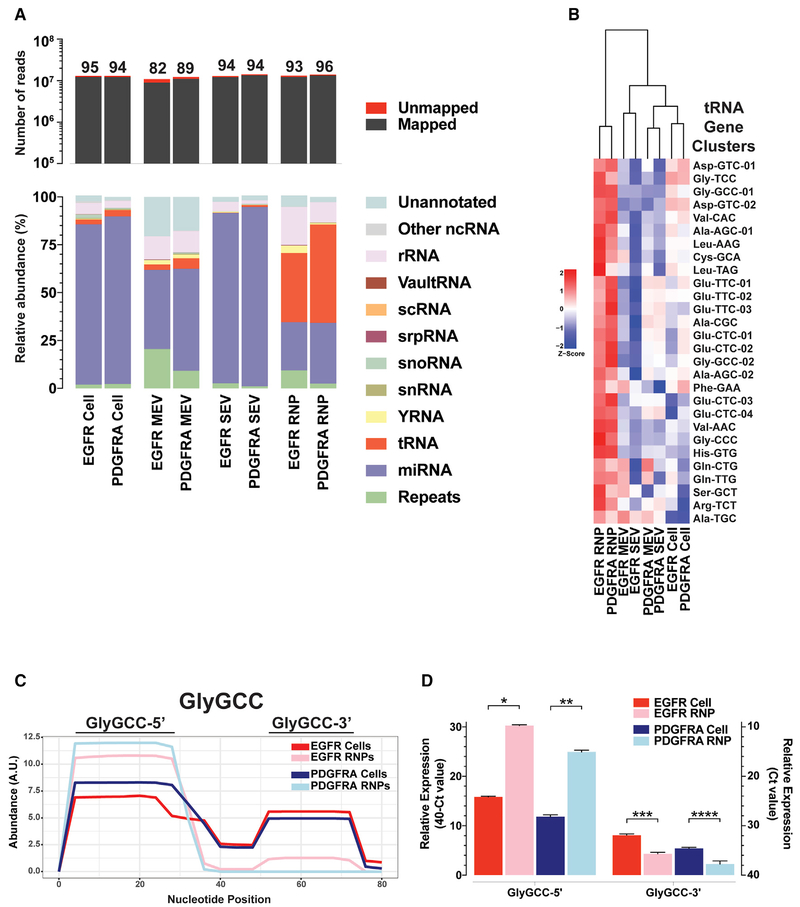
Cancer extracellular vesicles (EVs) are highly heterogeneous, which impedes our understanding of their function as intercellular communication agents and biomarkers. To deconstruct this heterogeneity, we analyzed extracellular RNAs (exRNAs) and extracellular proteins (exPTNs) from size fractionation of large, medium, and small EVs and ribonucleoprotein complexes (RNPs) from mouse glioblastoma cells by RNA sequencing and quantitative proteomics. mRNA from medium-sized EVs most closely reflects the cellular transcriptome, whereas small EV exRNA is enriched in small non-coding RNAs and RNPs contain precisely processed tRNA fragments. The exPTN composition of EVs and RNPs reveals that they are closely related by vesicle type, independent of their cellular origin, and single EV analysis reveals that small EVs are less heterogeneous in their protein content than larger ones. We provide a foundation for better understanding of segregation of macromolecules in glioma EVs through a catalog of diverse exRNAs and exPTNs.

Keywords: exosomes; extracellular RNA; extracellular vesicles; glioblastoma; mouse model; proteome.


Conflict of interest statement

DECLARATION OF INTERESTS

The authors declare no competing interests.

Figures

Figure 1.
Figure 1.. Extracellular Vesicle Analysis and Separation
(A and B) Nanosight nanoparticle tracking analysis (NTA) of primary mouse astrocytes and GBM cell cultures of the indicated genotypes. Multiple EGFR wild-type (WT), mutant EGFRvIII, and PDGFRA-driven primary cultures were analyzed. Each cell culture was grown in triplicate and each triplicate was individually imaged three times (30 s each). The p532lox, p532lox+AdGFP, p532lox+AdCre, and Cdkn2a−/− cultures were performed on two independent cell cultures for each and results were pooled. The individual EGFR and PDGFRA GBM lines were analyzed on at least two independent repeats on separate days. Boxplots represent an average of three NTA readings per sample and are plotted as quartiles of the dataset for each cell culture. Averages were analyzed for statistical significance using Welch’s unequal variance’s t test, two tailed, compared with control astrocytes. (A) Number of vesicles produced per volume of conditioned media normalized to number of cells over a period of 24 hours of incubation within vesicle-depleted culture media. *p = 0.0003, **p = 7.79 × 10⁻⁵. (B) Mode vesicle size for the indicated cell cultures as in (A). *p = 2.35 × 10⁻⁸, **p = 2.56 × 10⁻¹³. (C) Schema of vesicle isolation procedure by sequential filtration. Cell culture supernatants from primary glioblastoma cell lines were cleared of cellular debris and dead cells by centrifugation, and vesicles were partitioned by filtering through consecutively smaller pore-sized filters (2 μm,0.8 μm, 0.22 μm, 0.02 μm) and free protein complexes were concentrated with a 3 kDa size exclusion column. Proteins (blue) were isolated from the 0.8 μm, 0.22 μm, 0.02 μm, and 3 kDa fractions and RNA (red) was isolated from the 0.22 μm, 0.02 μm, and 3 kDa fractions and processed for proteomics and RNA-seq, respectively. (D) Representative photomicrograph of western blotting protein markers that specify different vesicle populations. Equal loading of total protein for each fraction was determined by bicinchoninic acid (BCA) and samples analyzed by silver staining and adjusted accordingly to ensure equal protein loading. Western blot was repeated at least twice and samples originated from a mouse EGFR WT primary GBM culture. (E) Representative photomicrographs of negative stain transmission electron microscopy (TEM) of EVs from ultracentrifugation (UC) and filter isolation. Vesicles in the size range of the filter pore sizes are observed in the LEV (0.8 μm), MEV (0.22 μm) and SEV (0.02 μm) fractions. Scale bars: 500 nm; SEV inset: 25 nm. TEM was repeated at least twice on biological replicates from a mouse EGFR WT primary GBM culture. (F) Frequency and size (vesicle diameter in nm) distribution of vesicles from negative stain TEM in (E). The number of vesicles measured: SEV n = 118; MEV n = 51; LEV n = 30; and UC n = 291. The median size in nm for each category is indicated with an asterisk (*). See also Figure S1.
Figure 2.
Figure 2.. Distinct Proteome Composition of Filtered Extracellular Vesicles
(A) Unsupervised hierarchical clustering analysis of Z score mean protein expression values for EV-and RNP-enriched proteins. A combined dataset of 366 proteins significantly enriched over cellular fraction was derived from each vesicle-RNP fraction from the 2,178 dataset to create the heatmap. Location of proteins used in (C) below are indicated in right margin. (B) Pearson correlation coefficients of a pairwise analysis of expression levels between cellular, EV, and RNP levels from the EGFR and PDGFRA GBM cell cultures. The values of the coefficient are indicated and are marked with background colors. Pearson correlation coefficients > 0.91 and < −0.91 are significant (p < 0.05) and correlation coefficients > 0.7 and < −0.7 are trend suggestive. (C) Validation of MS data by immunoblot analysis of EV- and RNP-specific proteins derived from (A). See also Figure S2.
Figure 3.
Figure 3.. exPTNs from Ultracentrifugation EVs Overlap with SEVs
(A) Unsupervised hierarchical clustering analysis of the z-score proportional protein expression values of 1,130 proteins identified in cells, 10,000 × g and 100,000 × g protein fractions. MS spectral count values were Z score normalized prior to cluster analysis. (B) Pearson correlation coefficients of a pairwise analysis of expression levels between cellular, 10,000 ×g and 100,000 × g protein levels from the EGFR and PDGFRA GBM cell cultures. The values of the coefficient are indicated and are marked with background colors. Pearson correlation coefficients > 0.91 and < −0.91 are significant (p < 0.05) and correlation coefficients > 0.7 and < −0.7 are trend suggestive. (C) Unsupervised hierarchical clustering analysis of Z score protein expression values for UC-enriched proteins. A combined dataset of 407 proteins significantly enriched over cellular fraction was derived from each UC fraction from the 1,130 dataset to create the heatmap. (D) Venn diagram of unique and common proteins identified in filtered and UC EVs isolated from conditioned medium from EGFR and PDGFRA GBM cells. Data represent three independent biological replicates. (E) Unsupervised hierarchical clustering analysis of Z score mean protein expression values for vesicle enriched proteins from filter and UC-enriched proteins. The combined dataset of 993 proteins from (D) was used create the heatmap. (F) Pearson correlation coefficients of a pairwise analysis of expression levels of the 993 proteins shared between cellular, LEV, SEV, and 10,000 × g and 100,000 × g from the EGFR and PDGFRA GBM cell cultures. The values of the coefficient are indicated and are marked with background colors. Pearson correlation coefficients > 0.91 and < −0.91 are significant (p < 0.05), and correlation coefficients > 0.7 and < −0.7 are trend suggestive. (G) Unsupervised clustering of 30 proteins, displayed on a vesicle-type basis, extracted from the 181 EV expressed proteins not previously described in Vesiclepedia or NCI-60 vesicle proteomic datasets. (H) Unsupervised clustering of the 9 UC-unique proteins, displayed on a UC fraction-type basis. See also Figure S3.
Figure 4.
Figure 4.. Genotype-centric EV Markers
(A) Volcano plot representations of the differentially expressed proteins in a pairwise comparison of EGFR to PDGFRA cells, LEVs, SEVs (exosomes), and RNPs. The significance cut-off was set to a FDR of 0.05 (−log(adj.P.val ≥ 1.3), the biological cut-off was set to a fold change of ± 2 fold (−1 ≥ log2 FC ≥ 1), the top and bottom 10% differentially expressed proteins are labeled with their corresponding gene ID. The four different color codes used represent insignificant proteins (gray), both biologically and statistically significant proteins preferentially enriched in PDGFRA cells-EVs-RNPs (blue) and preferentially enriched in EGFR cells-EVs-RNPs (red), and statistically but not biologically significant proteins enriched in EGFR or PDGFRA (black). (B) Volcano plot representation of the differentially expressed proteins in a pairwise comparison of EGFR to PDGFRA cells, 10,000 ×g and 100,000 ×g ultracentrifuged EVs, analyzed as in(A) above. See also Tables S1, S2, S3, and S4.
Figure 5.
Figure 5.. Single Vesicle Analysis of EV Fractions
(A) Representative photomicrographs of immunofluorescence labeling of EV markers from large extracellular vesicles (LEVs) and small extracellular vesicles (SEVs) filtered fractions isolated from EGFR primary cultures. Pixel shift controls for co-registration of markers in overlay. (B) Quantitative analysis (percentage) of singly or dually positive vesicles on a per vesicle basis for expression of CD9 and CD81 or Nono and Gja1 in LEV and SEV fractions. (C) Quantitative analysis of singly, dually or triple combinations of indicated markers on a per vesicle basis for expression of CD9, CD81, Nono, and Gja1 in LEV and SEV fractions. A total of 643 vesicles were analyzed from the LEV fraction and 1,648 vesicles were analyzed for the SEV fraction. See also Figure S4.
Figure 6.
Figure 6.. Relative Composition of Long RNA Classes in Cellular and EV Fractions
(A) Long RNA sequencing analysis of cellular, MEV, SEV (exosomal), and RNP RNAs from EGFR and PDGFRA GBM primary cultures. The top panel shows total read numbers of mappable reads (dark gray) and unmapped reads (red). The numbers above each column represent the percentage of mappable reads. The bottom panel shows the relative RNA composition in long RNA libraries. The data were normalized to the total number of annotated non-rRNA reads. Details of individual RNA species making up the RNA categories are found in Table S5. (B) Unsupervised hierarchical clustering analysis of Z score vesicle-enriched lncRNA expression values for cells, EV- and RNP-enriched lncRNAs in EGFR, and PDGFRA GBM cultures. (C) Degree of EV/RNP enrichment for selected lncRNAs. RNA-seq read counts for annotated lncRNAs were normalized for each sample. For each lncRNA, cell values were subtracted from MEVs, SEVs (exosomal), and RNPs. Positive values (green) represent enrichment for a given lncRNA in the indicated fraction, and negative values (red) represent depletion. See also Figure S5 and Table S5.
Figure 7.
Figure 7.. Relative Composition of Short RNA Classes in Cellular and EV Fractions
(A) Short RNA sequencing analysis of cellular, MEV, SEV (exosomal), and RNP small RNAs from EGFR and PDGFRA GBM primary cultures. The top panel shows total read numbers of mappable reads (dark gray) and unmapped reads (red). The bottom panel shows the relative RNA composition of the small RNA libraries. The data were normalized to the total number of annotated non-rRNA reads. Details of individual RNA species making up the RNA categories are found in Table S6. (B) Unsupervised hierarchical clustering analysis of z-score vesicle-enriched tRNA gene clusters expression values for cells, MEV-, SEV- (exosomal), and RNP-enriched tRNAs in EGFR and PDGFRA GBM cultures. Individual tRNA genes making up the tRNA categories are found in Table S7. (C) Depth plot of a representative example of relative abundance (on a per nucleotide-basis) of a given tRNA sequence (Gly-GCC) gene cluster, demonstrating precisely processed fragments of tRNA in cells and RNPs. (D) Graphical representation of expression levels by qRT-PCR of 5′ and 3′ directed custom Taqman probes for Gly-GCC tRNA gene from RNA isolated from EGFR and PDGFRA GBM primary cultures of cells and RNPs. Bar graphs represent an average of three qRT-PCR readings per sample. Averages were analyzed for statistical significance using Student’s t test, two tailed. *p < 0.0001, **p = 0.001, ***p = 0.005, and ****p = 0.012. See also Figure S6 and Tables S6 and S7.

References

    1. Acquaviva J, Jun HJ, Lessard J, Ruiz R, Zhu H, Donovan M, Woolfenden S, Boskovitz A, Raval A, Bronson RT, et al. (2011). Chronic activation of wild-type epidermal growth factor receptor and loss of Cdkn2a cause mouse glioblastoma formation. Cancer Res. 71, 7198–7206. - PMC - PubMed
    1. Anderson P, and Ivanov P (2014). tRNA fragments in human health and disease. FEBS Lett. 588, 4297–4304. - PMC - PubMed
    1. Balatti V, Pekarsky Y, and Croce CM (2017). Role of the tRNA-Derived Small RNAs in Cancer: New Potential Biomarkers and Target for Therapy. Adv. Cancer Res. 135, 173–187. - PubMed
    1. Beach A, Zhang HG, Ratajczak MZ, and Kakar SS (2014). Exosomes: an overview of biogenesis, composition and role in ovarian cancer. J.Ovarian Res 7, 14. - PMC - PubMed
    1. Beausoleil SA, Villén J, Gerber SA, Rush J, and Gygi SP (2006). A probability-based approach for high-throughput protein phosphorylation analysis and site localization. Nat. Biotechnol 24, 1285–1292. - PubMed

Publication types