. 2019 Jun 25;20(12):3101.
doi: 10.3390/ijms20123101.

Genome-Wide Analysis of ROS Antioxidant Genes in Resurrection Species Suggest an Involvement of Distinct ROS Detoxification Systems during Desiccation

Affiliations

Genome-Wide Analysis of ROS Antioxidant Genes in Resurrection Species Suggest an Involvement of Distinct ROS Detoxification Systems during Desiccation

Saurabh Gupta et al. Int J Mol Sci. .

Abstract

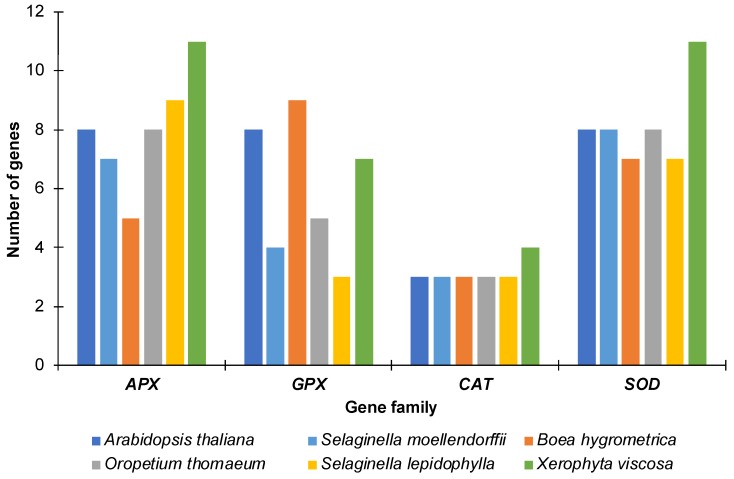
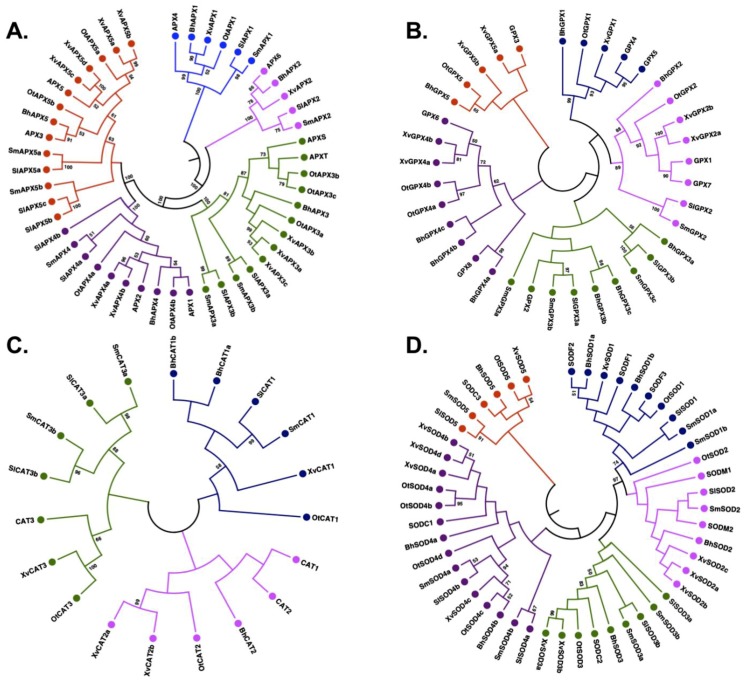
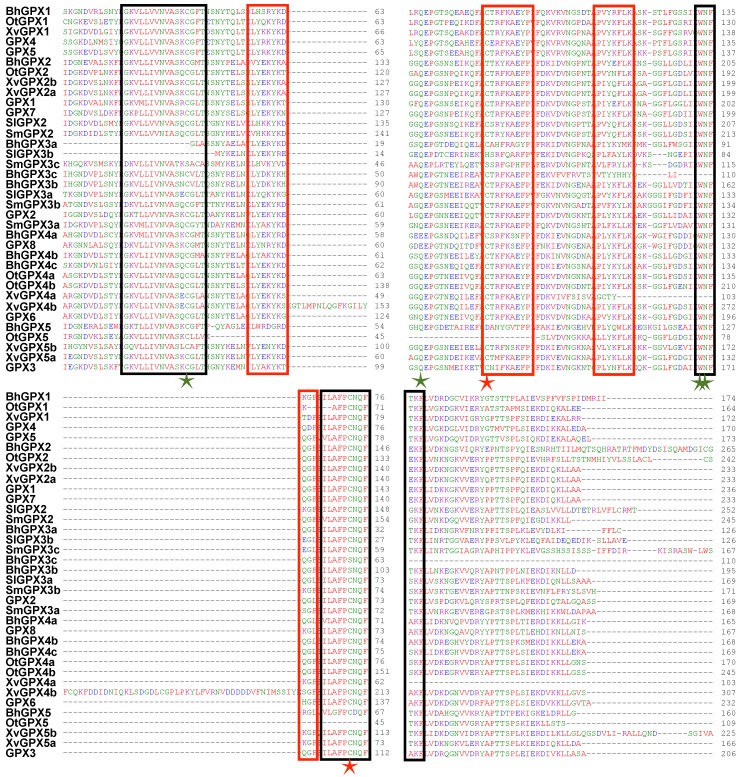
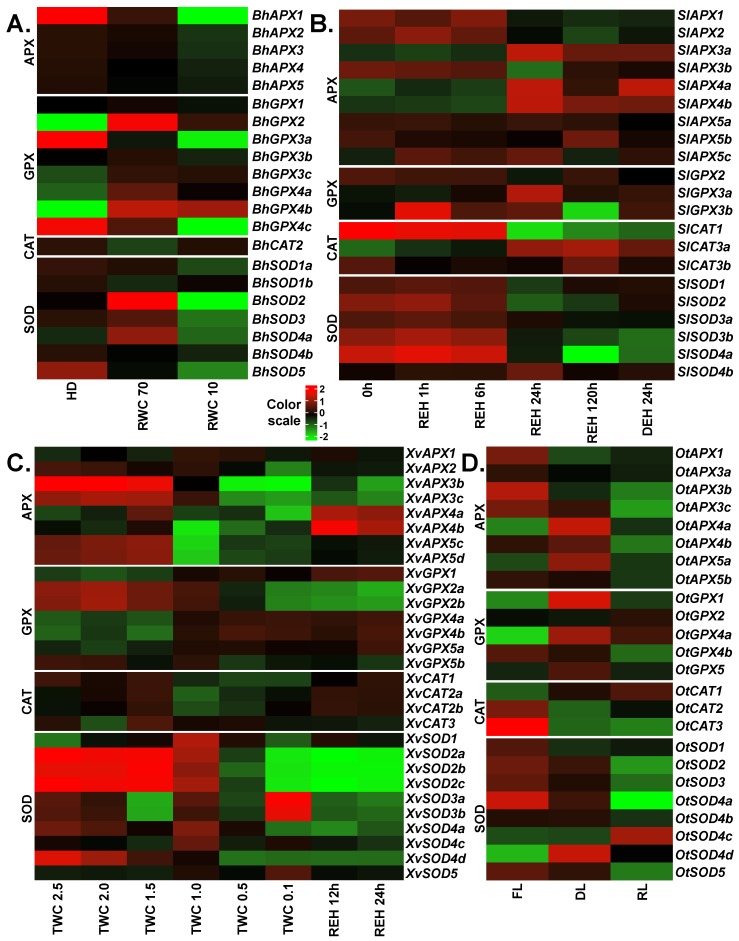
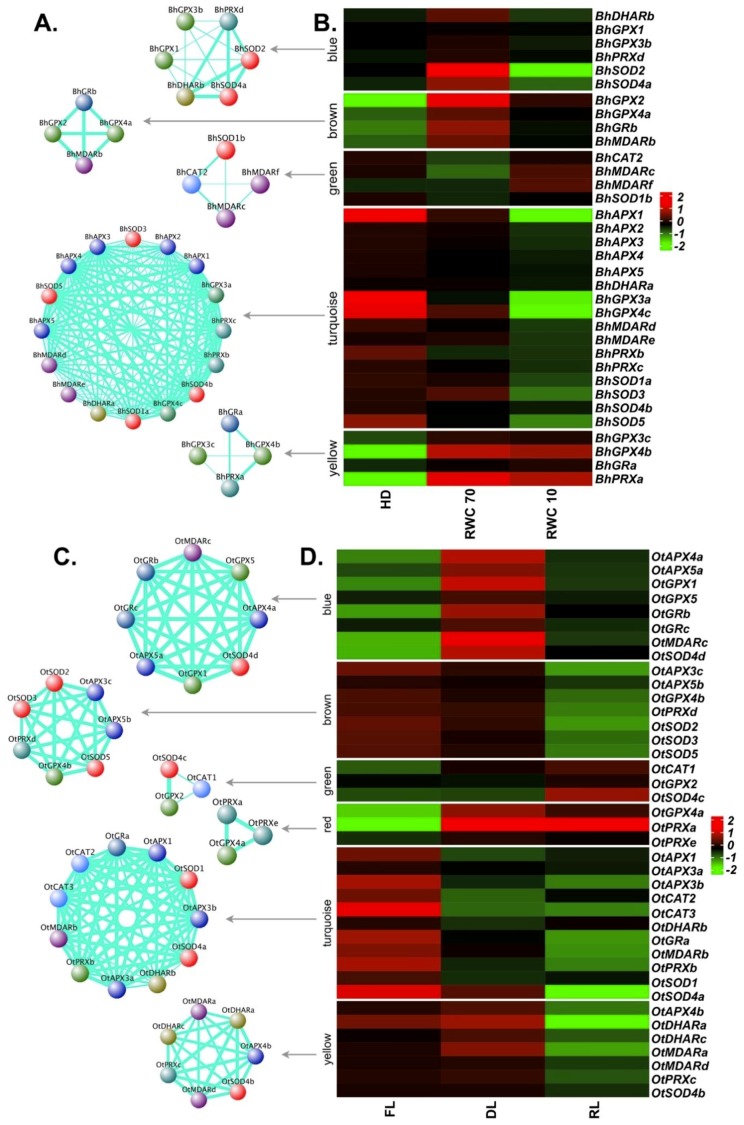
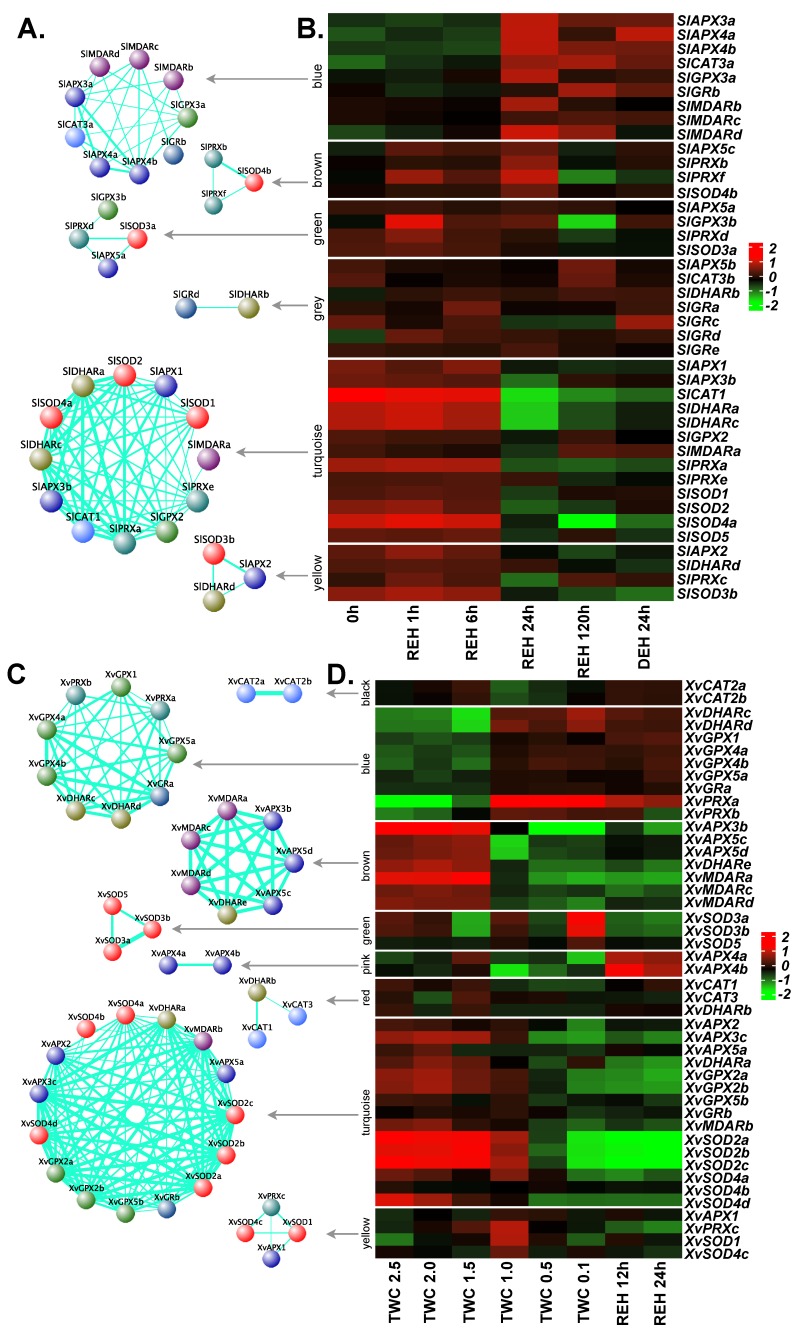
Abiotic stress is one of the major threats to plant crop yield and productivity. When plants are exposed to stress, production of reactive oxygen species (ROS) increases, which could lead to extensive cellular damage and hence crop loss. During evolution, plants have acquired antioxidant defense systems which can not only detoxify ROS but also adjust ROS levels required for proper cell signaling. Ascorbate peroxidase (APX), glutathione peroxidase (GPX), catalase (CAT) and superoxide dismutase (SOD) are crucial enzymes involved in ROS detoxification. In this study, 40 putative APX, 28 GPX, 16 CAT, and 41 SOD genes were identified from genomes of the resurrection species Boea hygrometrica, Selaginella lepidophylla, Xerophyta viscosa, and Oropetium thomaeum, and the mesophile Selaginella moellendorffii. Phylogenetic analyses classified the APX, GPX, and SOD proteins into five clades each, and CAT proteins into three clades. Using co-expression network analysis, various regulatory modules were discovered, mainly involving glutathione, that likely work together to maintain ROS homeostasis upon desiccation stress in resurrection species. These regulatory modules also support the existence of species-specific ROS detoxification systems. The results suggest molecular pathways that regulate ROS in resurrection species and the role of APX, GPX, CAT and SOD genes in resurrection species during stress.

Keywords: ROS; abiotic stress; ascorbate peroxidase; catalase; desiccation; glutathione peroxidase; resurrection plants; superoxide dismutase.


Conflict of interest statement

The authors declare no conflict of interest. The funding bodies had no role in experimental design, data analysis, interpretation and manuscript writing.

Figures

Figure 1
Figure 1
Number of genes for each family in the species analyzed. The number of genes identified for ascorbate peroxidase (APX), glutathione peroxidase (GPX), catalase (CAT) and superoxide dismutase (SOD) proteins in each species along with the number of genes found in Arabidopsis thaliana are represented as a bar graph.
Figure 2
Figure 2
Phylogenetic analysis of APX, GPX, CAT and SOD proteins. The phylogenetic tree for each gene family was constructed by the Neighbor-joining method implemented in MEGA7 with 500 bootstraps using orthologs from Arabidopsis thaliana. (A) APX proteins were divided into five clades, (B) GPX proteins were divided into five clades, (C) CAT proteins were divide into three clades, and (D) SOD proteins were divided into five clades. Different clades of trees are shown in different colors: I, blue; II, pink; III, green; IV, purple, and V, red. Bootstrap values of ≥ 50 are indicated.
Figure 3
Figure 3
Multiple sequence alignment (MSA) of GPX proteins. MSA of the GPX members identified in Boea hygrometrica, Selaginella lepidophylla, Xerophyta viscosa, Oropetium thomaeum, and Selaginella moellendorffii along with the GPX proteins from Arabidopsis thaliana are shown. The black rectangles represent the three highly conserved GPX domains, red rectangles mark highly conserved short signatures, four green stars represent the catalytic amino acid residues and red stars represents other evolutionary conserved Cys residues.
Figure 4
Figure 4
Expression profiles of APX, GPX, CAT and SOD genes upon desiccation stress in the resurrection species. The RNA-seq data from (A) Boea hygrometrica, (B) Selaginella lepidophylla, (C) Xerophyta viscosa and (D) Oropetium thomaeum were analyzed to obtain normalized expression values (TMM) for APX, GPX, CAT and SOD genes. Color scale represents the log2 transformed and mean centered TMM values. Genes with low or no expression values were removed. HD: fully hydrated; RWC: relative water content; 0h: three years after desiccation; REH: hours after rehydration; DEH: hours after dehydration post-rehydration; TWC: turgid water content; FL: fresh leaves; DL: desiccated leaves; RL: rehydrated leaves. RWC is calculated as (fresh weight–dry weight) × 100/(turgid weight – dry weight). TWC is the ratio of (fresh weight–dry weight) to dry weight.
Figure 5
Figure 5
Co-expression network and expression profiles for each module of reactive oxygen species (ROS)-related genes in B. hygrometrica and O. thomaeum. (A,B) B. hygrometrica. (C,D) O. thomaeum. (A,C) Each module is represented as a co-expression network obtained from weighted gene correlation network analysis (WGCNA) analysis. Nodes correspond to a gene and are colored based on the gene family. Thickness of the edges represent the weight. Edges below adjacency threshold of 0.02 and the nodes without edges were removed. (B,D) Expression profile for all the genes in the module are plotted as a heatmap. Color scale represents the log2 transformed and mean centered TMM values. HD: fully hydrated; RWC: relative water content; FL: fresh leaves; DL: desiccated leaves; RL: rehydrated leaves. RWC is calculated as (fresh weight–dry weight) × 100/(turgid weight–dry weight).
Figure 6
Figure 6
Co-expression network and expression profiles for each module of ROS-related genes in S. lepidophylla and X. viscosa. (A,B) S. lepidophylla. (C,D) X. viscosa. (A,C) Each module is represented as a co-expression network obtained from WGCNA analysis. Nodes correspond to a gene and are colored based on the gene family. Thickness of the edges represent the weight. Edges below adjacency threshold of 0.02 and the nodes without edges were removed. (B,D) Expression profile for all the genes in the module are plotted as a heatmap. Color scale represents the log2 transformed and mean centered TMM values. 0h: three years after desiccation; REH: hours after rehydration; DEH: hours after dehydration post-rehydration; TWC: turgid water content. TWC is the ratio of (fresh weight – dry weight) to dry weight.

References

    1. Gechev T.S., Van Breusegem F., Stone J.M., Denev I., Laloi C. Reactive oxygen species as signals that modulate plant stress responses and programmed cell death. Bioessays. 2006;28:1091–1101. doi: 10.1002/bies.20493. - DOI - PubMed
    1. Mhamdi A., Van Breusegem F. Reactive oxygen species in plant development. Development. 2018;145:dev164376. doi: 10.1242/dev.164376. - DOI - PubMed
    1. Gill S.S., Tuteja N. Reactive oxygen species and antioxidant machinery in abiotic stress tolerance in crop plants. Plant Physiol. Biochem. 2010;48:909–930. doi: 10.1016/j.plaphy.2010.08.016. - DOI - PubMed
    1. Alscher R.G., Erturk N., Heath L.S. Role of superoxide dismutases (SODs) in controlling oxidative stress in plants. J. Exp. Bot. 2002;53:1331–1341. doi: 10.1093/jexbot/53.372.1331. - DOI - PubMed
    1. Miller A.F. Superoxide dismutases: Ancient enzymes and new insights. FEBS Lett. 2012;586:585–595. doi: 10.1016/j.febslet.2011.10.048. - DOI - PMC - PubMed