Comparative Study
. 2019 Jun 26;51(1):32.
doi: 10.1186/s12711-019-0476-4.

Using imputed whole-genome sequence data to improve the accuracy of genomic prediction for parasite resistance in Australian sheep

Affiliations
Comparative Study

Using imputed whole-genome sequence data to improve the accuracy of genomic prediction for parasite resistance in Australian sheep

Mohammad Al Kalaldeh et al. Genet Sel Evol. .

Abstract

Background: This study aimed at (1) comparing the accuracies of genomic prediction for parasite resistance in sheep based on whole-genome sequence (WGS) data to those based on 50k and high-density (HD) single nucleotide polymorphism (SNP) panels; (2) investigating whether the use of variants within quantitative trait loci (QTL) regions that were selected from regional heritability mapping (RHM) in an independent dataset improved the accuracy more than variants selected from genome-wide association studies (GWAS); and (3) comparing the prediction accuracies between variants selected from WGS data to variants selected from the HD SNP panel.

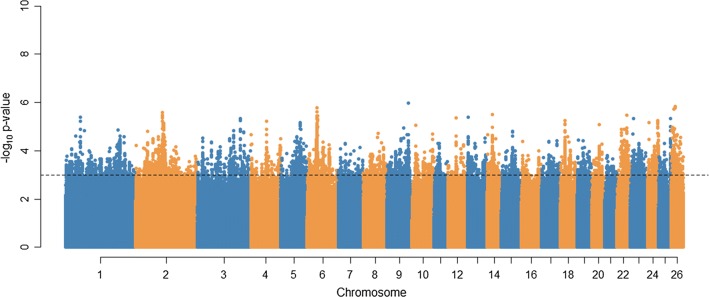
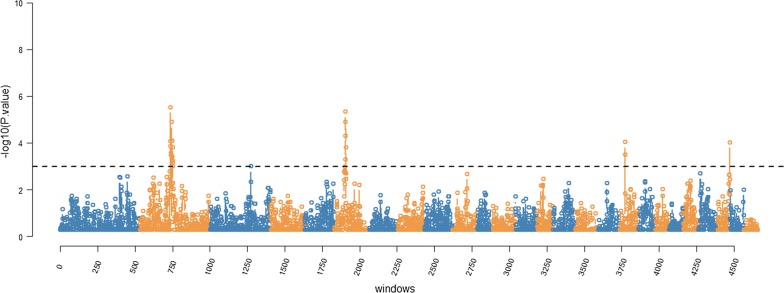
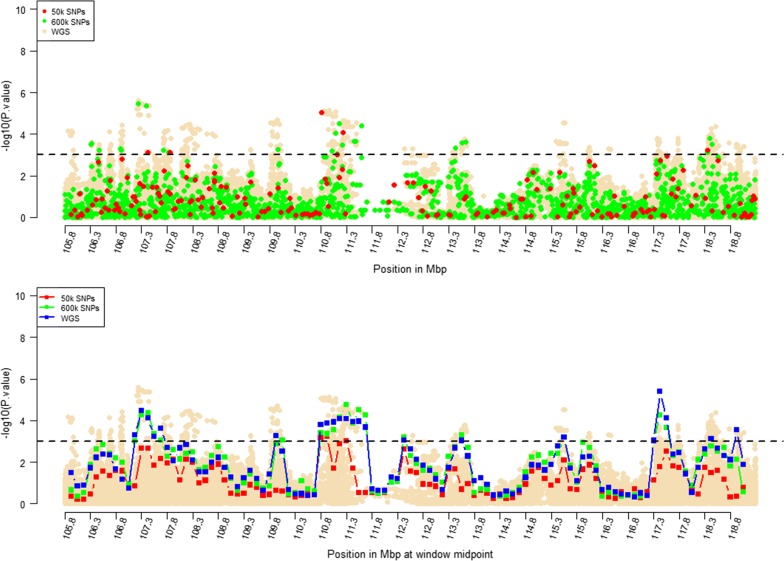
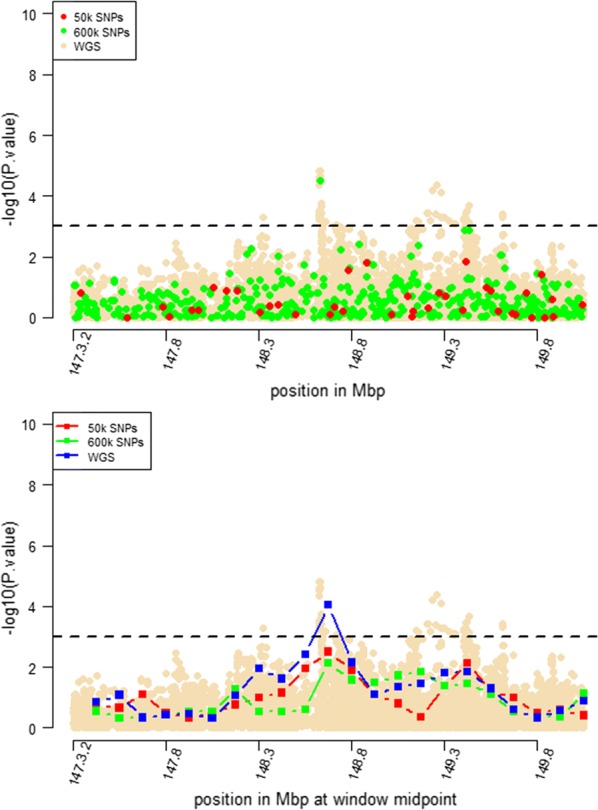
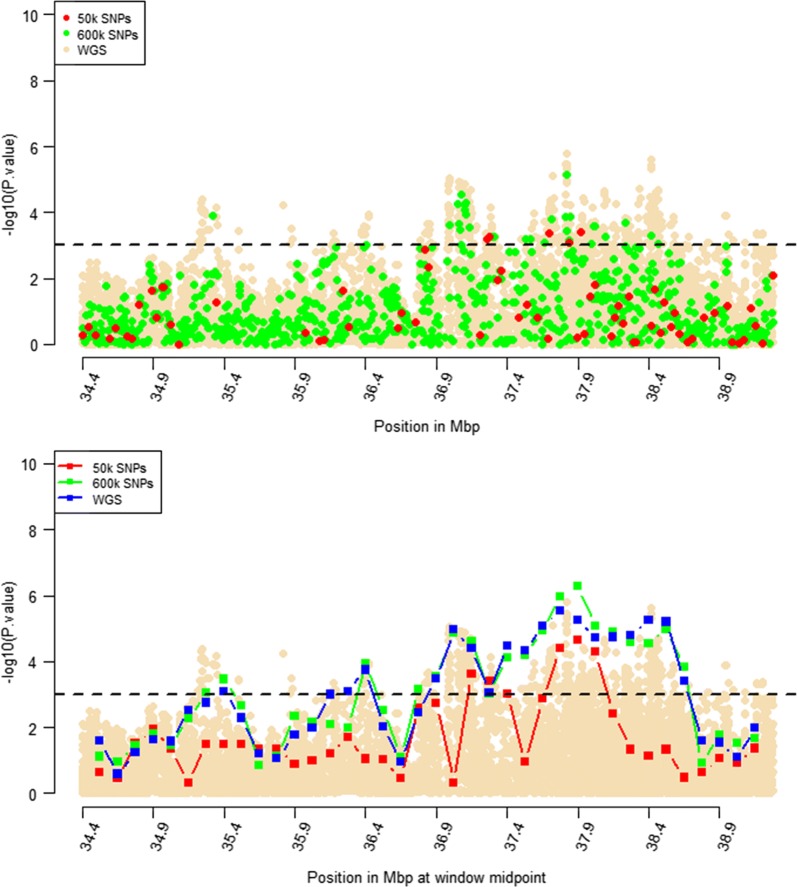
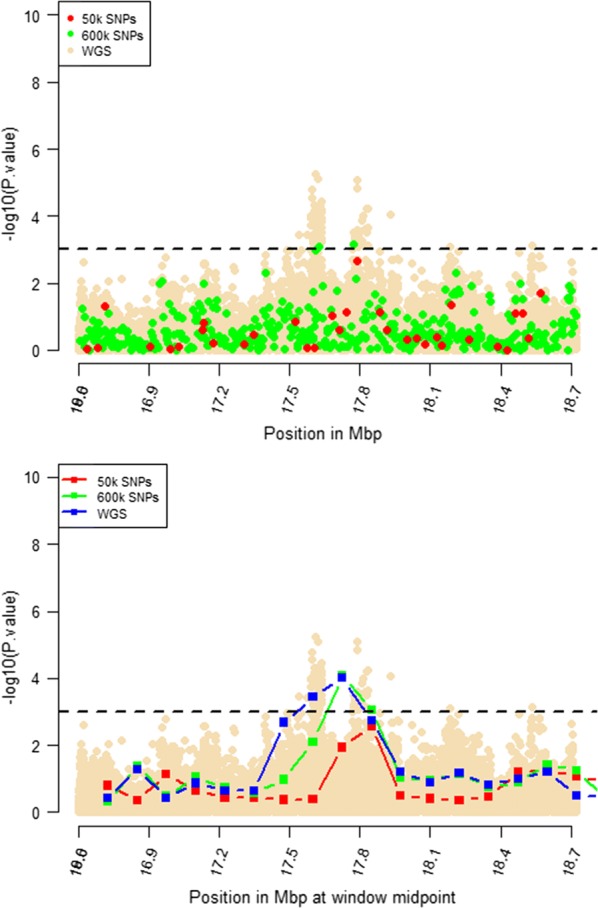
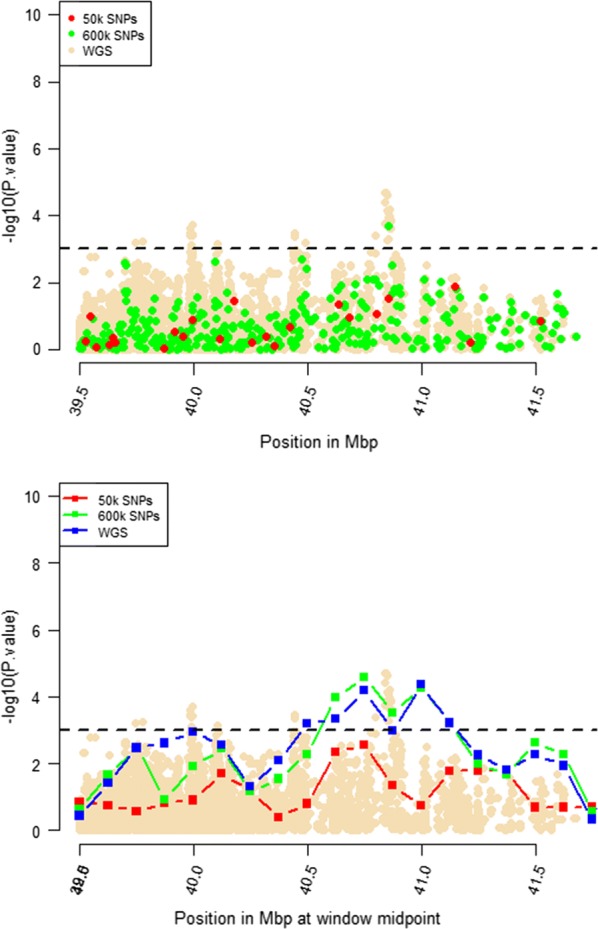
Results: The accuracy of genomic prediction improved marginally from 0.16 ± 0.02 and 0.18 ± 0.01 when using all the variants from 50k and HD genotypes, respectively, to 0.19 ± 0.01 when using all the variants from WGS data. Fitting a GRM from the selected variants alongside a GRM from the 50k SNP genotypes improved the prediction accuracy substantially compared to fitting the 50k SNP genotypes alone. The gain in prediction accuracy was slightly more pronounced when variants were selected from WGS data compared to when variants were selected from the HD panel. When sequence variants that passed the GWAS [Formula: see text] threshold of 3 across the entire genome were selected, the prediction accuracy improved by 5% (up to 0.21 ± 0.01), whereas when selection was limited to sequence variants that passed the same GWAS [Formula: see text] threshold of 3 in regions identified by RHM, the accuracy improved by 9% (up to 0.25 ± 0.01).

Conclusions: Our results show that through careful selection of sequence variants from the QTL regions, the accuracy of genomic prediction for parasite resistance in sheep can be improved. These findings have important implications for genomic prediction in sheep.


Conflict of interest statement

The authors declare that they have no competing interests.

Figures

Fig. 1
Fig. 1
Number of records according to age (in days)
Fig. 2
Fig. 2
Manhattan plot of GWAS results for parasite resistance in sheep. The y-axis shows the -log10(p) value for each marker and the x-axis shows the physical position of each marker across the genome. The dashed horizontal line corresponds to the -log10 (p value) threshold of 3
Fig. 3
Fig. 3
Manhattan plot of RHM results for parasite resistance in sheep. The y-axis shows the -log10 (p values) for each window and the x-axis shows the window number across the genome. The dashed horizontal line corresponds to the -log10 (p value) threshold of 3
Fig. 4
Fig. 4
GWAS (top plot) and RHM (bottom plot) results for the OAR2 region between 105 and 119 Mbp using three marker densities: 50k, HD, and WGS. Each window was positioned at its midpoint. Wheat-coloured dots are GWAS results from WGS variants
Fig. 5
Fig. 5
GWAS (top plot) and RHM (bottom plot) results for the OAR3 region between 147.3 and 148.8 Mbp using three marker densities: 50k, HD, and WGS. Each RHM result was positioned at its midpoint. Wheat-coloured dots are GWAS results from WGS variants
Fig. 6
Fig. 6
GWAS (top plot) and RHM (bottom plot) results for the OAR6 region between 34.4 and 36.9 Mbp using three marker densities: 50k, HD, and WGS. Each RHM result was positioned at its midpoint. Wheat-coloured dots are GWAS results from WGS variants
Fig. 7
Fig. 7
GWAS (top plot) and RHM (bottom plot) results for the OAR18 region between 16.8 and 18.7 Mbp using three marker densities: 50k, HD, and WGS. Each RHM result was positioned at its midpoint. Wheat-coloured dots are GWAS results from WGS variants
Fig. 8
Fig. 8
GWAS (top plot) and RHM (bottom plot) results for the OAR24 region between 39.6 and 41.5 Mbp using three marker densities: 50k, HD, and WGS. Each RHM result was positioned at its midpoint. Wheat-coloured dots are GWAS results from WGS variants
Fig. 9
Fig. 9
The proportion of phenotypic variance explained by each set of selected markers. Each coloured dot refers to a scenario with its corresponding number. Red dots represent scenarios using WGS data and blue dots represent scenarios using HD data. The x-axis represents the proportion of variance explained by each set of selected variants and the y-axis represents the prediction accuracy obtained when the selected variants were used for genomic prediction

References

    1. Lane J, Jubb T, Shepherd R, Webb-Ware J, Fordyce G. Priority list of endemic diseases for the red meat industries. Final Report. St Lucia: Meat & Livestock Australia L; 2015.
    1. Goddard ME, Hayes BJ, Meuwissen TH. Genomic selection in livestock populations. Genet Res. 2010;92:413–421. doi: 10.1017/S0016672310000613. - DOI - PubMed
    1. Van Binsbergen R, Calus MP, Bink MC, Eeuwijk FA, Schrooten C, Veerkamp RF. Genomic prediction using imputed whole-genome sequence data in Holstein Friesian cattle. Genet Sel Evol. 2015;47:71. doi: 10.1186/s12711-015-0149-x. - DOI - PMC - PubMed
    1. Veerkamp RF, Bouwman AC, Schrooten C, Calus MP. Genomic prediction using preselected DNA variants from a GWAS with whole-genome sequence data in Holstein-Friesian cattle. Genet Sel Evol. 2016;48:95. doi: 10.1186/s12711-016-0274-1. - DOI - PMC - PubMed
    1. MacLeod IM, Hayes BJ, Goddard ME. The effects of demography and long term selection on the accuracy of genomic prediction with sequence data. Genetics. 2014;114:1671–1684. doi: 10.1534/genetics.114.168344. - DOI - PMC - PubMed

Publication types

Substances

LinkOut - more resources