

Inhibition of mitochondrial complex 1 by the S6K1 inhibitor PF-4708671 partly contributes to its glucose metabolic effects in muscle and liver cells
- PMID: 31243102
- PMCID: PMC6690709
- DOI: 10.1074/jbc.RA119.008488
Inhibition of mitochondrial complex 1 by the S6K1 inhibitor PF-4708671 partly contributes to its glucose metabolic effects in muscle and liver cells
Abstract
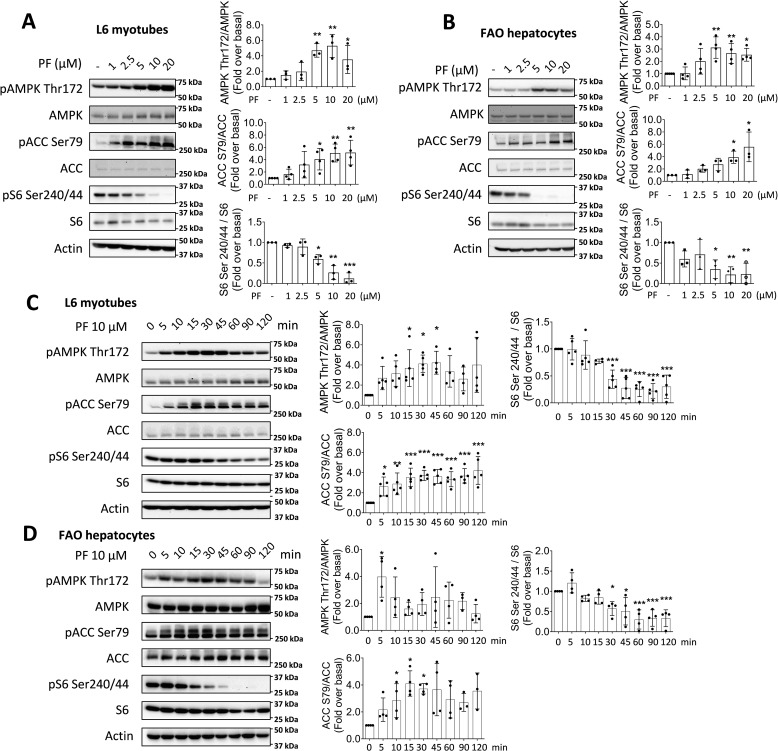
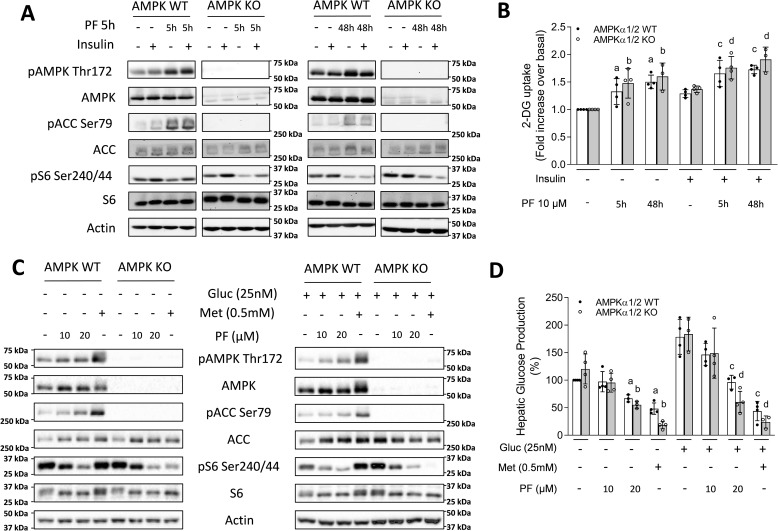
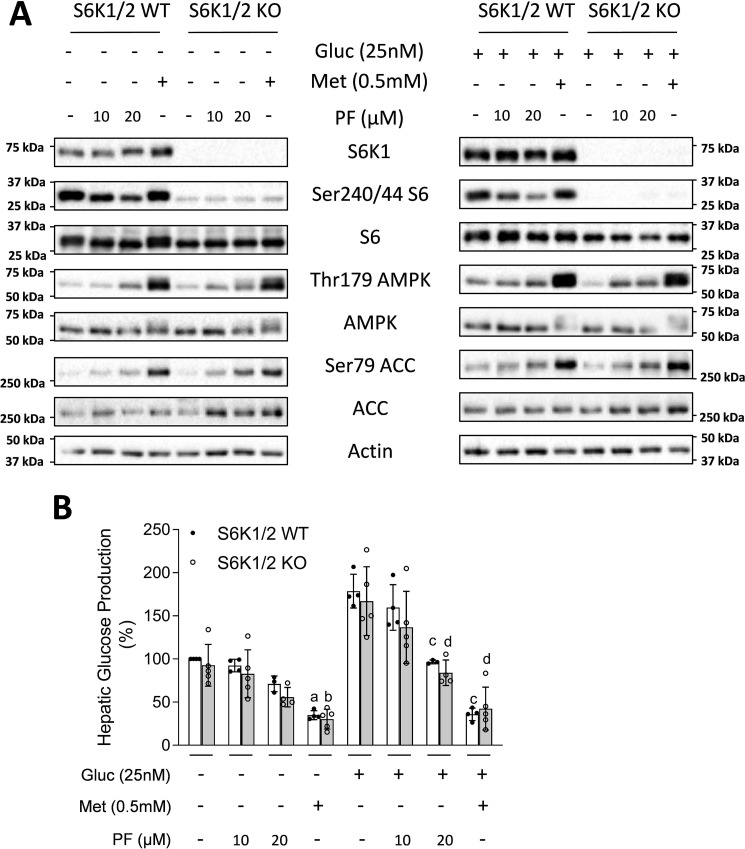
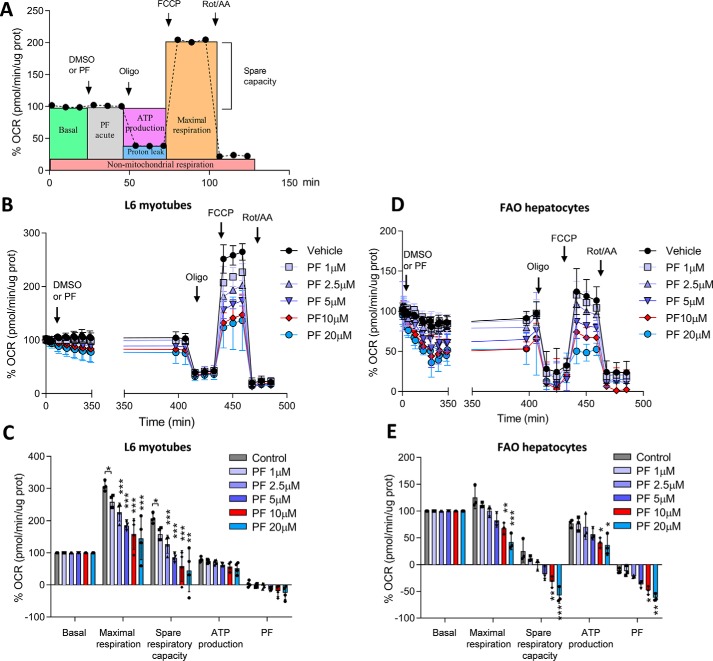
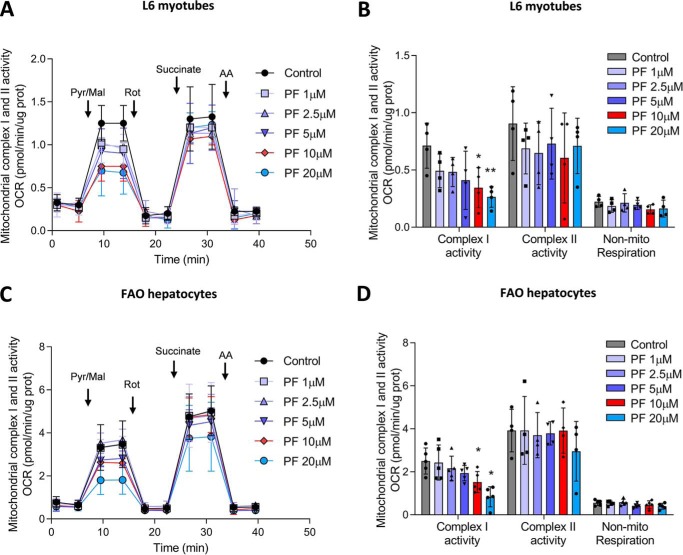
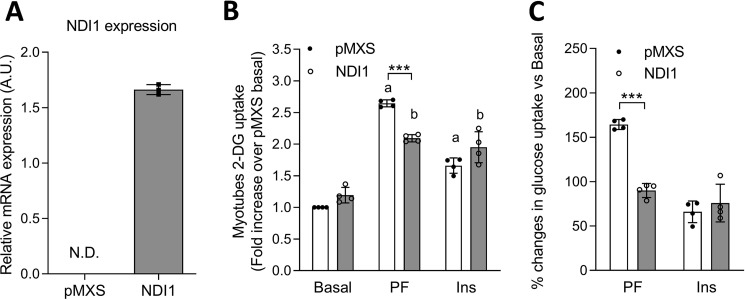
mTOR complex 1 (mTORC1) and p70 S6 kinase (S6K1) are both involved in the development of obesity-linked insulin resistance. Recently, we showed that the S6K1 inhibitor PF-4708671 (PF) increases insulin sensitivity. However, we also reported that PF can increase glucose metabolism even in the absence of insulin in muscle and hepatic cells. Here we further explored the potential mechanisms by which PF increases glucose metabolism in muscle and liver cells independent of insulin. Time course experiments revealed that PF induces AMP-activated protein kinase (AMPK) activation before inhibiting S6K1. However, PF-induced glucose uptake was not prevented in primary muscle cells from AMPK α1/2 double KO (dKO) mice. Moreover, PF-mediated suppression of hepatic glucose production was maintained in hepatocytes derived from AMPK α1/2-dKO mice. Remarkably, PF could still reduce glucose production and activate AMPK in hepatocytes from S6K1/2 dKO mice. Mechanistically, bioenergetics experiments revealed that PF reduces mitochondrial complex I activity in both muscle and hepatic cells. The stimulatory effect of PF on glucose uptake was partially reduced by expression of the Saccharomyces cerevisiae NADH:ubiquinone oxidoreductase in L6 cells. These results indicate that PF-mediated S6K1 inhibition is not required for its effect on insulin-independent glucose metabolism and AMPK activation. We conclude that, although PF rapidly activates AMPK, its ability to acutely increase glucose uptake and suppress glucose production does not require AMPK activation. Unexpectedly, PF rapidly inhibits mitochondrial complex I activity, a mechanism that partially underlies PF's effect on glucose metabolism.
Keywords: AMPK-activated protein kinase (AMPK); PF-4708671; diabetes; gluconeogenesis; glucose homeostasis; glucose metabolism; mechanistic target of rapamycin (mTOR); mitochondrial complex I; obesity; p70 S6 kinase (S6K1).
© 2019 Shum et al.
Conflict of interest statement
The authors declare that they have no conflicts of interest with the contents of this article
Figures
Similar articles
-
Pharmacological inhibition of S6K1 increases glucose metabolism and Akt signalling in vitro and in diet-induced obese mice.Diabetologia. 2016 Mar;59(3):592-603. doi: 10.1007/s00125-015-3839-6. Epub 2016 Jan 5. Diabetologia. 2016. PMID: 26733005
-
Characterization of PF-4708671, a novel and highly specific inhibitor of p70 ribosomal S6 kinase (S6K1).Biochem J. 2010 Oct 15;431(2):245-55. doi: 10.1042/BJ20101024. Biochem J. 2010. PMID: 20704563
-
The role of AMPK/mTOR/S6K1 signaling axis in mediating the physiological process of exercise-induced insulin sensitization in skeletal muscle of C57BL/6 mice.Biochim Biophys Acta. 2012 Nov;1822(11):1716-26. doi: 10.1016/j.bbadis.2012.07.008. Epub 2012 Jul 28. Biochim Biophys Acta. 2012. PMID: 22846606
-
Insulin resistance due to nutrient excess: is it a consequence of AMPK downregulation?Cell Cycle. 2011 Oct 15;10(20):3447-51. doi: 10.4161/cc.10.20.17886. Cell Cycle. 2011. PMID: 22067655 Free PMC article. Review.
-
AMP-activated protein kinase in the regulation of hepatic energy metabolism: from physiology to therapeutic perspectives.Acta Physiol (Oxf). 2009 May;196(1):81-98. doi: 10.1111/j.1748-1716.2009.01970.x. Epub 2009 Feb 19. Acta Physiol (Oxf). 2009. PMID: 19245656 Free PMC article. Review.
Cited by
-
Characterization of novel anoikis-related genes as prognostic biomarkers and key determinants of the immune microenvironment in esophageal cancer.Front Immunol. 2025 Jul 11;16:1599171. doi: 10.3389/fimmu.2025.1599171. eCollection 2025. Front Immunol. 2025. PMID: 40746552 Free PMC article.
-
Common Genetic Aberrations Associated with Metabolic Interferences in Human Type-2 Diabetes and Acute Myeloid Leukemia: A Bioinformatics Approach.Int J Mol Sci. 2021 Aug 28;22(17):9322. doi: 10.3390/ijms22179322. Int J Mol Sci. 2021. PMID: 34502231 Free PMC article.
-
PPM1H is down-regulated by ATF6 and dephosphorylates p-RPS6KB1 to inhibit progression of hepatocellular carcinoma.Mol Ther Nucleic Acids. 2023 Jun 19;33:164-179. doi: 10.1016/j.omtn.2023.06.013. eCollection 2023 Sep 12. Mol Ther Nucleic Acids. 2023. PMID: 37456776 Free PMC article.
-
Camel milk exosomes regulate glucose metabolism by inhibiting mitochondrial complex I in hepatocytes.BMC Vet Res. 2025 Feb 22;21(1):85. doi: 10.1186/s12917-025-04555-9. BMC Vet Res. 2025. PMID: 39987092 Free PMC article.
-
Breast adipose tissue-derived extracellular vesicles from obese women alter tumor cell metabolism.EMBO Rep. 2023 Dec 6;24(12):e57339. doi: 10.15252/embr.202357339. Epub 2023 Nov 6. EMBO Rep. 2023. PMID: 37929643 Free PMC article.
References
-
- Tremblay F., and Marette A. (2001) Amino acid and insulin signaling via the mTOR/p70 S6 kinase pathway: a negative feedback mechanism leading to insulin resistance in skeletal muscle cells. J. Biol. Chem. 276, 38052–38060 - PubMed
Publication types
MeSH terms
Substances
Grants and funding
LinkOut - more resources
Full Text Sources
Molecular Biology Databases
Research Materials
Miscellaneous
