. 2019 Jul-Aug;16(4):229-244.
doi: 10.21873/cgp.20128.

Diagnosis of Non-small Cell Lung Cancer for Early Stage Asymptomatic Patients

Affiliations

Diagnosis of Non-small Cell Lung Cancer for Early Stage Asymptomatic Patients

Cherylle Goebel et al. Cancer Genomics Proteomics. 2019 Jul-Aug.

Abstract

Background/aim: In 2016 in the United States, 7 of 10 patients were estimated to die following lung cancer diagnosis. This is due to a lack of a reliable screening method that detects early-stage lung cancer. Our aim is to accurately detect early stage lung cancer using algorithms and protein biomarkers.

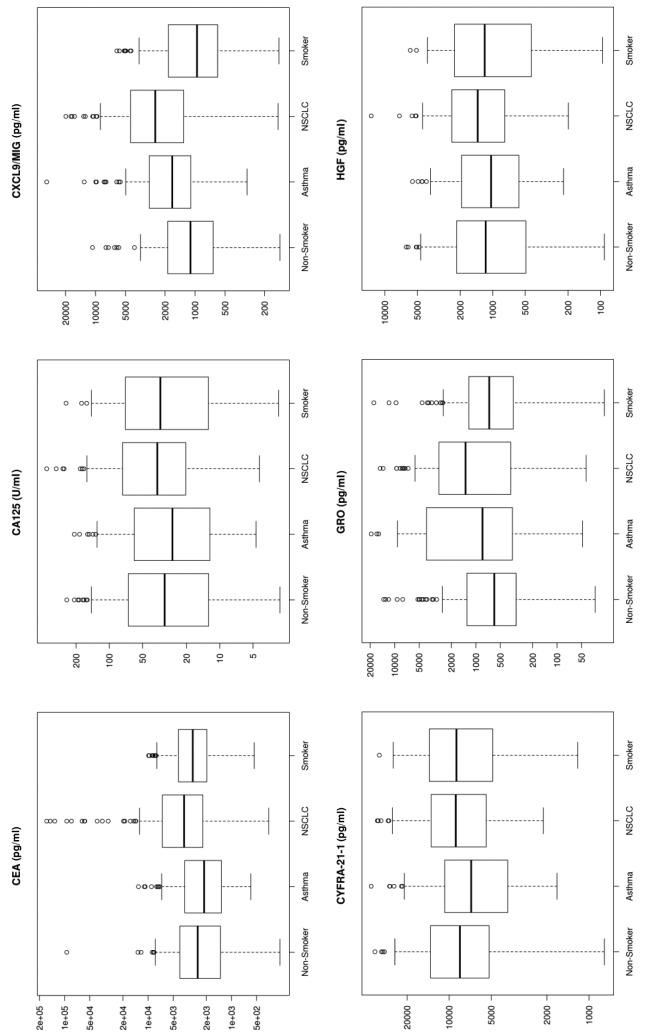
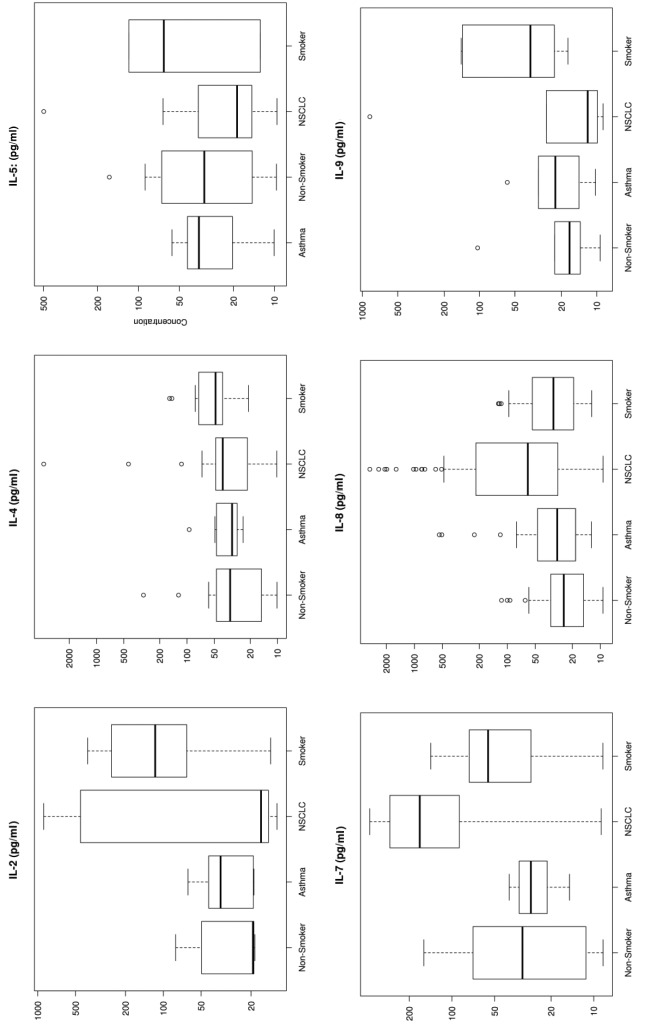
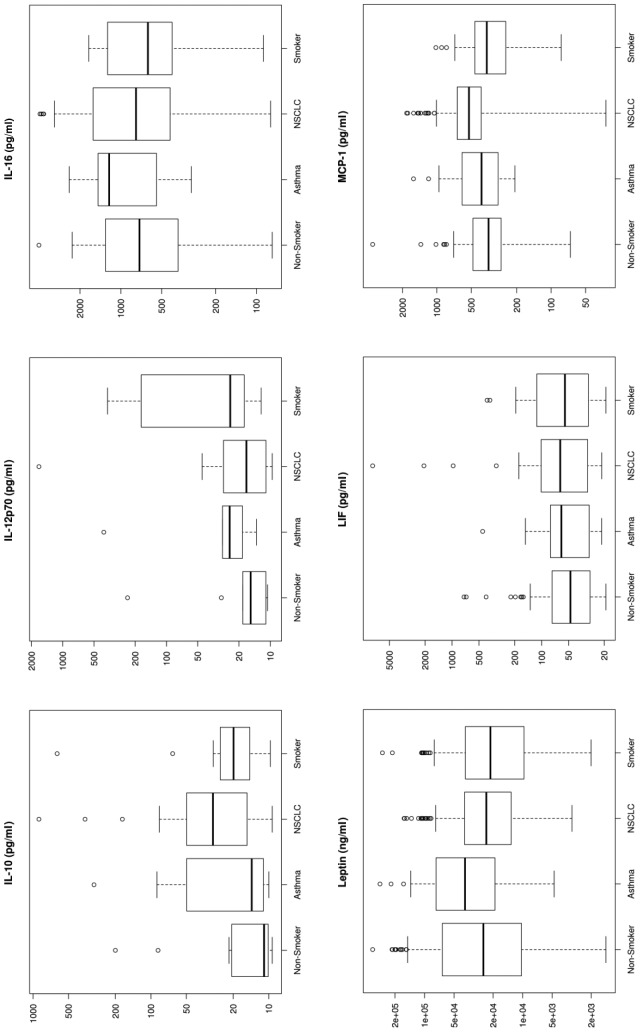
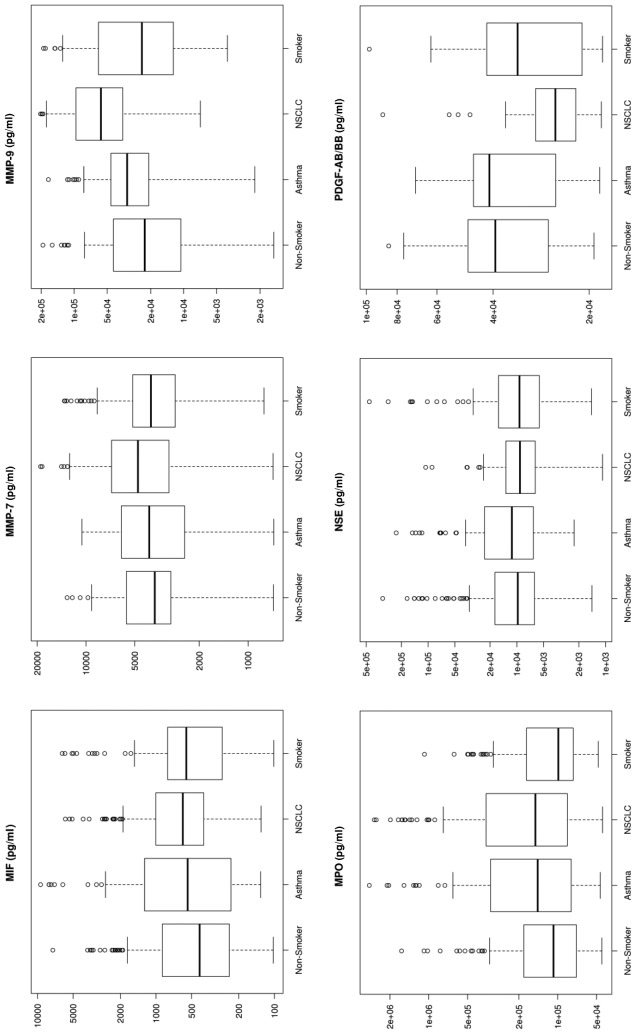
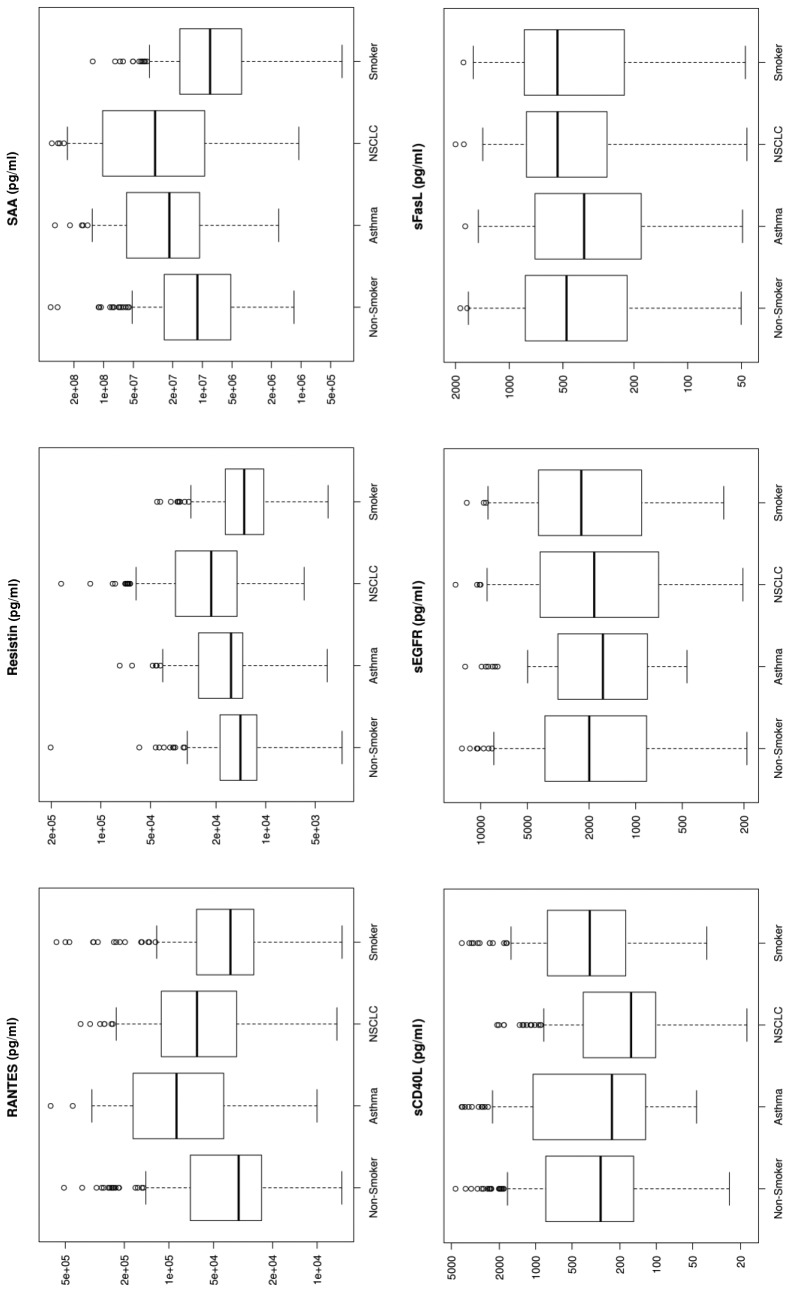
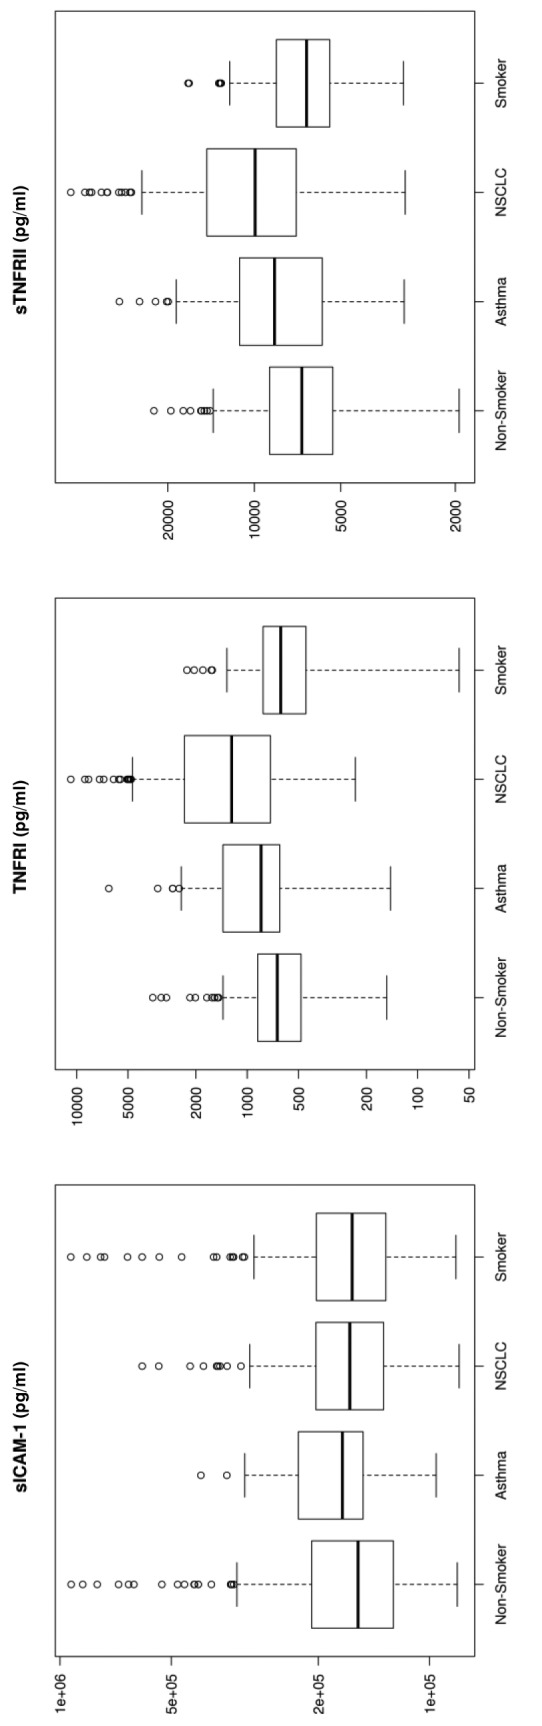
Patients and methods: A total of 1,479 human plasma samples were processed using a multiplex immunoassay platform. 82 biomarkers and 6 algorithms were explored. There were 351 NSCLC samples (90.3% Stage I, 2.3% Stage II, and 7.4% Stage III/IV).

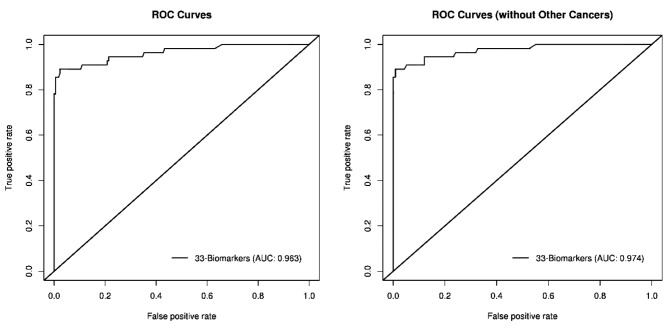
Results: We identified 33 protein biomarkers and developed a classifier using Random Forest. Our test detected early-stage Non-Small Cell Lung Cancer (NSCLC) with a 90% accuracy, 80% sensitivity, and 95% specificity in the validation set using the 33 markers.

Conclusion: A specific, non-invasive, early-detection test, in combination with low-dose computed tomography, could increase survival rates and reduce false positives from screenings.

Keywords: Early stage lung cancer; biomarkers; detection; diagnosis; immunoassay; non-small cell lung cancer; proteomics.


Conflict of interest statement

Thomas Long serves as the Chief Executive Officer and Chief Financial Officer for Lung Cancer Proteomics LLC. Cherylle Goebel and Chris Louden are consultants for Lung Cancer Proteomics LLC.

Figures

Figure 1
Figure 1. Box plots for each of the 33 analytes. These plots show the distribution of each pathology cohort’s biomarker concentration. Each box represents the interquartile range (from the 25th percentile to the 75th). The bar in the middle of the box is the median. The tails on either end of the box (if present) reach out to the minimum and maximum. If there are values greater than 1.5 times the interquartile range plus the 75th percentile (or less than the 25th percentile minus 1.5 times the interquartile range), they are represented by individual points.
Figure 2
Figure 2. AUC/ROC graphs.

References

    1. American Cancer Society Global Cancer Facts & Figures 4th Edition. Atlanta: American Cancer Society. 2018. pp. 25–28. Available at: https://www.cancer.org/content/dam/cancer-org/research/cancer-facts-and-.... Last accessed on 8th May 2019.
    1. SEER 18 2009-2015: All Races, Both Sexes by SEER Summary Stage 2000. Available at: https://seer.cancer.gov/statfacts/html/lungb.html. Last accessed on 8th May 2019.
    1. American Cancer Society Facts & Figures 2019: Table 1. Estimated Number* of New Cancer Cases and Deaths by Sex, US, 2019. American Cancer Society. Atlanta. 2019. pp. 4–19. Available at: https://www.cancer.org/content/dam/cancerorg/research/cancer-facts-and-s.... Last accessed on 8th May 2019.
    1. Birring SS, Peake MD. Symptoms and the early diagnosis of lung cancer. Thorax. 2005;60(4):268–269. PMID: 15790977. - PMC - PubMed
    1. Ellis PM, Vandermeer R. Delays in the diagnosis of lung cancer. J Thorac Dis. 2011;3(3):183–188. PMID: 22263086. - PMC - PubMed