. 2019 Jun 26;11(498):eaat8549.
doi: 10.1126/scitranslmed.aat8549.

Pediatric patients with acute lymphoblastic leukemia generate abundant and functional neoantigen-specific CD8+ T cell responses

Affiliations

Pediatric patients with acute lymphoblastic leukemia generate abundant and functional neoantigen-specific CD8+ T cell responses

Anthony E Zamora et al. Sci Transl Med. .

Abstract

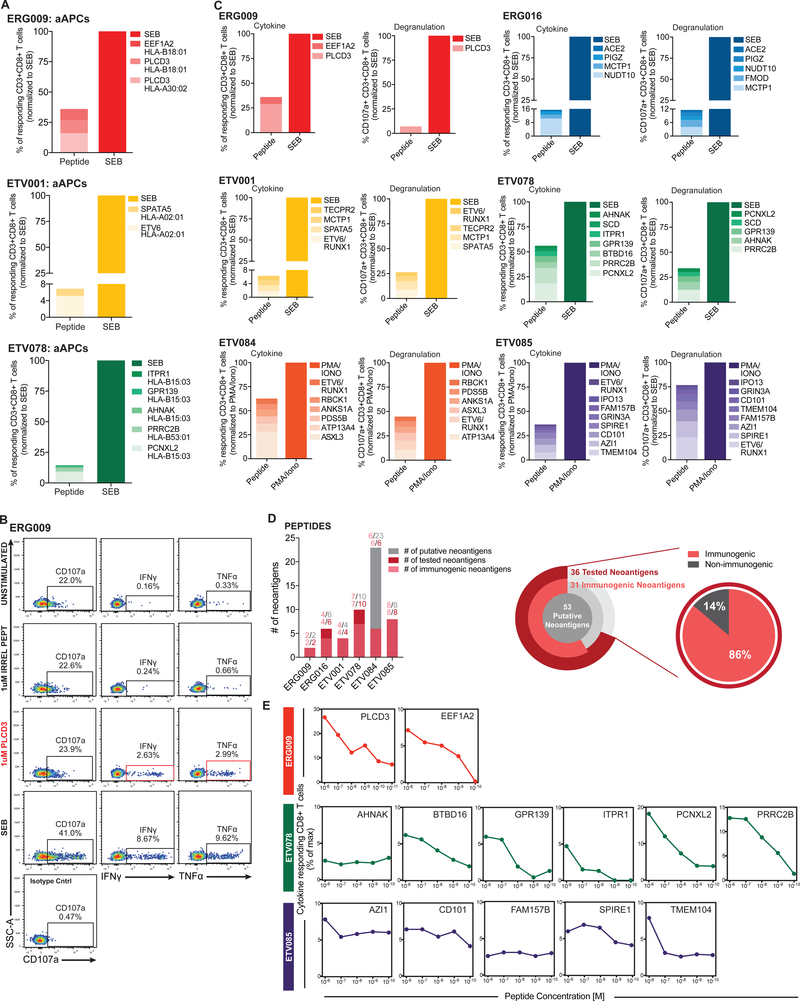
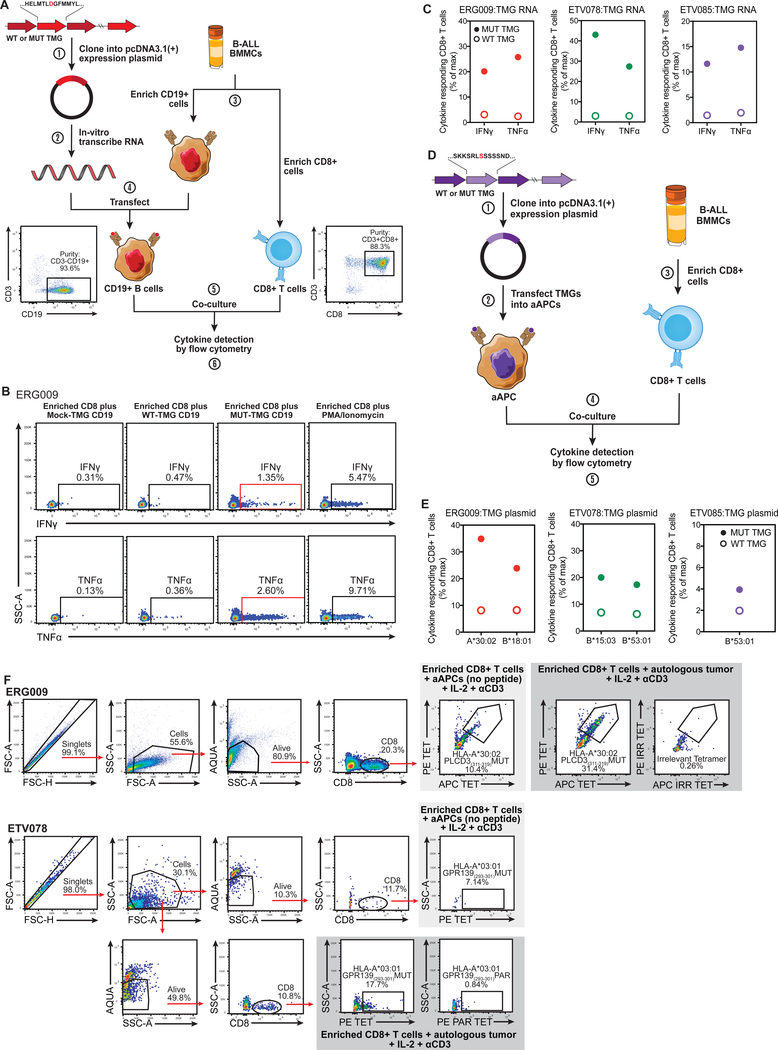
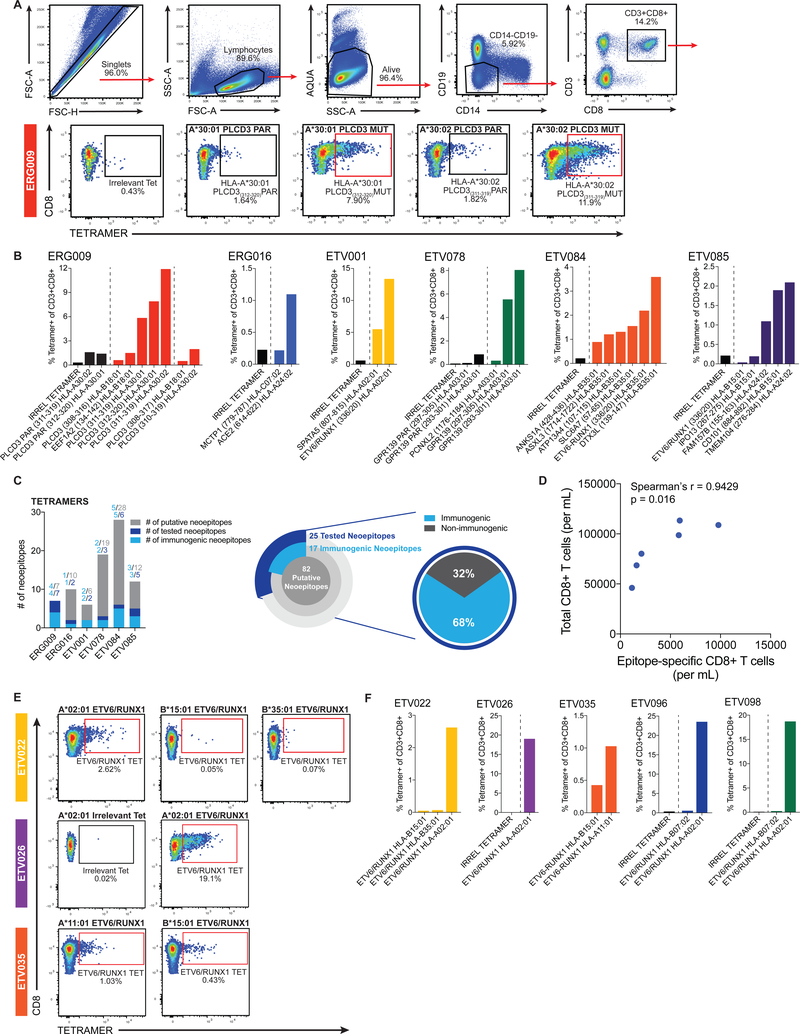
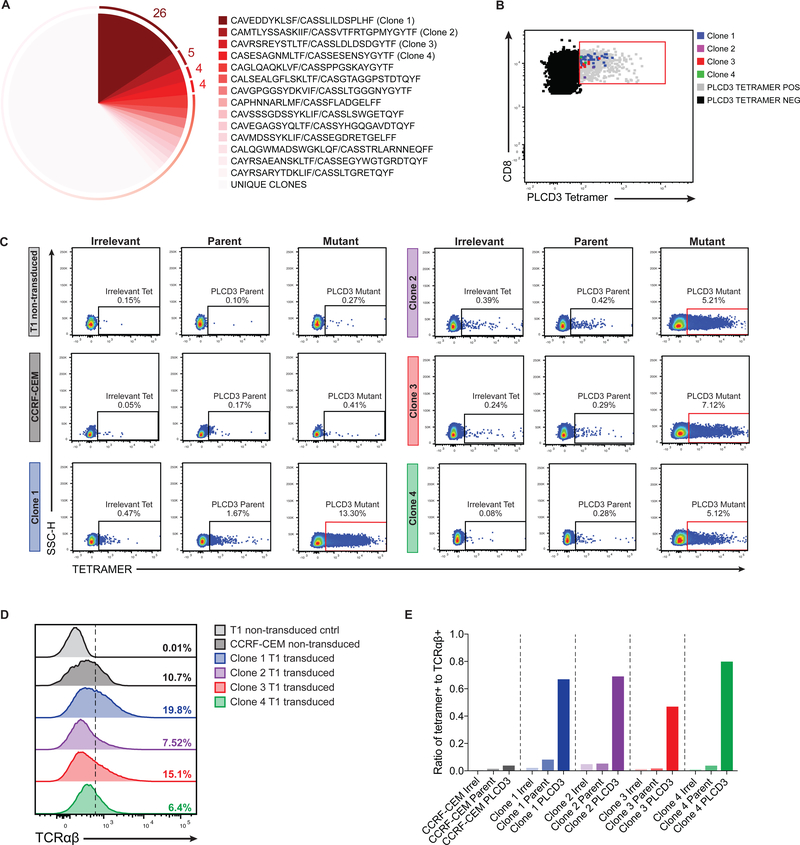
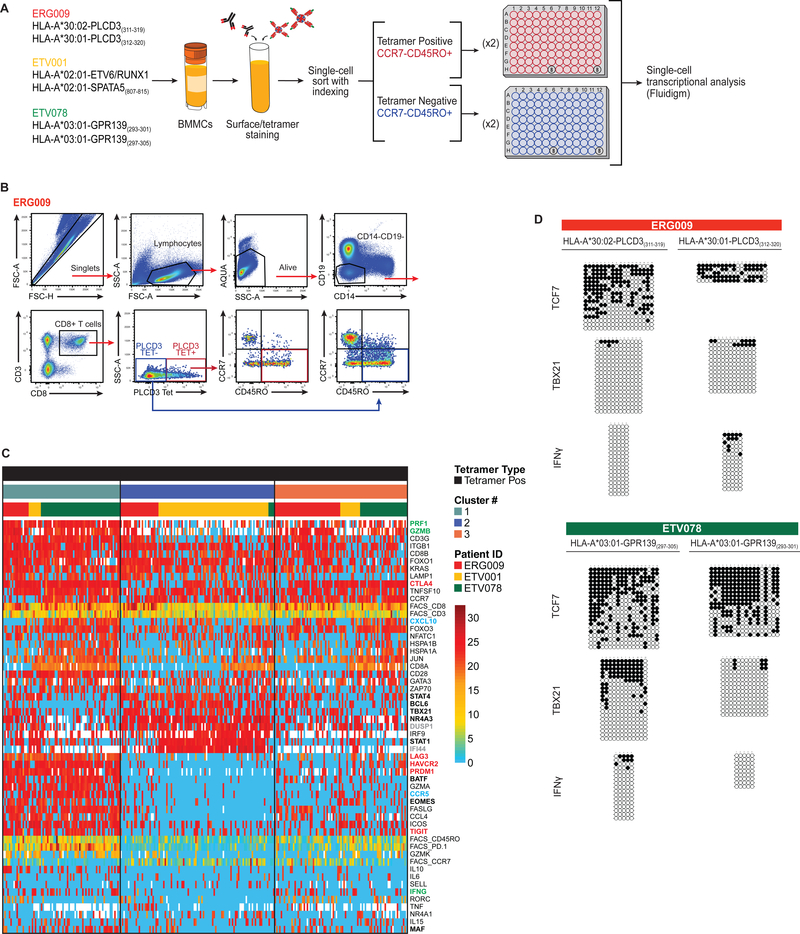
Cancer arises from the accumulation of genetic alterations, which can lead to the production of mutant proteins not expressed by normal cells. These mutant proteins can be processed and presented on the cell surface by major histocompatibility complex molecules as neoepitopes, allowing CD8+ T cells to mount responses against them. For solid tumors, only an average 2% of neoepitopes predicted by algorithms have detectable endogenous antitumor T cell responses. This suggests that low mutation burden tumors, which include many pediatric tumors, are poorly immunogenic. Here, we report that pediatric patients with acute lymphoblastic leukemia (ALL) have tumor-associated neoepitope-specific CD8+ T cells, responding to 86% of tested neoantigens and recognizing 68% of the tested neoepitopes. These responses include a public neoantigen from the ETV6-RUNX1 fusion that is targeted in seven of nine tested patients. We characterized phenotypic and transcriptional profiles of CD8+ tumor-infiltrating lymphocytes (TILs) at the single-cell level and found a heterogeneous population that included highly functional effectors. Moreover, we observed immunodominance hierarchies among the CD8+ TILs restricted to one or two putative neoepitopes. Our results indicate that robust antitumor immune responses are induced in pediatric ALL despite their low mutation burdens and emphasize the importance of immunodominance in shaping cellular immune responses. Furthermore, these data suggest that pediatric cancers may be amenable to immunotherapies aimed at enhancing immune recognition of tumor-specific neoantigens.


Conflict of interest statement

Competing interests: All other authors declare no competing interests.

Figures

Fig. 1.
Fig. 1.. Putative cancer neoantigens elicit robust T cell responses
(A) Enriched CD8+ tumor infiltrating lymphocytes (TILs) from 3 patients were independently co-cultured with artificial antigen presenting cells (aAPCs) expressing a single patient-specific human leukocyte antigen (HLA) molecule and pulsed with 1 μg/mL of anti-human CD28/CD49d and either 1 μM of the indicated 15mer peptide or 100 μg /mL staphylococcal enterotoxin B (SEB). Cytokine production by CD8+ TILs was subsequently measured by intracellular cytokine staining (ICS). Normalized frequency (neoantigen peptide compared to SEB) of responding single, live CD8+ lymphocytes that produced cytokines (IFNγ or TNFα) following stimulation is plotted for each acute lymphoblastic leukemia (ALL) patient. (B) Representative flow cytometry plots from one patient depicting single, live CD8+ lymphocytes that are CD107a+ (left panel), IFNγ+ (middle panel), or TNFα+ (right panel) following irrelevant peptide, neoantigen peptide, or polyclonal (SEB; positive control) stimulation. Flow plots for negative controls (unstimulated cells lacking peptide stimulation and isotype controls) are also shown and were used to set gates. (C) For six patients, 1–2 × 10⁶ bone marrow mononuclear cells (BMMCs) were stimulated with 1 μg /mL of anti-human CD28/CD49d and either 1μM of the indicated 15mer peptide, 100 μg /mL SEB, or 1X phorbol 12-myristate 13-acetate (PMA)/Ionomycin cell stimulation cocktail (as a positive control; see Methods) and then subjected to ICS. Normalized frequency (see Methods) of responding single, live CD8+ T cells that produced cytokines (IFNγ or TNFα; left panel) or degranulated (right panel) following stimulation is plotted for each ALL patient. (D) T cell response statistics for all putative neoantigens per patient (bar chart) and at the cohort level (pie charts). (E) For three patients, 2 × 10⁶ BMMCs were pulsed with serial dilutions (1μM to 10 pM) of the indicated 15mer peptide, 100 μg /mL SEB, or 1X PMA/Ionomycin cell stimulation cocktail and subjected to ICS. Normalized frequency of responding CD8+ T cells that produced cytokines (IFNγ or TNFα) following stimulation is plotted.
Fig. 2.
Fig. 2.. Endogenous neoantigens are processed, presented, and induce CD8+ T cells responses
(A) Schematic depicting the generation of tandem minigene (TMG) constructs (step 1) and in-vitro-transcribed (IVT) RNA (step 2) used to screen for recognition of putative somatic mutations. BMMCs were enriched for CD19+ cancer cells and CD8+ T cells (step 3). Cancer cells were then transfected with IVT RNA (step 4) and co-cultured with enriched CD8+ T cells (step 5). Co-cultured CD8+ T cells were subsequently subjected to ICS, and the frequency of cytokine producing cells was determined (step 6). Flow cytometry plots depict the representative purity following selection of CD19+ (left panel) and CD8+ T cells (right panel). (B) Representative flow cytometry plots from one patient depicting single, live CD8+ lymphocytes that are IFNγ+ or TNFα+ following co-culture with autologous CD19+ cancer cells transfected with mock-TMG RNA, wild-type TMG RNA, mutant TMG RNA, or enriched CD8+ T cells stimulated with PMA/Ionomycin. (C) Normalized frequency of IFNγ- and TNFα-producing CD8+ T cells following co-culture with autologous tumor cells transfected with wild-type TMG RNA (open circles) or mutant TMG RNA (filled circles) from three patients. (D) Schematic depicting the generation of TMG constructs (step 1) used to transfect aAPCs (step 2) to screen for recognition of putative somatic mutations. BMMCs were enriched for CD8+ T cells (step 3). aAPCs transfected with TMG plasmid DNA were co-cultured with enriched CD8+ T cells (step 4). Co-cultured CD8+ T cells were interrogated by ICS, and the frequency of cytokine producing cells was determined (step 5). (E) Normalized frequency of IFNγ- and TNFα-producing CD8+ T cells following co-culture with aAPCs transfected with wild-type TMG plasmid DNA (open circles) or mutant TMG plasmid DNA (filled circles) from three patients. (F) 2–3 × 10⁴ sorted CD8+ TILs from 2 patients were independently co-cultured with either 8 × 10⁴ autologous CD19+ tumor cells (dark gray shaded) or 8 × 10⁴ aAPCs expressing patient-specific HLAs (negative control; light gray shaded). CD8+ TIL expansion and tumor reactivity were determined by flow cytometry after 21 days of co-culturing by comparing the frequency of mutant tetramer-positive CD8+ TILs (ERG009: PE and APC conjugated HLA-A*30:02 PLCD3(311–319)MUT; ETV078: PE conjugated HLA-A*03:01 GPR139(293–301)MUT) from autologous tumor and aAPC co-cultures. Tetramer-positive gates were set based on the binding of CD8+ TILs to irrelevant (ERG009: PE and APC conjugated HLA-A*24:02 CD101(884–892)IRR) or parent tetramers (ETV078 PE conjugated HLA-A*03:01 GPR139(293–301)PAR.
Fig. 3.
Fig. 3.. Antitumor CD8+ T cell responses are neoepitope-specific and form immunodominance hierarchies
(A) Representative gating strategy from one patient used to identify and quantify neoepitope-specific CD8+ T cells in the bone marrow of patients with ALL. HLA tetramer staining of HLA-restricted CD8+ TILs is depicted for ERG009. (B) Frequency of CD3+CD8+ TILs from six patients binding irrelevant and/or parent tetramers (black bars), and mutant tetramers (colored bars) within the bone marrow of patient samples. Dashed lines distinguish tetramers complexed with irrelevant and/or parent peptides from tetramers complexed with nonamer and decamer mutant peptides. (C) T cell response statistics for all putative neoepitopes per patient (bar chart) and at the cohort level (pie charts). (D) Scatterplot depicting the relationship between the total CD8+ T cell and neoepitope-specific CD8+ T cell response from six patients in our cohort. Correlation coefficient (r) and p-value (p) were calculated using the Spearman rank-order correlation test. (E) Representative tetramer gating from three patients used to identify and quantify neoepitope-specific CD8+ T cells in an additional cohort of patients with the ETV6-RUNX1 gene fusion. (F) Frequency of CD3+CD8+ TILs binding irrelevant (black bars), and ETV6-RUNX1 fusion tetramers (colored bars) within the bone marrow of five additional patients containing the ETV6-RUNX1 gene fusion. Dashed lines distinguish tetramers complexed with irrelevant peptides from tetramers complexed with fusion peptides derived from ETV6-RUNX1. Representative flow cytometry plots depict the frequency of CD8+ TILs binding irrelevant, mutant tetramers (red outline; cancer neoantigen bound to patient-specific HLA), and/or wild-type (parent self-peptide bound to patient-specific HLA) tetramers.
Fig. 4.
Fig. 4.. Characterization and confirmation of the PLCD3-neoepitope TCRαβ repertoire in patient ERG009
Ex vivo stained CD8+ TILs from ERG009 were single-cell sorted based on PLCD3 tetramer binding (HLA-A*30:02 PLCD3(311–319) mutant tetramer) for TCR analysis. (A) Clonotypic analysis of paired T cell receptor CDR3 regions (CDR3α and CDR3β) using single-cell multiplexed PCR on sorted PLCD3+ CD8+ TILs from patient ERG009. Numbers adjacent to the pie chart slices represent the number of PLCD3 tetramer-binding cells within clonally expanded populations. (B) Flow cytometry analysis of PLCD3 tetramer-binding CD8+ T cells. Dot plot depicts populations of PLCD3 tetramer negative (shaded black) and sorted PLCD3 tetramer positive (gated, shaded gray) CD8+ TILs from ERG009. Events corresponding to the top 4 clonotypes (shaded blue, purple, red, and green) from the sorted cells were overlaid onto the tetramer positive population. (C) Flow cytometry plots depicting the frequency of SUP-T1 non-transduced cells (light gray), CCRF-CEM cells expressing an irrelevant TCR (dark gray), and SUP-T1 TCR transduced cells containing CDR3α and CDR3β corresponding to clones marked in 4A binding either an irrelevant (left panels), parent PLCD3 (middle panels), or mutant PLCD3 tetramer (right panels). (D) Flow cytometry histograms showing the frequency of TCR-expressing cells (as in 4C). (E) Ratio of PLCD3 tetramer-positive cells (from 4C) to TCR-expressing cells (from 4D).
Fig. 5.
Fig. 5.. The transcriptional profiles of neoepitope-specific CD8+ TILs exhibit inter- and intra-patient heterogeneity
(A) Workflow of the experimental strategy for single-cell transcriptional studies. Bone marrow cells from three patients (ERG009, ETV001, and ETV078) were stained using an antibody cocktail and neoepitope-specific tetramers. CCR7CD45RO+ tetramer-binding CD8+ TILs were single-cell index sorted for transcriptome studies. (B) Representative gating strategy from one patient depicting single-cell sorted CD8+ TIL subsets: tetramer-positive CCR7CD45RO+ (red outline), and tetramer-negative CCR7CD45RO+ (blue outline); 94 single cells from these two gates were sorted into 96-well plates. (C) Heatmap visualizing unscaled expression of genes (transcript expression threshold values; Et) and scaled surface protein data (MFI) for single-cell sorted neoepitope-specific CD8+ TILs (white indicates missing data) from three patients. Genes are ordered according to Ward’s method, and two clusters of relatively invariant genes were removed for ease of visualization. Top margin color bars represent, from top to bottom, groupings based on tetramer type (Tetramer positive), hierarchical cluster number (clusters 1–3), and patient IDs (ERG009, ETV001, and ETV078). Bolded gene name colors represent: transcription factors (black), inhibitory receptors (red), functional molecules (green), chemokine/chemokine receptors (blue), and transcriptional regulators (gray). (D) Representative bisulfite sequencing DNA methylation analysis of TCF7, TBX21, and IFNγ loci among bulk CCR7CD45RO+ neoepitope-specific CD8+ TILs from two patients.

Comment in

References

    1. Yarchoan M, Johnson BA 3rd, Lutz ER, Laheru DA, Jaffee EM, Targeting neoantigens to augment antitumour immunity, Nat. Rev. Cancer 17, 209–222 (2017). - PMC - PubMed
    1. Schumacher TN, Schreiber RD, Neoantigens in cancer immunotherapy, Science 348, 69–74 (2015). - PubMed
    1. Robbins PF, Kassim SH, Tran TLN, Crystal JS, Morgan RA, Feldman SA, Yang JC, Dudley ME, Wunderlich JR, Sherry RM, Kammula US, Hughes MS, Restifo NP, Raffeld M, Lee C-CR, Li YF, El-Gamil M, Rosenberg SA, A Pilot Trial Using Lymphocytes Genetically Engineered with an NY-ESO-1–Reactive T-cell Receptor: Long-term Follow-up and Correlates with Response, Clin. Cancer Res. 21, 1019–1027 (2015). - PMC - PubMed
    1. Strønen E, Toebes M, Kelderman S, van Buuren MM, Yang W, van Rooij N, Donia M, Böschen M-L, Lund-Johansen F, Olweus J, Schumacher TN, Targeting of cancer neoantigens with donor-derived T cell receptor repertoires, Science 352, 1337–1341 (2016). - PubMed
    1. van Buuren MM, Calis JJ, Schumacher TN, High sensitivity of cancer exome-based CD8 T cell neo-antigen identification, Oncoimmunology 3, e28836 (2014). - PMC - PubMed

Publication types

MeSH terms