. 2019 Jun 26;10(1):2798.
doi: 10.1038/s41467-019-10627-w.

Insights into real-time chemical processes in a calcium sensor protein-directed dynamic library

Affiliations

Insights into real-time chemical processes in a calcium sensor protein-directed dynamic library

Andrea Canal-Martín et al. Nat Commun. .

Abstract

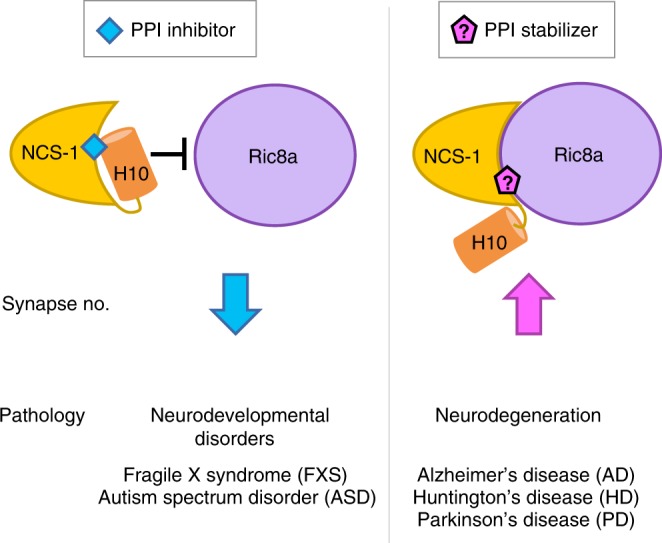
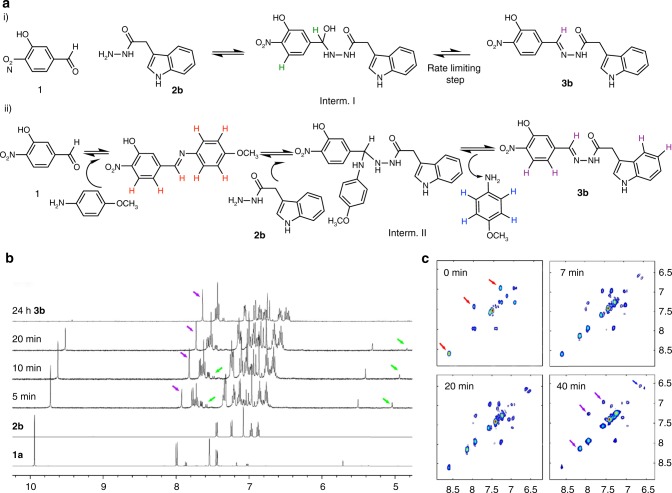
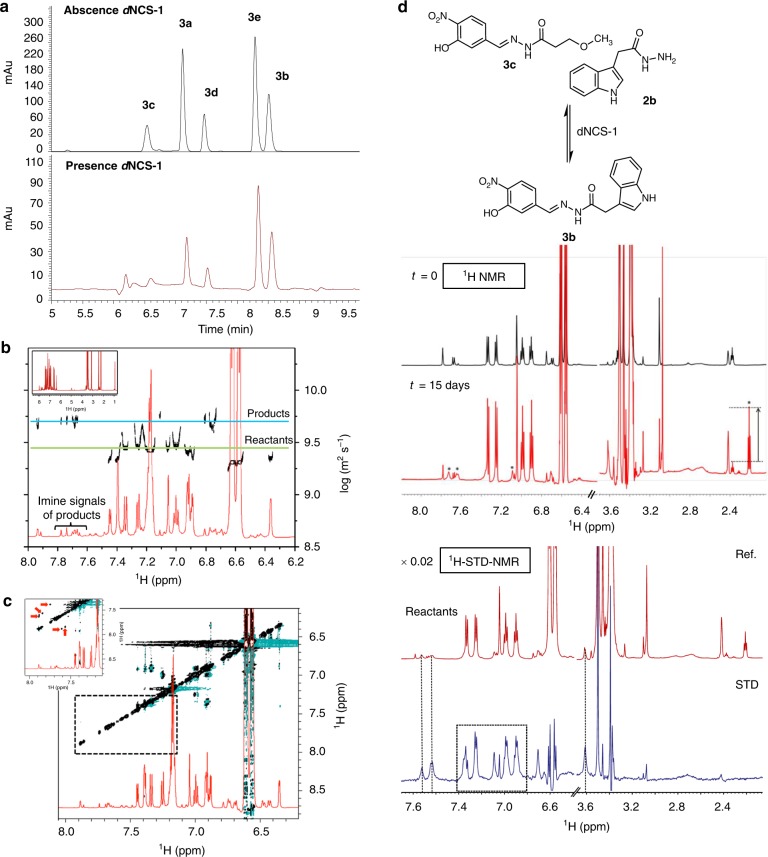
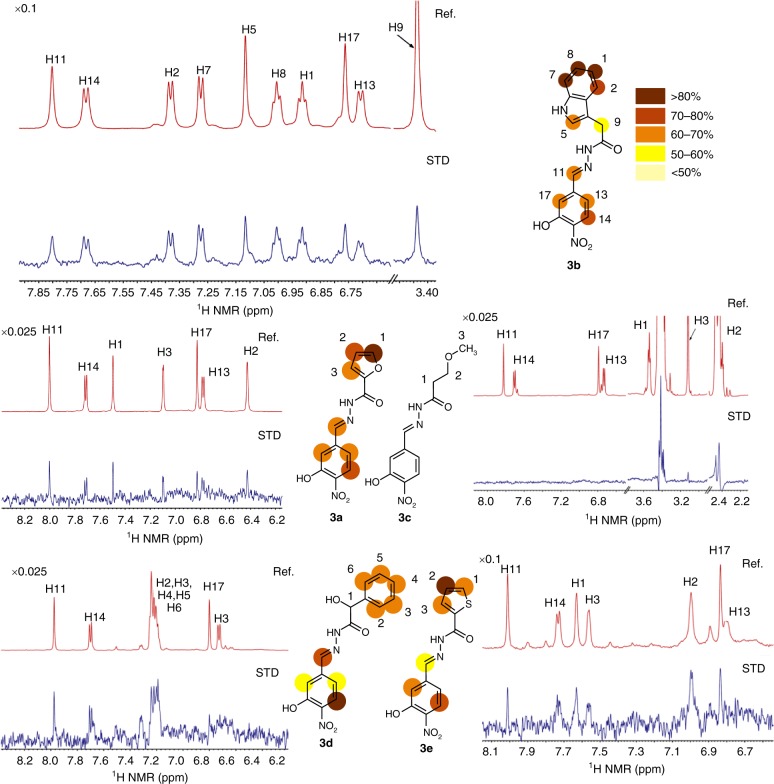
Dynamic combinatorial chemistry (DCC) has proven its potential in drug discovery speeding the identification of modulators of biological targets. However, the exchange chemistries typically take place under specific reaction conditions, with limited tools capable of operating under physiological parameters. Here we report a catalyzed protein-directed DCC working at low temperatures that allows the calcium sensor NCS-1 to find the best ligands in situ. Ultrafast NMR identifies the reaction intermediates of the acylhydrazone exchange, tracing the molecular assemblies and getting a real-time insight into the essence of DCC processes at physiological pH. Additionally, NMR, X-ray crystallography and computational methods are employed to elucidate structural and mechanistic aspects of the molecular recognition event. The DCC approach leads us to the identification of a compound stabilizing the NCS-1/Ric8a complex and whose therapeutic potential is proven in a Drosophila model of disease with synaptic alterations.


Conflict of interest statement

The Spanish National Research Council and the Biomedicine Research Foundation of Ramon y Cajal Hospital have filed the patent applications (P201830933 and EP19382242.6) with the Spanish Patent Office on the use of the compounds described in the paper as synaptic modulators. R.P.-F., A.C.-M., A.Mansilla and M.J.S.-B. are listed as inventors. The remaining authors declare no competing interests.

Figures

Fig. 1
Fig. 1
The complex between NCS-1 and Ric8a as a target for synaptopathies. Schematic representation of the regulation mechanism of the PPI target with small molecules. Examples of pathologies associated with an abnormal synapse number and the modulatory effect (decrease or increase in synapse number) exerted or expected by the small molecule modulators are also given. The key NCS-1 C-terminal helix is represented as an orange cylinder
Fig. 2
Fig. 2
Aniline derivatives tested as DCL hydrazone exchange catalysts. a DCL building blocks and library conditions at physiological pH and low temperature, b Aniline derivatives used as catalysts. c Time course formation of compound 3b using an aldehyde concentration of 0.09 μM in 20 mM Tris  buffer (pH 7.4), acylhydrazide 2b (0.27 μM), T = 4 °C, 5% DMSO in the absence of the catalyst (red dots), and in the presence of 15 mM of aniline (green dots), p-anisidine (blue dots) and p-phenylendiamine (black dots). d Kinetic parameters (Kobs and t1/2) of acylhydrazone 3b formation calculated for a pseudo-second-order rate equation in the absence or in the presence of different catalysts (Supplementary Fig. 1 and Supplementary Methods). Mean ± SD from three independent experiments. The right column shows the rate enhancement of catalysts relative to the uncatalyzed samples. p-aminophenol was discarded as it got quickly transformed into the quinone derivative. Source data are provided as a Source Data file
Fig. 3
Fig. 3
Acylhydrazone exchange reaction mechanism. a Formation of acylhydrazone 3b in the absence (i) and presence (ii) of p-anisidine. b Real-time 1D 1H NMR series recorded as a function of time (only a small subset of the resulting spectra hereby shown) of the reaction of 1 (50 mM) and 2b (50 mM) in Tris buffer D2O/DMSO-d6 (1:4) at 298 K (500 MHz). Colored arrows show the positions of specific signals from products and intermediates. The horizontal offset in ppm is 0.1. Note that there is a small fraction of the hydrated aldehyde in the spectra. c Plots of four selected UF-2D-TOCSY NMR spectra taken from the 500 experiments acquired (1:2b:p-anisidine at 1:1:0.5 in Tris  buffer D2O/DMSO-d6 (1:4) at 298 K (500 MHz). Cross-peaks from the Schiff-base intermediate and the final step of formation of 3b are depicted in red and purple respectively
Fig. 4
Fig. 4
HPLC-MS and NMR studies of the full dynamic combinatorial library. a DCL chromatograms after 5 h in the absence and in the presence of dNCS-1. Conditions: aldehyde 1 (1.2 µL, 50 mM), 2a2e (3.6 µL, 50 mM), catalyst (1 µL, 12 M), dNCS-1:1 [1:1], Tris  buffer (20 mM, pH 7.4), 1 mM CaCl2, 0.5 M NaCl, 1 mM DTT, T = 4 °C, 2% DMSO. DCC experiments were carried out in triplicate. b 1D-1H NMR spectrum (red) of the mixture and DOSY experiment (black) of the DCL in the presence of dNCS-1 (281 K, 600 MHz). c Tr-NOESY spectrum of the DCL mixture in the presence of dNCS-1 (mixing time 200 ms, 281 K, 600 MHz). Amplification of the region δ 7.2–8.0 ppm. The negative transferred NOE cross-peaks corresponding to intramolecular NOEs of the products while bound to the protein are highlighted with red solid arrows. d 1H-NMR spectrum of the sample with acylhydrazide 2b and acylhydrazone 3c in the presence of dNCS-1 at different reaction times and up to 15 days (281 K, 600 MHz). The new signals that reveal the formation of 3b (aromatic region) and 2c (aliphatic region) are marked with stars. 1H-STD-NMR (blue) and off-resonance (red) NMR spectra of the mixture 2b + 3c + dNCS-1 (281 K, 600 MHz) after 15 days
Fig. 5
Fig. 5
1H-STD-NMR spectra of 3a3e in the presence of dNCS-1. STD (blue) and off-resonance (red) NMR spectra acquired for compounds 3a3e (1 mM) in the presence of 10 μM dNCS-1 (600 MHz, 281 K). Relative STD intensities are coded according to the color scale shown. The 100% STD signal corresponds to the resonance showing the highest intensity in each case and all other STD signals are calculated accordingly
Fig. 6
Fig. 6
Protein–ligand binding and toxicity studies. a Representation of the fluorescence emission of Ca2+ loaded dNCS1 at increasing concentration of ligand (3a3d or CPZ). Mean ± SD from three independent experiments. The curves represent the least squares fitting of the experimental data to a 1:1 stoichiometry. To properly compare the different curves, intensities were normalized and represented. CPZ-dNCS-1 (red dots); 3a-dNCS1 (blue dots); 3b-dNCS-1 (green dots); 3d-dNCS-1 (orange dots). b Co-IP binding assay of human NCS-1 and V5-tagged Ric8a in transfected HEK cells in the presence of CPZ, 3b, 3a, 3d (20 μM) and the vehicle DMSO. Input represents 1/10 cell lysates before IP. Quantifications of each lane from four experiments are shown below the blots. Bars represent percentage of NCS-1/ Ric8a binding (mean ± SD) normalized to DMSO. Note the reduced binding in the presence of CPZ or 3a and the strong binding with 3b or 3d, comparisons are with DMSO which represents basal binding levels (100%). c PAMPA in vitro permeability (Pe) plot of compounds 3a, 3b and 3d and the reference drugs. CNS + (green) for Pe > 4.47 × 10−6 cm s−1, CNS- (red) for compounds with Pe < 4.47 × 10–6 cm s−1. Mean ± SD from three independent experiments. d Cell toxicity assay of CPZ, 3b and the vehicle DMSO as control. Mean ± SD from three independent experiments. Cortical neurons from E14 wild-type mice were treated for 24 h with 0.2, 2, 10, 20 μM of CPZ (red), compound 3b (green) or the same volume of the vehicle DMSO. Then, the percentage of picnotic bodies over the total nuclei was analyzed. Mean ± SD from three independent experiments. Paired two-tailed Student’s test ***P˂0.001; **P < 0.01; *P < 0.05. Source data are provided as a Source Data file. IP immunoprecipitation, WB western blot
Fig. 7
Fig. 7
Structure of the Ca2+ bound hNCS-1/3b complex. a Ribbon representation of hNCS-1 bound to Ca2+ (orange spheres) and 3b (cyan sticks). The calculated feature-enhanced map at the 3b region is depicted in pink at 1.4σ level, and two zoomed-in views are shown (green square). b Electrostatic potential molecular surface representation of the two independent hNCS-1 molecules found in the AU showing the PEG content of the hydrophobic crevices (light grey sticks) and 3b. c Detailed view of the residues (side chains as yellow sticks) and molecules recognizing 3b. Strong and weak H-bonds are shown as black and grey dashed lines, respectively. 3b atom numbering is represented. d The superimposition of the ligand-bound (yellow) and the ligand-free (pink) hNCS-1 molecules found in the AU. Arrows indicate the residues that suffer important rearrangements
Fig. 8
Fig. 8
Structural analysis of the NCS-1/Ric8a small molecule regulators. a, b Structural comparison of 3b with strong inhibitors. Superimposition of the structure of hNCS-1/3b complex (yellow ribbons/sticks) with that of dNCS-1/IGS-1.76 (pink ribbons/sticks) (PDB code 6epa). The structure of dNCS-1/FD44 has also been superimposed, but only the small compound is represented (white sticks). The grey square represents a rotated zoomed-in view to visualize the ligands (3b, IGS-1.76 and FD44) and helix H10. b The residues contacting IGS-1.76 are shown. Strong H-bonds of IGS-1.76 with Y52 and T92 are displayed with black dashed lines. c Structural comparison of 3b with a mild inhibitor. Superimposition of hNCS-1/3b complex (yellow) with dNCS-1/CPZ (white) (PDB code 5g08) structures. Under the crystallization conditions, two different CPZ conformations were modeled. One of the conformations binds to the same site as compound 3b. However, CPZ hydrophobic tail is not efficient enough in contacting helix H10 C-terminal end, which was found disordered in the crystal (from residue 184 to the end), and therefore the inhibition is mild. d 2D structures of the regulatory molecules represented in (a, c). The aromatic region conserved in all PPI regulators is squared in light green. The region of FD44 and IGS-1.76 implicated in an efficient interaction with helix H10 are highlighted in green. The 3b polar groups, sharing the same position, are highlighted in blue
Fig. 9
Fig. 9
In vivo effects of compound 3b. Flies with motoneuron overexpression of the human aβ42arc (arctic mutation) (D42Gal4 > aβ42arc) or mock expression (D42Gal4 > LacZ) were fed with 3b (100 μM) or same volume of vehicle DMSO. a Twenty-day old adult abdominal motoneurons were analyzed and synapse number (nc82-positive spots) of the same motoneuron in different flies (16–19) were determined using Imaris, over the confocal 1 µm stacks. Data are plotted in graphs, where each grey triangle (aβ42arc flies fed with vehicle) and green triangle (aβ42arc flies fed with 3b) or each grey circle (control flies fed with vehicle) and green circle (control flies fed with 3b) represents one value. Horizontal line represents mean ± SEM. Data are analyzed statistically with unpaired two-tailored Student’s t test; ***P < 0.001. b Locomotor activity of individual 15 days old flies was recorded for 4 days in Drosophila Activity Monitors (DAM2, Trikinetics), the total number of beam breaks per hour during two consecutive days was analyzed (the activity of the first two days is considered the habituation period and is discarded). Mean ± SEM of three independent experiments with 5–12 flies per condition each, were plotted and analyzed statistically with paired two-tailed Student’s t-test, *P < 0.05. Source data are provided as a Source Data file, ns non significant

References

    1. Brady PA, Sanders JKM. Thermodynamically-controlled cyclisation and interconversion of oligocholates: metal ion templated ‘living’ macrolactonisation. J. Chem. Soc., Perkin Trans. 1997;1:3237–3253. doi: 10.1039/a703390g. - DOI
    1. Hasenknopf B, et al. Self-assembly of tetra- and hexanuclear circular helicates. J. Am. Chem. Soc. 1997;119:10956–10962. doi: 10.1021/ja971204r. - DOI
    1. Li J, Nowak P, Otto S. Dynamic combinatorial libraries: from exploring molecular recognition to systems chemistry. J. Am. Chem. Soc. 2013;135:9222–9239. doi: 10.1021/ja402586c. - DOI - PubMed
    1. Lehn J-M. Dynamic combinatorial chemistry and virtual combinatorial libraries. Chem. Eur. J. 1999;5:2455–2463. doi: 10.1002/(SICI)1521-3765(19990903)5:9<2455::AID-CHEM2455>3.0.CO;2-H. - DOI
    1. Cougnon FB, Sanders JKM. Evolution of dynamic combinatorial chemistry. Acc. Chem. Res. 2012;45:2211–2221. doi: 10.1021/ar200240m. - DOI - PubMed

Publication types