. 2019 Jun 26;10(1):2792.
doi: 10.1038/s41467-019-10642-x.

Common and distinct transcriptional signatures of mammalian embryonic lethality

Affiliations

Common and distinct transcriptional signatures of mammalian embryonic lethality

John E Collins et al. Nat Commun. .

Abstract

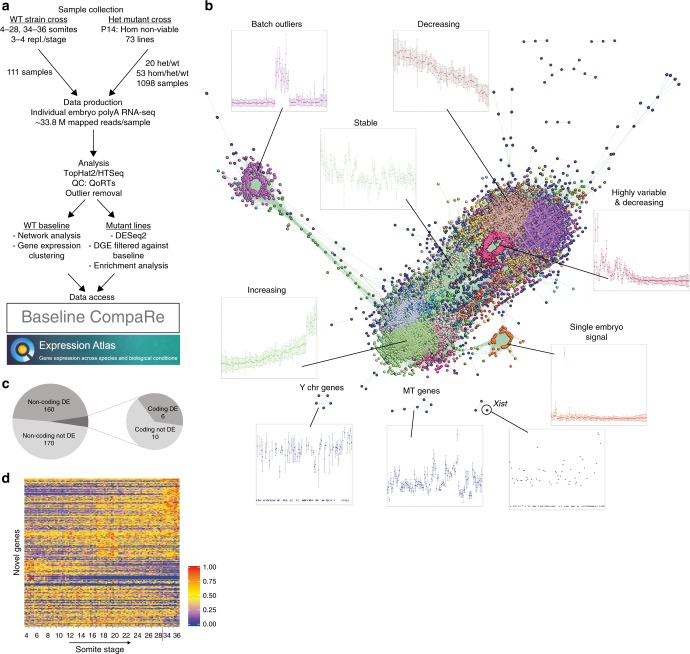
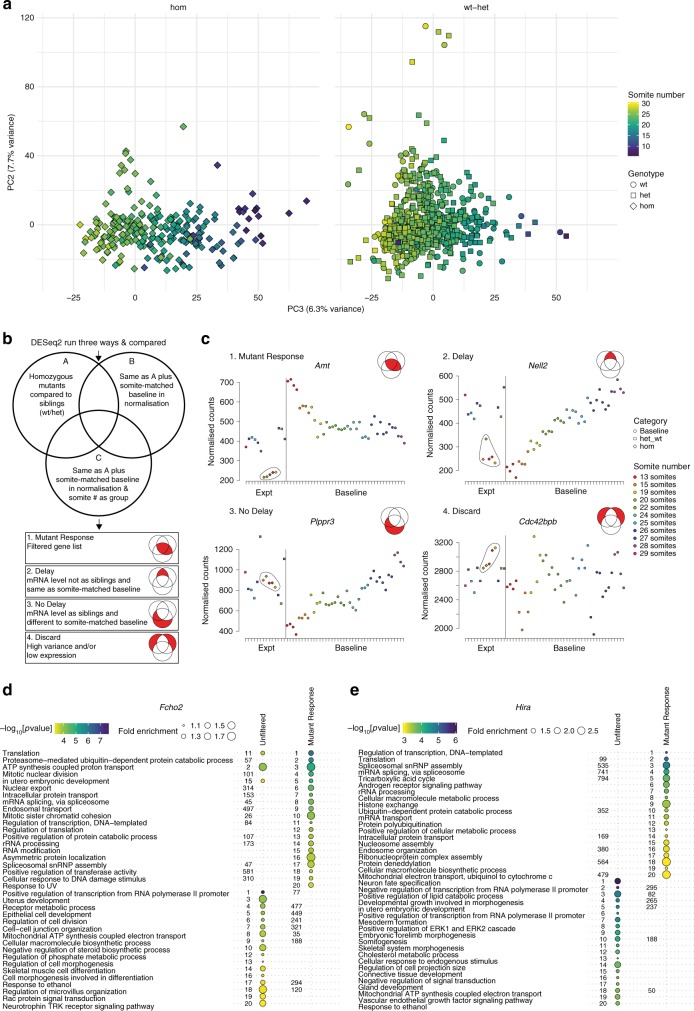
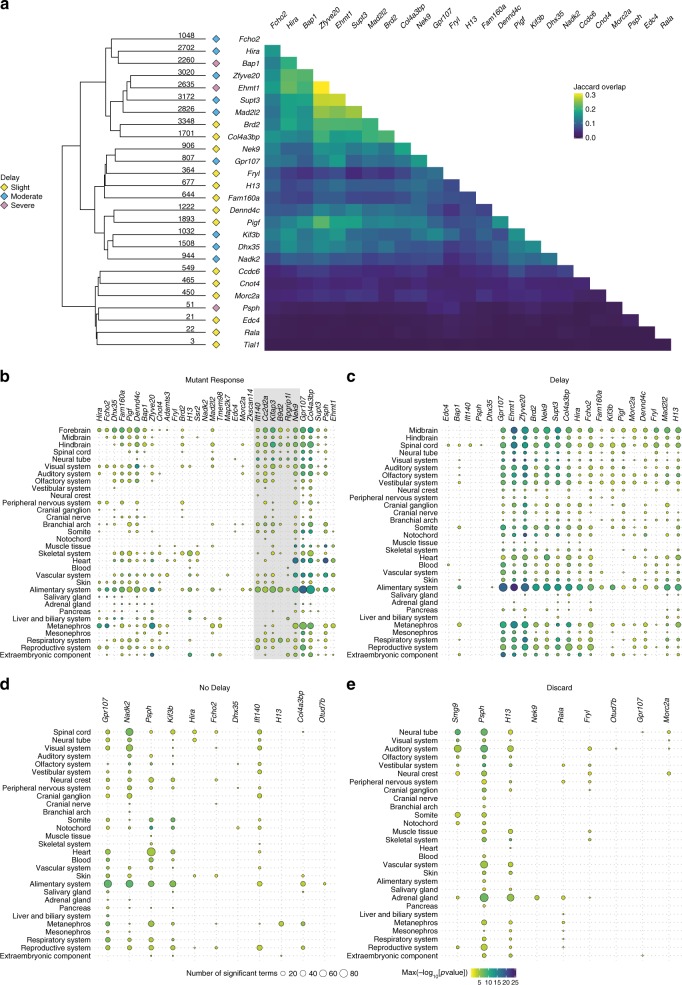
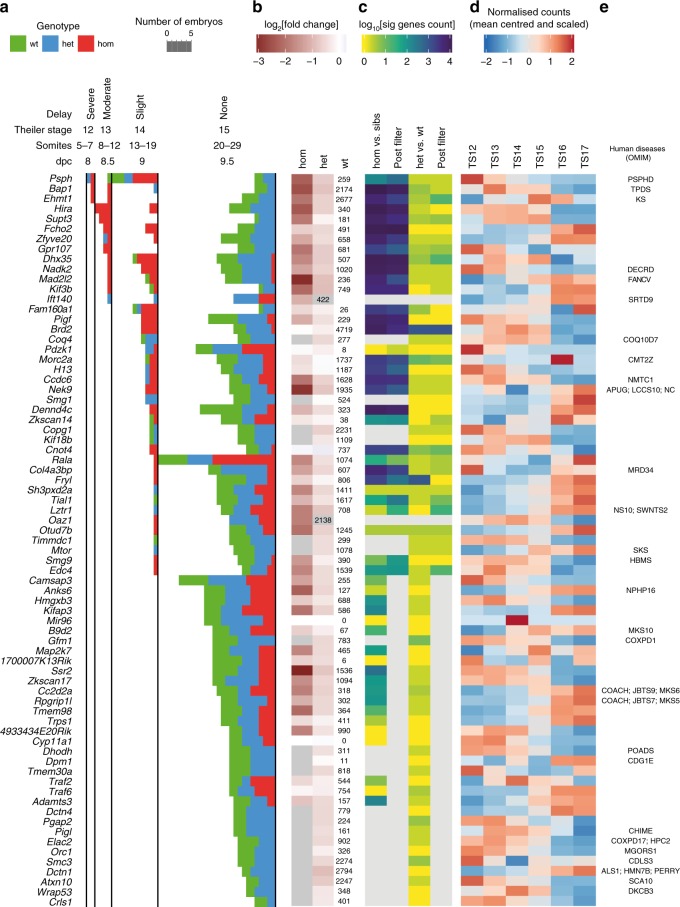
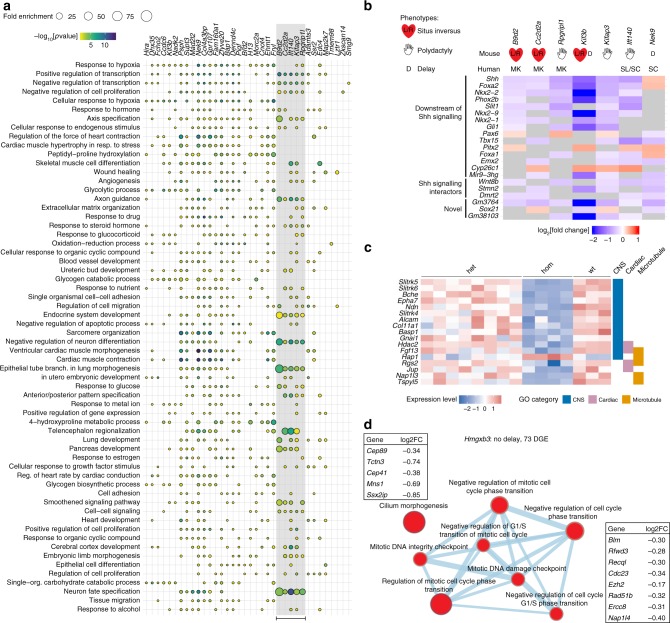
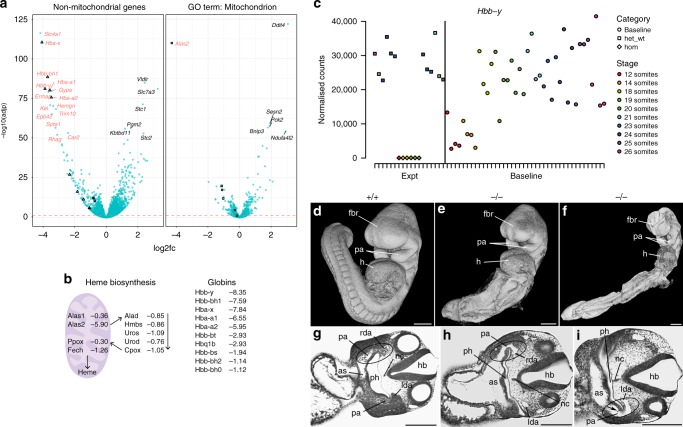
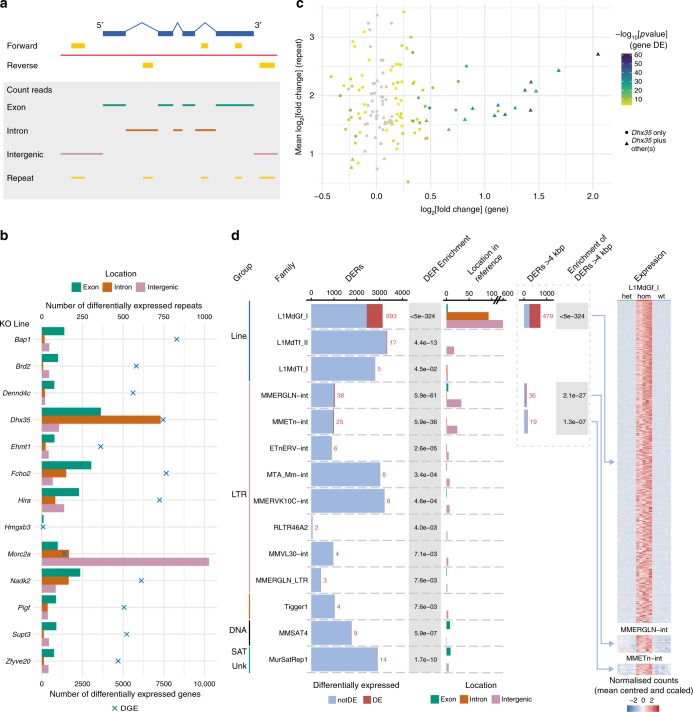
The Deciphering the Mechanisms of Developmental Disorders programme has analysed the morphological and molecular phenotypes of embryonic and perinatal lethal mouse mutant lines in order to investigate the causes of embryonic lethality. Here we show that individual whole-embryo RNA-seq of 73 mouse mutant lines (>1000 transcriptomes) identifies transcriptional events underlying embryonic lethality and associates previously uncharacterised genes with specific pathways and tissues. For example, our data suggest that Hmgxb3 is involved in DNA-damage repair and cell-cycle regulation. Further, we separate embryonic delay signatures from mutant line-specific transcriptional changes by developing a baseline mRNA expression catalogue of wild-type mice during early embryogenesis (4-36 somites). Analysis of transcription outside coding sequence identifies deregulation of repetitive elements in Morc2a mutants and a gene involved in gene-specific splicing. Collectively, this work provides a large scale resource to further our understanding of early embryonic developmental disorders.


Conflict of interest statement

The authors declare no competing interests.

Figures

Fig. 1
Fig. 1
Experimental strategy and data processing. a Experimental workflow for E9.5 baseline and mutant line analysis. For the baseline, wild-type mice from heterozygous incrosses generated as part of the DMDD project were outcrossed (WT strain cross) and embryos from these crosses were collected. This was to produce embryos with a similar genetic background to the mutants. For the mutant lines, embryos were obtained from heterozygous intercrosses (Het mutant cross). The processed data can be viewed using Baseline CompaRe. The baseline data are available in Expression Atlas. b Clustered gene expression network identifies co-expressed genes across the baseline samples. The gene expression data are displayed using BioLayout Express3D as a network of genes (nodes) with edges connecting nodes whose expression values over all the samples have a Pearson correlation coefficient of ≥0.85. Nodes represent 9265 genes and are coloured according to Markov clustering (MCL). Surrounding graphs show expression of genes in a selection of clusters with individual embryos ordered by somite number on the x-axis, and gene expression in the cluster (unit variance scaled with standard deviation) on the y-axis. Batch outliers (top left) are genes that were blacklisted from further analysis. Decreasing/increasing genes are the ones most indicative of stage as they change the most across the time course, whereas the cluster labelled Stable is more consistent. Highly variable and decreasing is a set of genes that have high variance even among embryos at the same stage. Single embryo signal is a cluster of genes that are expressed at high levels in just one embryo. Xist, Y chr genes and MT genes (genes encoded by the mitochondrial chromosome) were removed due to high variability. c Venn diagram of the categories of novel (previously unannotated) genes identified using all RNA-seq data across all embryos. d Heatmap of expression profiles of the novel genes. Each row is a gene and each column a sample in somite number order. In each row, expression data are scaled to the maximum value (set to 1) for that row. The genes are ordered by hierarchical clustering. Source data are provided as a Source Data file
Fig. 2
Fig. 2
Separating the delay signal. a Principal component analysis (PCA) of all experimental samples in the study using the data for all genes. Principal component (PC) 2 and PC3 are plotted, points are coloured by recorded number of somites. The variance explained by each component is in brackets. The left-hand plot shows homozygous embryos (diamonds) and the right-hand heterozygous (squares) and wild-type (circles) embryos. Somite number is correlated with PC3. b Analysis strategy. Each delayed line was analysed with DESeq2 in three different ways (see Supplementary Fig. 2) and the differentially expressed (DE) gene lists overlapped. Four categories of genes were produced based on their position in the Venn diagram; 1. Mutant Response, 2. Delay (mRNA abnormal), 3. No Delay (mRNA as wt) and 4. Discard. c Examples of genes from each category. Plots show expression levels (normalised counts) of the gene in embryos (siblings = squares, homozygous = diamonds) from the Brd2 mutant line (Expt = experimental samples) as well as baseline samples (circles) of matching somite stages. Homozygous mutants are circled. Genes shown are Mutant Response: Amt (ENSMUSG00000032607), Delay: Nell2 (ENSMUSG00000022454), No Delay: Plppr3 (ENSMUSG00000035835) and Discard: Cdc42bpb (ENSMUSG00000021279). d, e Effect of filtering on Gene Ontology (GO) enrichment. Plots of the top 20 (by p value) enriched GO terms (Biological Process) in both unfiltered and Mutant Response DE gene lists. The size of the points represents fold enrichment of the term (Observed/Expected) and they are coloured by −log10[p value] (no point means the term is not in the top 20 for that gene list). The numbers are the position of the term in each list ranked by p value (no number means the term is not enriched for that gene list). d Enrichments for the Fcho2 (ENSMUSG00000041685) mutant line. e Enrichments for the Hira (ENSMUSG00000022702) mutant. Source data are provided as a Source Data file
Fig. 3
Fig. 3
Anatomical term enrichment analysis. a Pairwise overlaps between Delay gene lists. The heatmap on the right shows the Jaccard similarity index (number in both lists/number in either list) for pairs of delayed mutant lines. The heatmap has been hierarchically clustered and the tree is displayed on the left along with the number of genes in each Delay gene list. The category of delay for each line is indicated by coloured diamonds (yellow = Slight, blue = Moderate, purple = Severe). be Bubble plots of the enriched Edinburgh Mouse Atlas Project Anatomy (EMAPA) terms produced from the four categories of differentially expressed genes. The mutant lines are displayed on the x-axis and the terms are on the y-axis. The ordering of mutants on the x-axis was determined by hierarchical clustering of the overlap (Jaccard Index) of terms between lines. The enriched terms on the y-axis were simplified by aggregating to terms at the top of the EMAPA ontology graph. The size of the bubbles represents the number of terms that have been simplified to the higher-level term and they are coloured by maximum −log10[p value]. Mutant lines with no enrichments have been excluded from the plots. b Mutant Response. Small groups of lines have similar tissues enriched. The grey box highlights the ciliopathy lines that cluster together based on similarity of enriched EMAPA terms. c Delay. The enriched tissues are more uniform across the lines. d No Delay. e Discard. For No Delay and Discard fewer lines have enriched terms and there is little pattern to the enriched tissues
Fig. 4
Fig. 4
Summary of mutant lines. a Diagram of the stages of embryos collected coloured by genotype (green = wild type, blue = heterozygous, red = homozygous). The horizontal length of the bars represents the number of embryos at each Theiler stage for each genotype. The mutant lines are arranged from top to bottom by decreasing amount of delay. Lines are categorised by the most delayed embryos collected (TS12 = Severe, TS13 = Moderate, TS14 = Slight, TS15 = None). For two of the lines (Ift140 and Oaz1), homozygous and heterozygous embryos were collected, but no wild-type siblings were present. b Heatmap of expression relative to wild-type (log2[fold change]) of the targeted gene itself (hom = homozygous vs. wild type, het = heterozygous vs. wild type). The numbers in the wt column are mean normalised counts in the wild-type embryos for comparison (except for Ift140 and Oaz1 where the mean counts are for the het embryos). c Heatmap of the number of genes called as significantly differentially expressed (DE; log10 scaled). hom vs. sibs = homozygous embryos compared to siblings (heterozygous and wild-type), het vs. wt = heterozygous compared to wild-type embryos. Columns labelled post-filter show the numbers of DE genes after the delay analysis was applied for delayed lines. Grey boxes are where no comparison was done, for example, where no homozygous embryos were recovered or the delay analysis was not applied because the line was not delayed. d Expression of the targeted gene in the wild-type baseline averaged by Theiler stage and displayed as mean centred and scaled normalised counts. e Human syndromes (Online Mendelian Inheritance in Man) associated with the targeted gene. Source data are provided as a Source Data file
Fig. 5
Fig. 5
Mutant response overview and examples. a Bubble plot of the enriched Gene Ontology (GO) terms shared across most mutant lines, with lines on the x-axis and GO terms on the y-axis. The ordering of mutants on the x-axis was determined by hierarchical clustering of the overlap (Jaccard Index) of terms between lines. The size of the bubbles represents fold enrichment (Observed Genes/Expected) and they are coloured by −log10[p value]. The group of ciliopathy mutants are highlighted with a grey box and a bar at the bottom. b Heatmap of the log2[fold change] of genes that are differentially expressed (DE) in at least four of the seven mutants identified as having similar ciliopathy profiles. Mutant lines are shown on the x-axis and DE genes on the y-axis. Phenotypes associated with mutations in human and mouse are shown above the heatmap. The DE genes have been categorised into three groups, Downstream of Shh signalling, Shh signalling interactors and Novel. c Heatmap of 17 DE genes from the Zkscan17 mutant line associated with central nervous system (CNS), cardiac or microtubule GO terms. The heatmap displays expression values as mean centred and scaled normalised counts in all samples and the GO categories associated with each gene are shown to the right of the heatmap. d Network diagram produced by Enrichment Map (Cytoscape App) of the GO term enrichment in the Hmgxb3 mutant line. The nodes represent enriched GO terms and the edge widths are proportional to the overlap of genes annotated to each term. Not all enriched GO terms are included. Source data are provided as a Source Data file
Fig. 6
Fig. 6
Phenotype of the Nadk2 line. a Volcano plots of genes in the Nadk2 mutant line. log2[fold change] is plotted on the x-axis and −log10[p value] on the y-axis. Genes associated with Gene Ontology term GO:0005739 (mitochondrion) are shown on the right and those not associated are on the left. Squares indicate genes from the heme biosynthesis pathway and triangles are haemoglobin genes. Gene names in red are associated with erythrocyte development. b Genes involved in the heme pathway on the left and haemoglobins on the right, plus their log2[fold change] in the Mutant Response. Genes whose products are localised to mitochondria are shown inside the purple oval. c Example count plot for Hbb-y, containing samples from the mutant line as well as somite stage-matched baseline samples. Homozygous embryos are shown as diamonds, siblings (heterozygous and wild-types) are squares and baseline samples are represented by circles. Points are coloured according to stage. di High-resolution episcopic microscopy data for the Nadk2 line. d–f 3D models of the embryo surface. d Wild-type embryo (+/+). e, f Homozygous mutant embryos (−/−); e is mainly delayed in its caudal body parts, whereas f is globally delayed. fbr forebrain, h heart, pa pharyngeal arch. gi Corresponding axial sections from the embryos in (df) at the level of the heart. as aortic sac, pa pharyngeal arch artery, lda left dorsal aorta, rda right dorsal aorta, ph pharynx, hb hindbrain (respectively fourth ventricle), nc notochord. The control embryo (g) has a large number of clearly visible blood cells in the aortic sac and arteries, whereas the homozygotes have no, h (4 of 6), or very few, i (2 of 6), erythrocytes (arrow). Compare circled areas in (g, h and i). Scale bars are 250 µm. Source data are provided as a Source Data file
Fig. 7
Fig. 7
Investigation of repeat deregulation. a Schematic representing a region of the genome (red line), a gene on the forward strand (exons are blue boxes and introns are blue lines) and strand-specific repeats (yellow boxes). The area within the grey box shows the genomic stretch where strand-specific reads were considered within exons (green), within introns (brown), intergenic (purple) or within annotated repeats (yellow). b Differential repeat and gene expression for 13 mutant lines (Hmgxb3 acts as a negative control). For each mutant line the number of differentially expressed repeat instances (DERs) is shown on the top x-axis split by genomic location (bars). The number of genes differentially expressed (homozygotes versus siblings) for each mutant line are indicated by a cross and shown on the bottom x-axis. Dhx35 has a large number of DERs in intronic regions (brown bar), whereas for Morc2a they are mostly in intergenic regions (purple bar). c Fold change of repeats and genes in Dhx35 mutant line. Genes enriched for the number of intronic DERs, if greater than 1 instance, compared to all introns for each gene are shown by circles (unique to Dhx35) or triangles (found in Dhx35 and at least one other mutant), ENSMUSG00000107482 has no exon counts and was excluded from the plot. The colour shows the adjusted p value (−log10 scaled) from DESeq2 for the gene with grey as not significant. The log2[fold change] for the gene is on the x-axis with the mean fold change of intronic DERs on the y-axis. d Repeat instance expression in the Morc2a mutant line. Only repeat families enriched for individual DERs against total instances in the genome are shown. Bar shows total repeat instances with DERs in red. Bars in the Location in Reference column display the number of DERs by genomic location relative to gene annotation. Dashed box shows subset of repeat instances ≥4 kb. Mean centred and scaled heatmaps in the Expression column are of expression levels of DERs (L1MdGf_I, MMERGLN-int and MMETn-int families) across heterozygous (het), homozygous (hom) and wild-type (wt) Morc2a embryos. Source data are provided as a Source Data file

References

    1. Consortium CeDM. Large-scale screening for targeted knockouts in the Caenorhabditis elegans genome. G3 (Bethesda) 2012;2:1415–1425. doi: 10.1534/g3.112.003830. - DOI - PMC - PubMed
    1. Moerman DG, Barstead RJ. Towards a mutation in every gene in Caenorhabditis elegans. Brief. Funct. Genom. Prote. 2008;7:195–204. doi: 10.1093/bfgp/eln016. - DOI - PubMed
    1. Thompson O, et al. The million mutation project: a new approach to genetics in Caenorhabditis elegans. Genome Res. 2013;23:1749–1762. doi: 10.1101/gr.157651.113. - DOI - PMC - PubMed
    1. Bellen HJ, et al. The Drosophila gene disruption project: progress using transposons with distinctive site specificities. Genetics. 2011;188:731–743. doi: 10.1534/genetics.111.126995. - DOI - PMC - PubMed
    1. Ryder E, et al. The DrosDel deletion collection: a Drosophila genomewide chromosomal deficiency resource. Genetics. 2007;177:615–629. doi: 10.1534/genetics.107.076216. - DOI - PMC - PubMed

Publication types