. 2019 Jun 26;10(1):2790.
doi: 10.1038/s41467-019-10418-3.

A shape-memory and spiral light-emitting device for precise multisite stimulation of nerve bundles

Affiliations

A shape-memory and spiral light-emitting device for precise multisite stimulation of nerve bundles

Hao Zheng et al. Nat Commun. .

Abstract

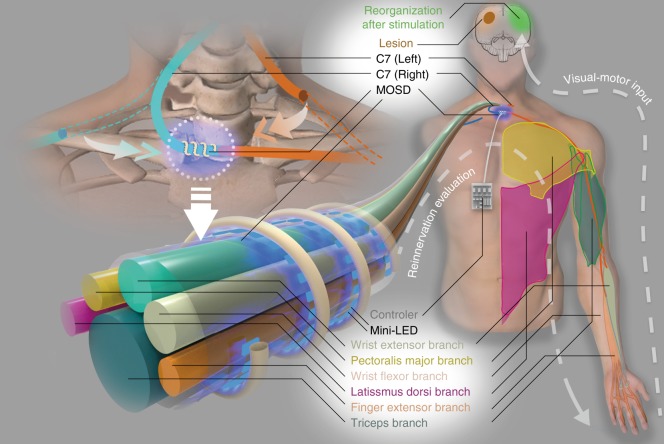
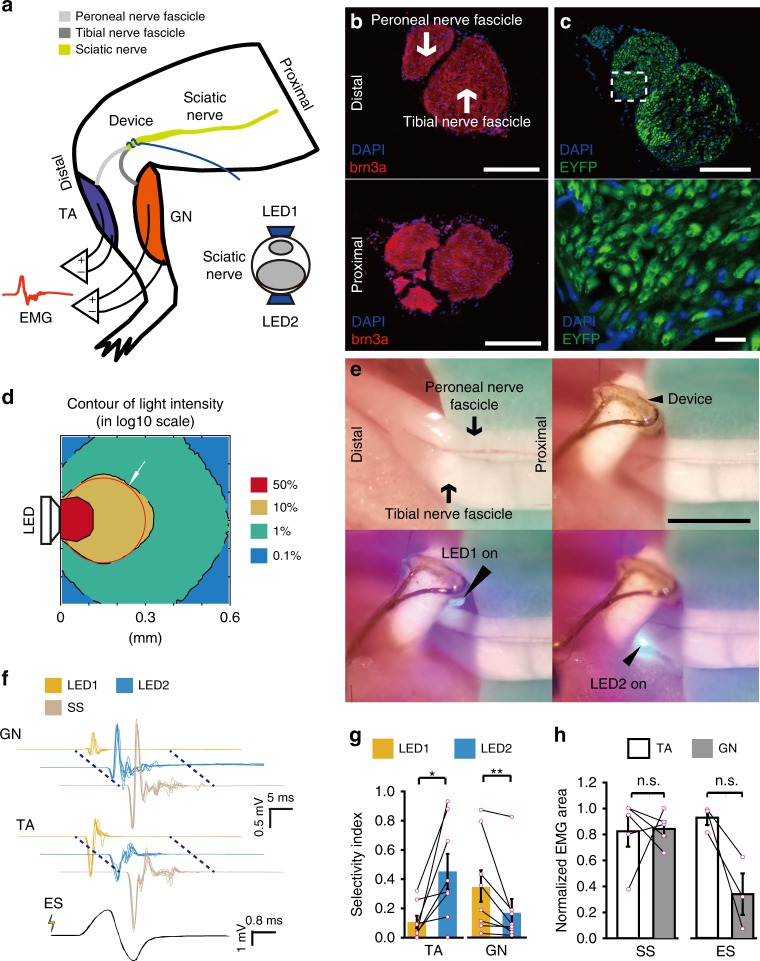
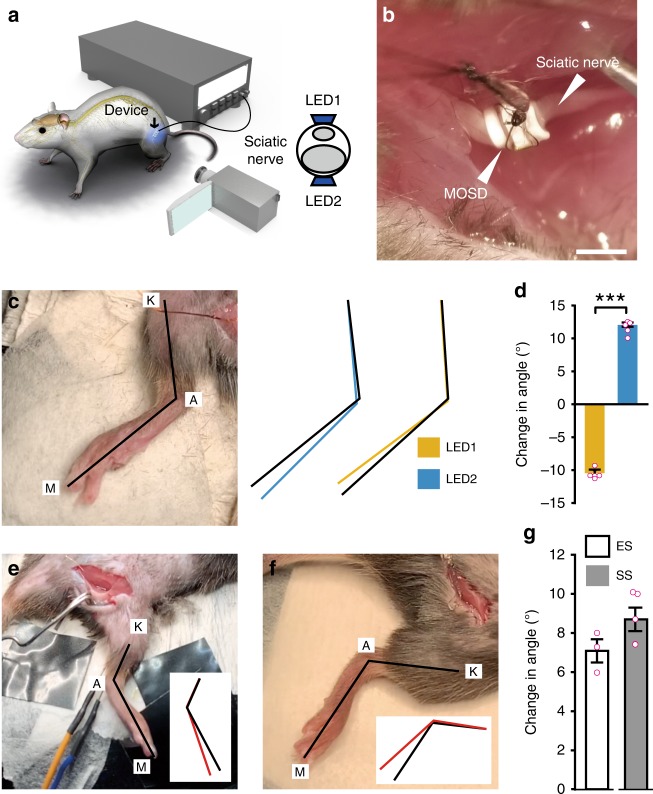
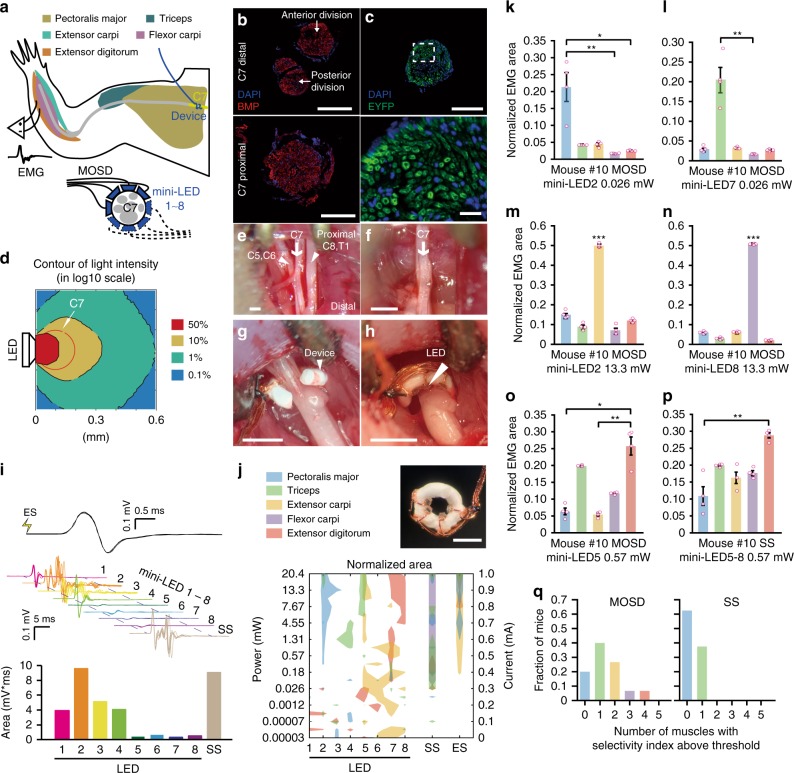
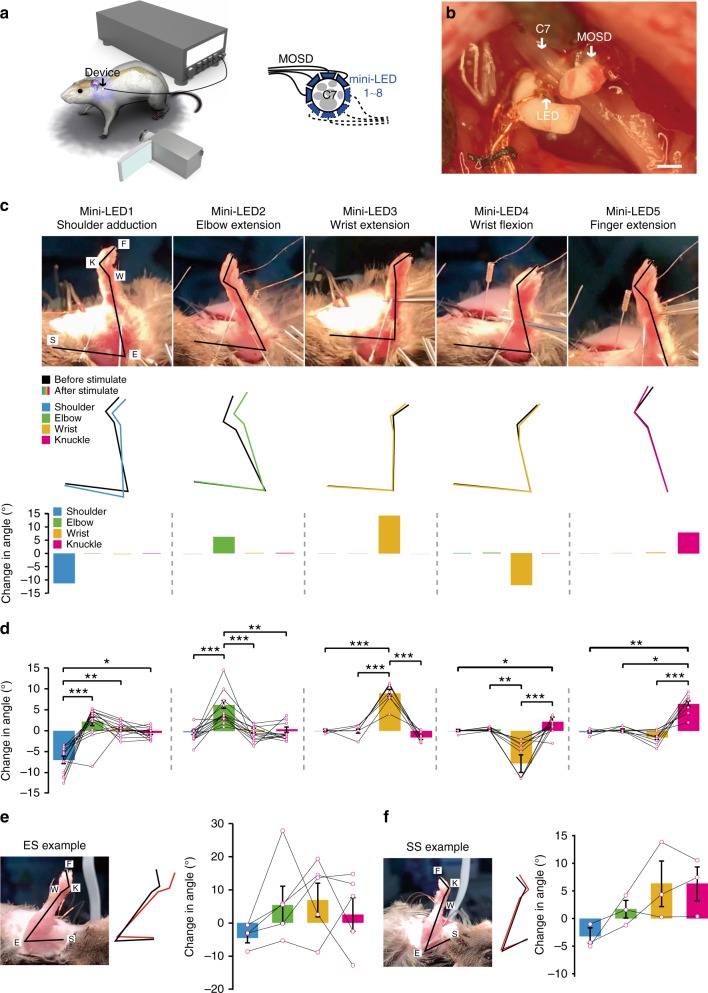
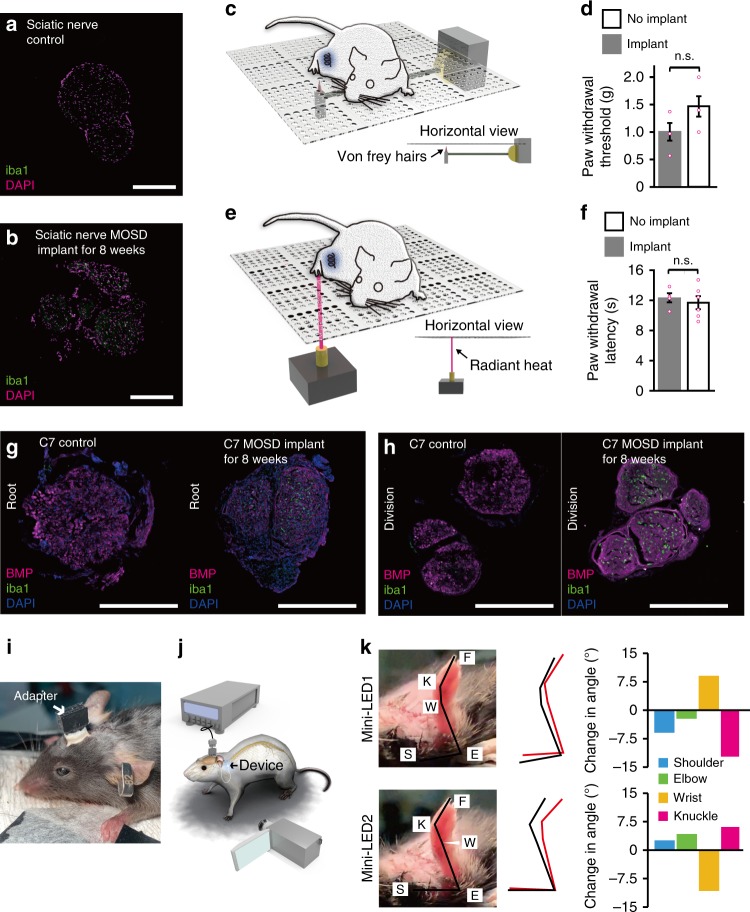
We previously demonstrated that for long-term spastic limb paralysis, transferring the seventh cervical nerve (C7) from the nonparalyzed side to the paralyzed side results in increase of 17.7 in Fugl-Meyer score. One strategy for further improvement in voluntary arm movement is selective activation of five target muscles innervated by C7 during recovery process. In this study, we develop an implantable multisite optogenetic stimulation device (MOSD) based on shape-memory polymer. Two-site stimulation of sciatic nerve bundles by MOSD induces precise extension or flexion movements of the ankle joint, while eight-site stimulation of C7 nerve bundles induce selective limb movement. Long-term implant of MOSD to mice with severed and anastomosed C7 nerve is proven to be both safe and effective. Our work opens up the possibility for multisite nerve bundle stimulation to induce highly-selective activations of limb muscles, which could inspire further applications in neurosurgery and neuroscience research.


Conflict of interest statement

The authors declare no competing interests.

Figures

Fig. 1
Fig. 1
A cartoon of multisite optogenetic stimulation device for therapeutic neuroprosthetics. C7 (~1 cm in diameter in humans) comprises the sensory, pectoralis major, wrist extensor, latissimus dorsi, finger extensor, and triceps branches. In the C7 transfer surgery, C7 on the paralyzed side will be severed and anastomosed directly to the cut end on the nonparalyzed side using microsurgical suturing. The multisite optogenetic stimulation device is comprised of multiple mini-LEDs of 320 μm × 240 μm in physical size and 160 μm × 240 μm in illumination area
Fig. 2
Fig. 2
Fabrication and performance of the multisite optogenetic stimulation device (MOSD). a Flow chart for MOSD fabrication. (1) Production of a polyurethane fiber; (2) attachment of mini-LEDs to the fiber; (3) shaping of the fiber into a spiral shape; (4) final device. b Schematic diagram of device encapsulation. c, d Images of the MOSD wrapped around nerves with different diameters. c Mouse C7 nerve. d Mouse sciatic nerve. e An image of the MOSD at its original length fixed onto the mouse sciatic nerve. f An image of the elongated MOSD in e. g Mechanical properties of the polyurethane fiber under light or heat. LED was turned on at 2.5 V, 20.7 µA (0.0012 mW). The device was kept at 50 °C in the heated condition (green line). The original length of the MOSD is 39 mm. h The MOSD with mini-LEDs turned on in saline. i The MOSD with mini-LEDs turned on after 4 months continuously submerged in saline. j I–V curve as well as temperature changes at different input voltages for the mini-LED. Voltage applied to the mini-LED varied from 2.3 to 3.5 V (0.00003 mW–33.1 mW). The stimulation patterns for applied voltages are 20 msec-on/2 sec-off and 1 sec-on/4 sec-off. Scale bars are 400 µm (c), 2 mm (d), and 1 mm (e, f)
Fig. 3
Fig. 3
MOSD stimulation of the sciatic nerve in Thy1-ChR2 mice. a Schematic diagram of the MOSD attached to the distal side of a sciatic nerve. Stimulation was provided at 0.2 Hz (turned on for 20 msec-on/5 sec-off). Electromyography was performed on the tibialis anterior muscle (TA) and gastrocnemius muscle (GN). b Cross section of the sciatic nerve at the location of the MOSD (upper panel) and 4 mm from the location of the MOSD (lower panel). Red staining is brn3a, and blue staining is DAPI. c Transverse section of the sciatic nerve. Green staining is ChR2-EYFP, and blue staining is DAPI. d Monte-Carlo simulation of mini-LED light intensity across and around the mouse sciatic nerve. The red circle indicates the sciatic nerve in adult mice with a 300-μm diameter. e Mini-LED1 and 2 of the MOSD positioned on the distal side of the sciatic nerve to stimulate peroneal and tibial nerve fascicles at 0.026 mW (20 msec on-2sec off), respectively. f Representative electromyogram recorded from the TA and GN by different mini-LEDs of MOSD (20. 4 mW power, calculated light intensity at the distal end was 134.8 mW mm−2, 20 msec-on/2 sec-off), single-site optogenetic stimulation (81.6 mW power, calculated light intensity at the distal end was 539.2 mW mm−2, 20 msec-on/2 sec-off) and electrical stimulation in mice. The electrical stimulation pulse was 0.6 mA for 0.2 msec. g, h Normalized myoelectric area of the TA and GN in response to different mini-LED stimulations (n = 8 mice, 1.31 mW–20.4 mW, 20 msec-on/2 sec-off, TA: Paired t-test, GN: Wilcoxon Signed Rank Test), single-site optogenetic stimulation (n = 5 mice, paired t test) and electrical stimulation (n = 3 mice, 4.55 mW, 20 msec-on/2 sec-off, Paired t-test). SS: Single-site optogenetic stimulation; ES: electrical stimulation. Data are presented as mean ± s.e.m.; *P < 0.05, **P < 0.01. Scale bars are 100 µm (b, c (top)), 10 µm (c (bottom)) and 200 µm (e)
Fig. 4
Fig. 4
MOSD induced selective extension and flexion in the ankle joint. a Schematic diagram of Thy1-ChR2 mice implanted with the MOSD. b An image of the MOSD firmly wrapped around the sciatic nerve. c The knee joint (K), ankle (A), and metatarsal head (M) were labeled in an anesthetized mouse. Black lines represented the original position of the K-A-M. Blue and Yellow lines represented the positions of K-A-M in response to mini-LED1 and mini-LED2. d Average change in the angle of the ankle joint in response to mini-LED1 and mini-LED2 (light turned on at 20. 4 mW for 20 msec with 2-sec intervals, calculated light intensity at the mini-LED: 888 mW mm−2; in the middle: 398 mW mm−2; at the far end: 134 mW mm−2; n = 5 mice, Paired t test; ***P < 0.001). e Representative image of the position of the leg before electrical stimulation (0.5–0.7 mA, 0.2 msec). Black line in the inset represented the original position of K-A-M. Red line in the inset represented the position of K-A-M after electrical stimulation. f Representative image of the position of the leg before the single-site optogenetic stimulation (81.6 mW, 20 msec-on/2 sec-off). Black line in the inset represented the original position of K-A-M. Red line in the inset represented the position of K-A-M after electrical stimulation. g Average change in the angle of the ankle joint in response to electrical stimulation (n = 3 mice) and single-site optogenetic stimulation (n = 5 mice, 81.6 mW). Data are presented as mean ± s.e.m. Extension was defined as positive angle; flexion was defined as negative angle. ES: Electrical stimulation; SS: single-site optogenetic stimulation. Scale bar is 1 mm (b)
Fig. 5
Fig. 5
MOSD stimulation of C7 nerve bundle in Thy1-ChR2-EYFP mice. a Schematic of experimental set-up. MOSDs were implanted on the proximal side of C7 nerve bundle and electromyography was recorded. b Immunofluorescence staining of C7 nerve at distal side (upper) and proximal side (lower). Red, BMP. Blue, DAPI. c Expression of EYFP in C7 nerve of Thy1-ChR2-EYFP mice. Green, EYFP. Blue, DAPI. d Monte-Carlo simulation of mini-LED light intensity across and around C7 nerve. eh Illustration of MOSD implantation process on C7 nerve. e Identification of C5–8 and T1 nerves. f excise C5–6, 8, and T1 nerves. g MOSD implanted on the proximal side of C7 nerve. h MOSD was turned 180°. i Representative electromyogram from Triceps by different mini-LEDs (20.4 mW, 20 msec-on/2 sec-off, calculated light intensity at the mini-LED: 888 mW mm−2; in the middle: 602 mW mm−2; at the far end: 267 mW mm−2) of MOSD, single-site optogenetic (SS) (81.6 mW, 20 msec-on/2 sec-off), and electrical stimulation (ES) (0.6 mA, 0.2 msec-on/1 sec-off) in one mouse. Myoelectric area was presented below. j MOSD (top right) with mini-LED (bottom) representative response pattern of Pectoralis major (PM), Triceps (Tr), Extensor carpi (EC), Flexor carpi (FC), and Extensor digitorum (ED) by different mini-LEDs of MOSD, SS and ES in one mouse. Left Y axis: mini-LED light power. Right Y axis: current used for ES. ko Representive mouse showed selectivity for PM, Tr, EC, FC, and ED by MOSD (n = 4 trials. k, l, o- Friedman’s ANOVA on Ranks with Tukey post hoc; m, n: One way ANOVA with Tukey post hoc, *P < 0.05, **P < 0.01, ***P < 0.001). p The same mouse showed selectivity in only one muscle by SS. **P < 0.01, n = 4 trials, Friedman’s ANOVA on Ranks with Tukey post hoc. q Summarized distribution of the fraction of mice with numbers of muscles which showed selectivity (n = 15 mice for MOSD, n = 8 mice for SS). Data are presented as mean ± s.e.m. Scale bars are 100 µm (b, c (top)), 10 µm (c (bottom)) and 400 µm (eh, j (top right))
Fig. 6
Fig. 6
MOSD induced distinct upper limb movement in Thy1-ChR2 mice. a Schematic of C7 nerve implanted with MOSD and experimental set-up. b Image of MOSD wrapped around C7 nerve bundle. c Representative images of upper limb movement elicited by different mini-LEDs of MOSD (20.4 mW, 20 msec-on/2 sec-off, calculated light intensity at the mini-LED: 888 mW mm−2; in the middle: 602 mW mm−2; at the far end: 267 mW mm−2). F, fingertip. K, knuckle. W, wrist. E, elbow. S, shoulder. Black line represented the position of upper limb before mini-LED stimulation. Colored line represented the position of upper limb after mini-LED stimulation. d Joint angle movement of shoulder, elbow, wrist, and knuckle response to mini-LEDs (shoulder adduction, n = 14 mice; elbow extension, n = 14 mice; wrist extension, n = 7 mice; wrist flexion, n = 12 mice; finger extension, n = 10 mice) in 1.31–20.4 mW (20 msec-on/2 sec-off) (shoulder adduction, elbow extension, wrist flexion, finger extension: Friedman’s RM ANOVA on Ranks with Tukey post hoc; wrist extension: One way RM ANOVA with Tukey post hoc. *P < 0.05, **P < 0.01, ***P < 0.001). e Representative images of upper limb movement elicited by electrical stimulation (ES) (0.8 mA, 0.2 msec-on/1 sec-off). Joint angle movement of shoulder, elbow, wrist, knuckle under electrical stimulation (n = 5 mice). f Representative images of upper limb movement by single-site optogenetic stimulation (SS) (81.6 mW, 20 msec-on/2 sec-off). Joint angle movement of shoulder, elbow, wrist, knuckle in single-site optogenentic stimulation (middle right) and MOSD stimulation (right). Extension was defined as positive angle; flexion was defined as negative angle (n = 3 mice). Data are presented as mean ± s.e.m. Scale bar is 200 µm (b)
Fig. 7
Fig. 7
Biocompatibility and effectiveness of MOSD after 8-week implant. a, b Immunostaining of mice sciatic nerve after 8 weeks MOSD implant. c, d Withdrawal latency of mice in von Frey test. MOSD were implanted into sciatic nerve for 4 weeks. nimplant = 4 mice, nno implant = 6 mice, Unpaired t-test. e, f Withdrawal latency of mice in Hargreaves test. MOSD were implanted into sciatic nerve for 4 weeks. Sham operation group were taken as control. nimplant = 4 mice, nno implant = 6 mice, Unpaired t-test. g, h Immunostaining of mice C7 nerve after 8 weeks MOSD implant in the root and division end. i, j Schematics and images of mice with MOSD implant. Adapter for the MOSD implant was fixed onto the skull. k Different upper limb movements were elicited by mini-LEDs of MOSD (81.6 mW, calculated light intensity at the distal end was 539.2 mW mm−2, 20 msec-on/2 sec-off) 3 weeks after the C7 implant. Black lines represented the position of upper limb before mini-LED stimulation. Red lines represented the position of upper limb after mini-LED stimulation. Data are presented as mean ± s.e.m. Scale bars are 200 µm (a, b, g, h)

Similar articles

Cited by

References

    1. Legg L. Rehabilitation therapy services for stroke patients living at home: systematic review of randomised trials. Lancet. 2004;363:352–356. doi: 10.1016/S0140-6736(04)15434-2. - DOI - PubMed
    1. Olawale O, Gbiri C, Isaac S. Burden of care among informal caregivers of stroke survivors is influenced by intrinsic and extrinsic factors: a multi-centre analytical survey. Physiotherapy. 2015;101:e1135–e1136. doi: 10.1016/j.physio.2015.03.2042. - DOI
    1. Zheng MX, et al. Trial of contralateral seventh cervical nerve transfer for spastic arm paralysis. N. Engl. J. Med. 2018;378:22–34. doi: 10.1056/NEJMoa1615208. - DOI - PubMed
    1. Wenger N, et al. Spatiotemporal neuromodulation therapies engaging muscle synergies improve motor control after spinal cord injury. Nat. Med. 2016;22:138–145. doi: 10.1038/nm.4025. - DOI - PMC - PubMed
    1. Bonizzato M, et al. Brain-controlled modulation of spinal circuits improves recovery from spinal cord injury. Nat. Commun. 2018;9:3015. doi: 10.1038/s41467-018-05282-6. - DOI - PMC - PubMed

Publication types

LinkOut - more resources