. 2019 Jun 26;10(1):2803.
doi: 10.1038/s41467-019-10844-3.

DOT1L inhibition reveals a distinct subset of enhancers dependent on H3K79 methylation

Affiliations

DOT1L inhibition reveals a distinct subset of enhancers dependent on H3K79 methylation

Laura Godfrey et al. Nat Commun. .

Abstract

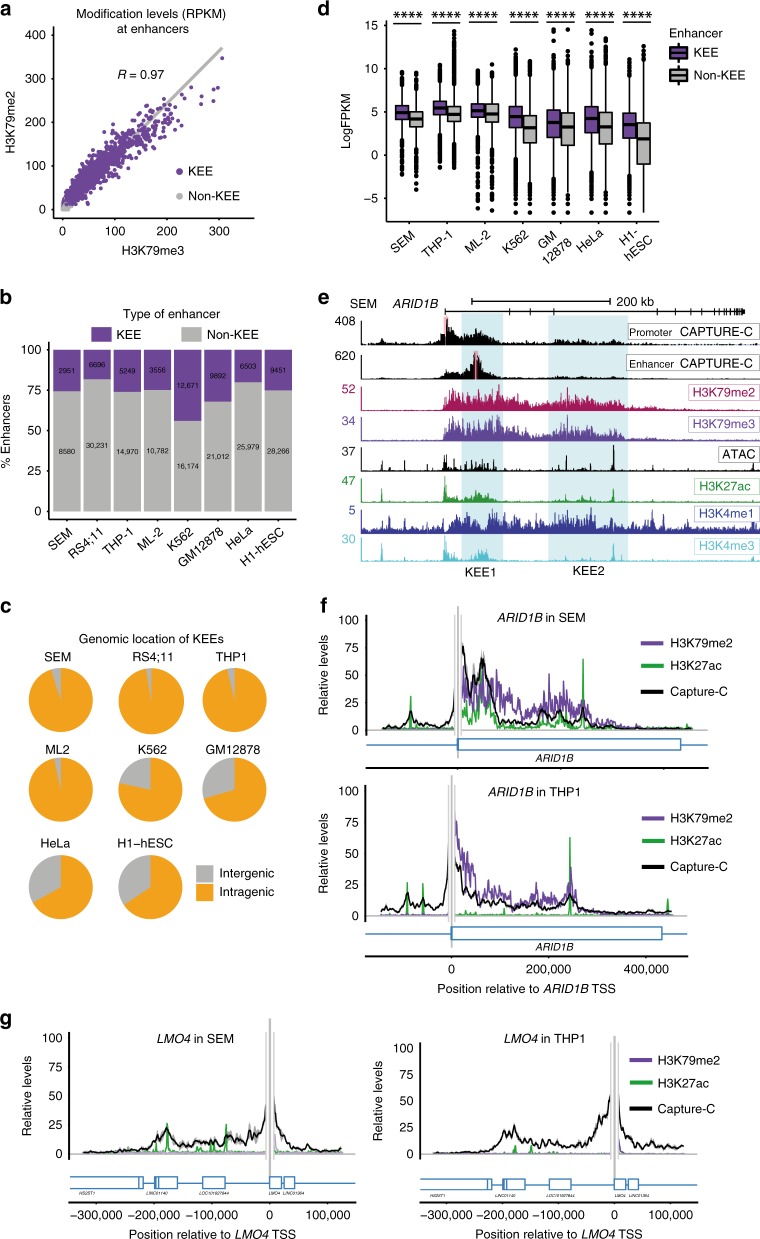
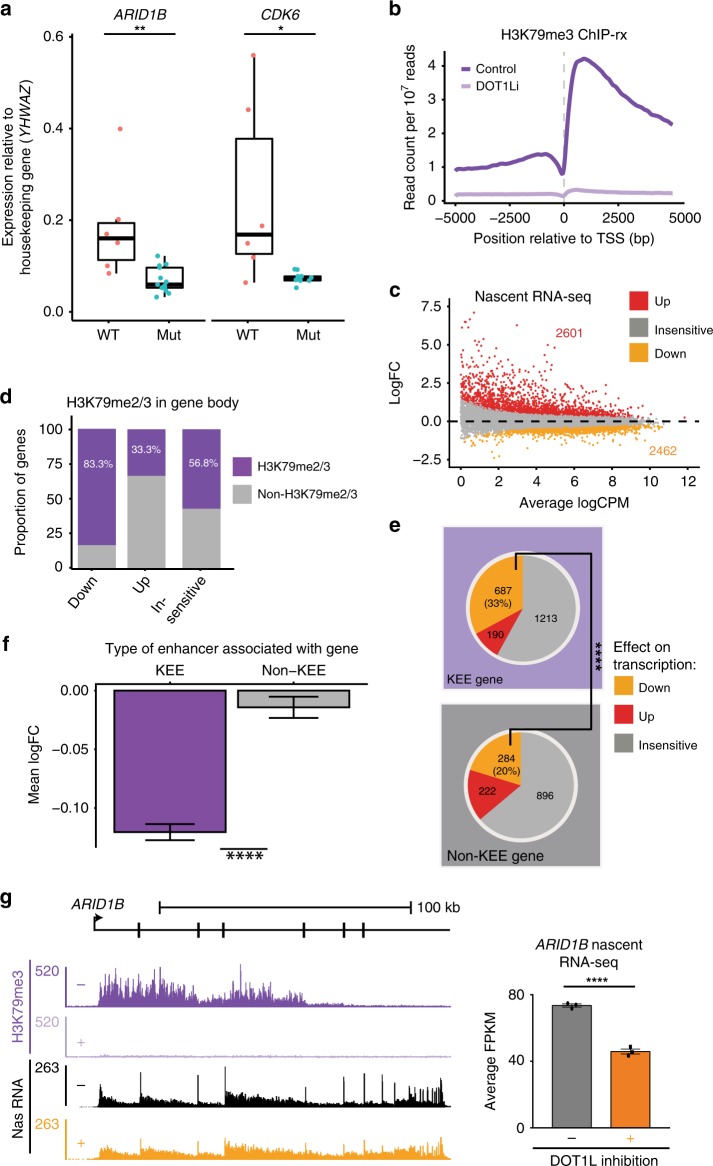
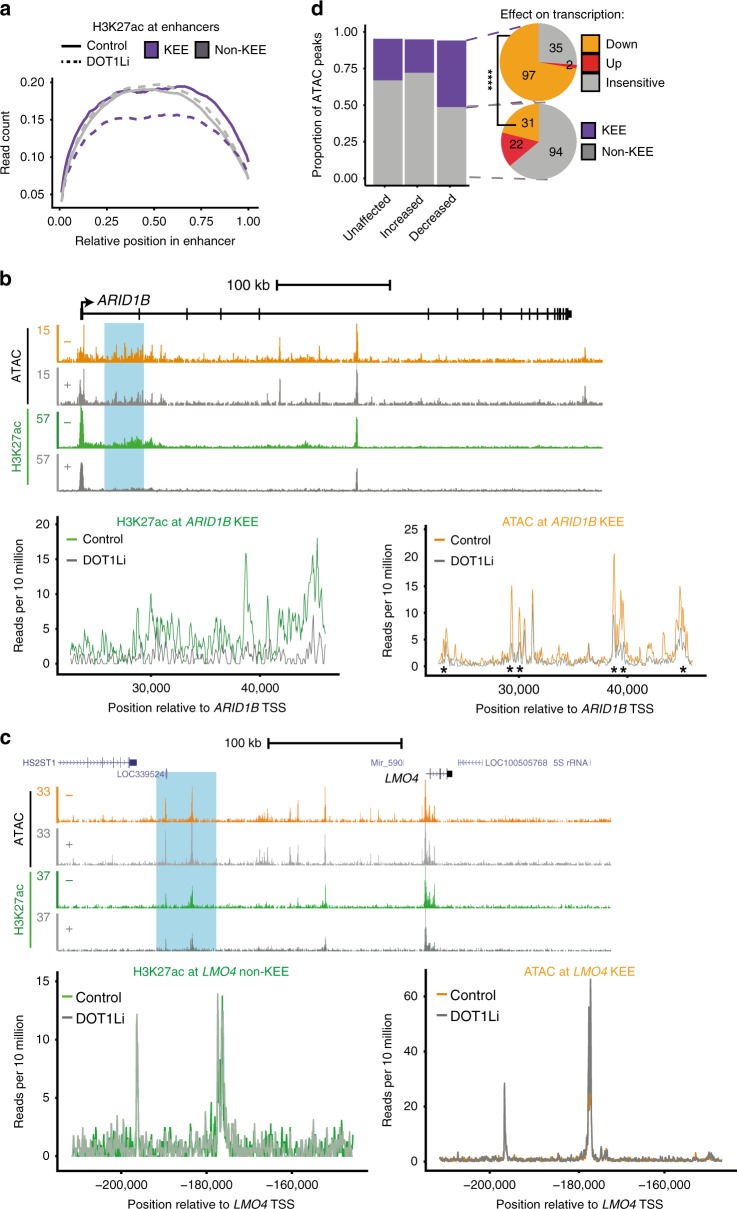
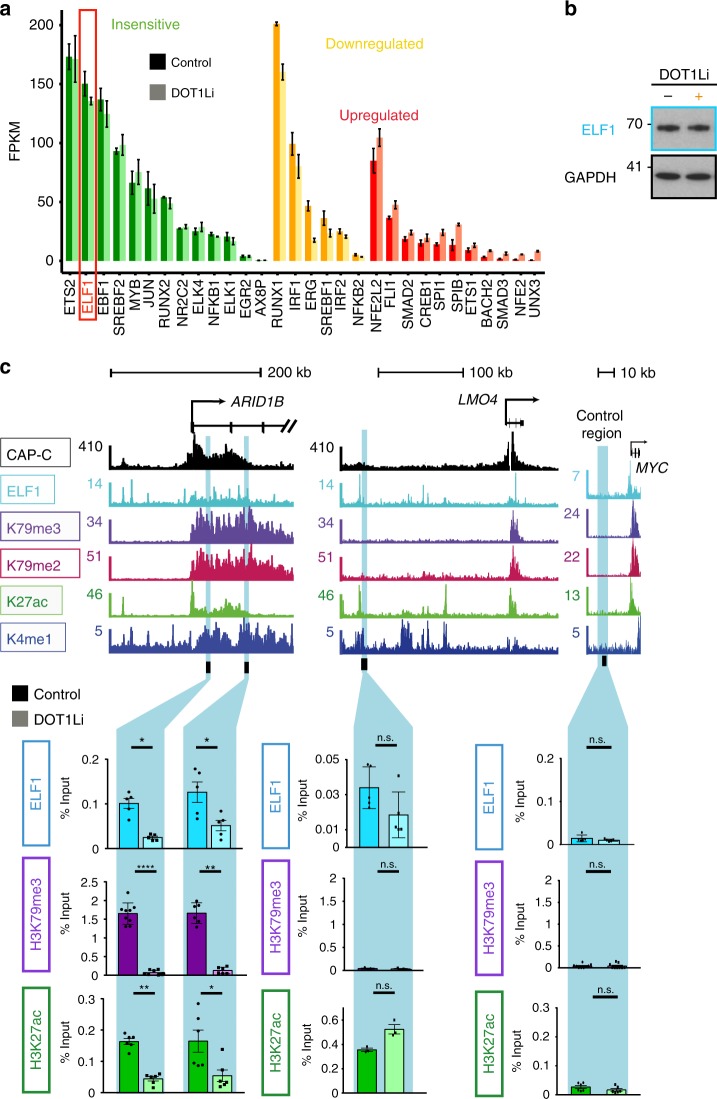
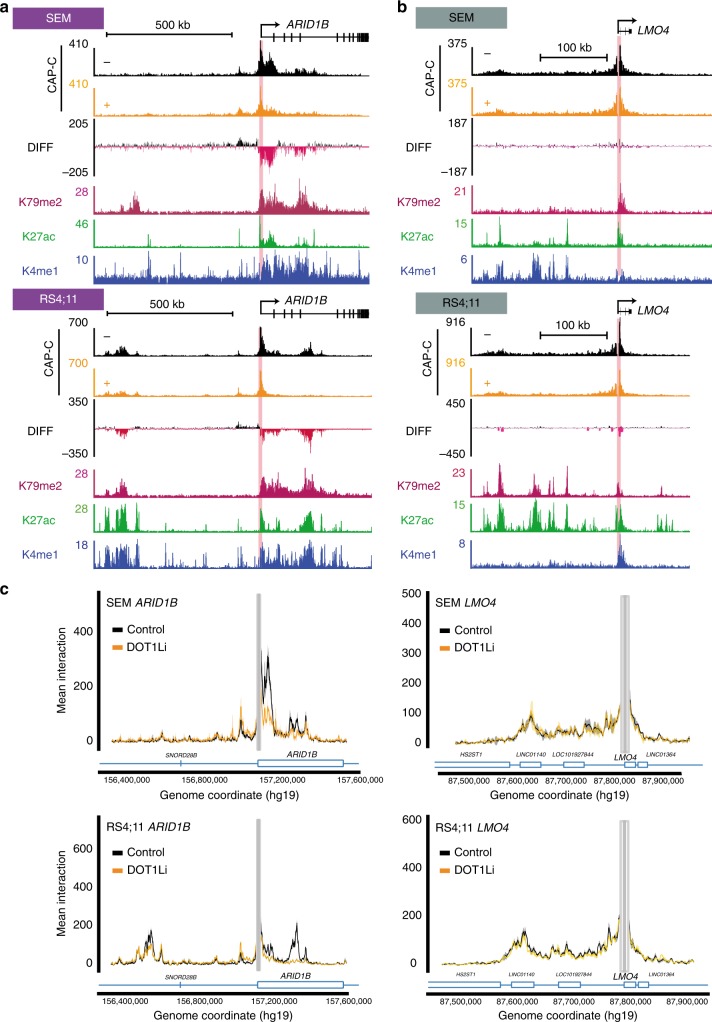
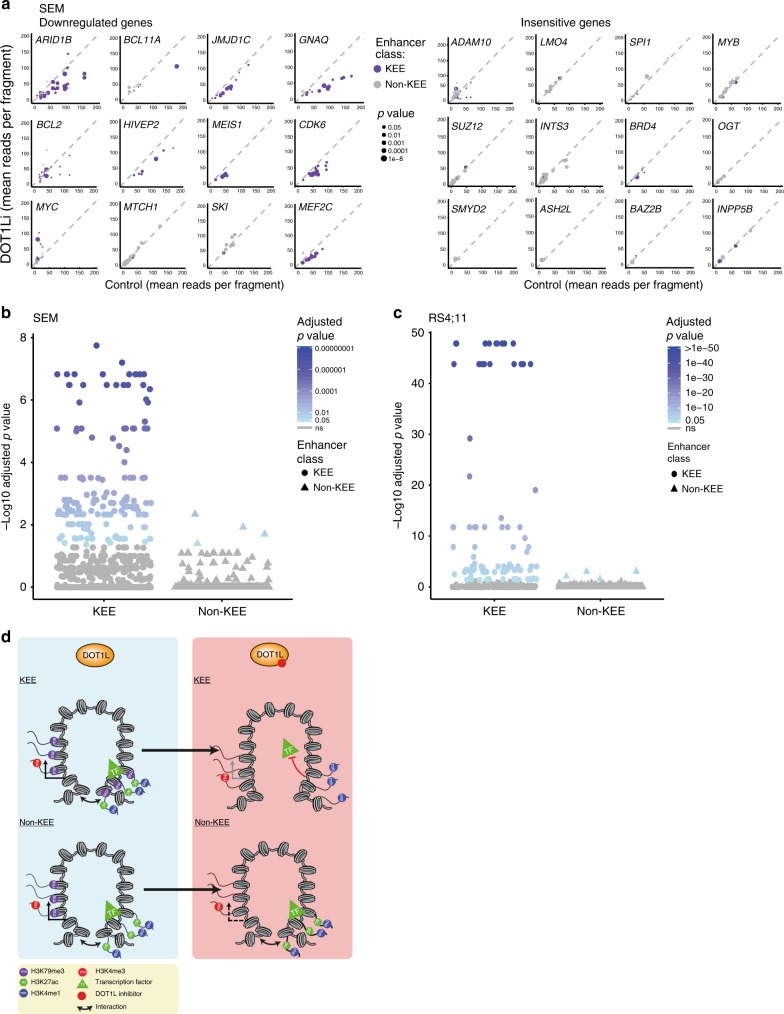
Enhancer elements are a key regulatory feature of many important genes. Several general features including the presence of specific histone modifications are used to demarcate potentially active enhancers. Here we reveal that putative enhancers marked with H3 lysine 79 (H3K79) di or trimethylation (me2/3) (which we name H3K79me2/3 enhancer elements or KEEs) can be found in multiple cell types. Mixed lineage leukemia gene (MLL) rearrangements (MLL-r) such as MLL-AF4 are a major cause of incurable acute lymphoblastic leukemias (ALL). Using the DOT1L inhibitor EPZ-5676 in MLL-AF4 leukemia cells, we show that H3K79me2/3 is required for maintaining chromatin accessibility, histone acetylation and transcription factor binding specifically at KEEs but not non-KEE enhancers. We go on to show that H3K79me2/3 is essential for maintaining enhancer-promoter interactions at a subset of KEEs. Together, these data implicate H3K79me2/3 as having a functional role at a subset of active enhancers in MLL-AF4 leukemia cells.


Conflict of interest statement

P.V. and T.A.M. are founding shareholders of Oxstem Oncology (OSO), a subsidiary company of OxStem Ltd. The other authors declare no competing interests.

Figures

Fig. 1
Fig. 1
H3 lysine 79 methylation 2/3 (H3K79me2/3) marks a subset of enhancers. a Correlational analysis between H3K79me2 chromatin immunoprecipitation-sequencing (ChIP-seq) and H3K79me3 ChIP-seq reads in SEM cells at H3K79me2/3 enhancer elements (KEEs) (purple) and non-KEEs (gray), based on one biological replicate. b Proportion of predicted enhancers, which are KEEs (purple) or non-KEEs (gray) in different cell types, based on ChromHMM analysis. c Genomic location, either intragenic (orange) or intergenic (gray), of KEEs in different cell types. d Gene expression (log FPKM (fragments per kilobase of transcript, per million) values) of KEE genes (purple) and non-KEE genes (gray) in different cell types. Most data were based upon one replicate; SEM and THP1 data were based on three replicates. ****p < 0.0001, using a Mann–Whitney U test. Box plots show interquartile range; center line represents the median value. e Capture-C, ChIP-seq, and assay for transposase-accessible chromatin using sequencing (ATAC-seq) at ARID1B performed in SEM cells. Blue boxes indicate KEE clusters 1 and 2. Red bars indicate location of Capture-C probes. Capture-C track is mean of three biological replicates; ATAC-seq is a representative track of five biological replicates. f, g Overlay of Capture-C with H3K79me2 and H3 lysine 27 acetylation (H3K27ac) ChIP-seq at ARID1B and LMO4 in SEM and THP1 cells. Gray bars represent location of Capture-C probe, ±1 kb exclusion zone. Shaded area around Capture-C signal represents 1 s.d. See also Supplementary Fig. 1
Fig. 2
Fig. 2
Loss of H3 lysine 79 methylation 2/3 (H3K79me2/3) at enhancers leads to a reduction in transcription at H3K79me2/3 Enhancer Element (KEE) genes. a Gene expression in wild-type SEM compared to ARID1B and CDK6 enhancer mutant clones, normalized to the housekeeping gene YWHAZ. Each point represents a biological replicate. Mann–Whitney U test, *p < 0.01, **p < 0.05 based upon nine biological replicates. Box plots show interquartile range; center line represents the median value. b Metaplot of H3K79me3 reference-normalized ChIP-seq (ChIP-rx) signal at all transcriptional start sites (TSSs) following DOT1Li (EPZ-5676) treatment (lilac) compared to control treatment (purple) in SEM cells. c MA plot of nascent RNA-seq data showing differential gene expression (up (red), down (orange), and insensitive (gray)) in SEM cells following DOT1Li. Differential expression = FDR (false discovery rate) < 0.05 from three biological replicates. d Proportion of differentially expressed genes and insensitive genes, which are directly marked with H3K79me2/3 in the gene body in SEM cells. e Proportion of KEE genes and non-KEE genes, which are upregulated (red), downregulated (orange), or insensitive (gray) following DOT1Li by nascent RNA sequencing (****p < 0.0001, Fisher’s exact test), n = 3. f Mean log FC of H3K79me2/3-marked genes associated with a KEE (purple) or non-KEE (gray) following DOT1Li, from nascent RNA-seq data (****p < 0.0001, Fisher’s exact test, n = 3). Error bars represent s.e.m. g Left: H3K79me3 ChIP-rx tracks showing control (−, purple) and DOT1Li (+, lilac) samples, and nascent RNA-seq tracks showing control (−, black) and DOT1Li (+ , orange) samples at ARID1B in SEM cells. Right: Bar chart displaying mean FPKM at ARID1B in control (−, black) and DOT1Li (+, orange) conditions. ****FDR < 0.0001, n = 3. Error bars represent s.e.m. Source data are provided as a source data file. See also Supplementary Fig. 2
Fig. 3
Fig. 3
Loss of H3 lysine 79 methylation 2/3 (H3K79me2/3) leads to reduction in H3 lysine 27 acetylation (H3K27ac) and chromatin accessibility at H3K79me2/3 Enhancer Elements (KEEs). a Metaplot of H3K27ac chromatin immunoprecipitation-sequencing (ChIP-seq) signal across KEEs (purple) or non-KEEs (gray) in control (solid line) and DOT1Li (dashed line) SEM cells, n = 1. b, c Upper: assay for transposase-accessible chromatin using sequencing (ATAC-seq) and H3K27ac ChIP-seq at ARID1B and LMO4 in control (−, orange/green) and DOT1Li (+, gray) SEM cells. Blue boxes highlight KEE cluster 1 region of ARID1B and non-KEE region associated with LMO4. Lower: Overlay of H3K27ac (left) and ATAC (right) signal at ARID1B KEE1 and LMO4 non-KEE in control (green/orange) and DOT1Li (gray). Asterisks represent significant decreases in ATAC signal following DOT1Li, false discovery rate (FDR) < 0.05. d Left: Proportion of increased, decreased, or unchanged ATAC peaks found within a KEE (purple) or non-KEE (gray). Right: Proportion of decreased ATAC peaks within a KEE (upper) or non-KEE (lower) that are associated with transcriptionally downregulated (orange), upregulated (red), or insensitive (gray) gene. ****P < 0.0001, Fisher’s exact test, n = 5. See also Supplementary Fig. 3
Fig. 4
Fig. 4
Loss of H3 lysine 79 methylation 2/3 (H3K79me2/3) leads to a reduction in ELF1 binding at H3K79me2/3 Enhancer Elements (KEEs). a Expression level of transcription factors whose motifs are enriched at KEEs compared to the rest of the genome, sorted into categories of transcriptionally insensitive (green), downregulated (orange), and upregulated (red) following DOT1Li. ELF1 is highlighted in a red box. b Western blot analysis of ELF1 and GAPDH following salt-soluble protein extraction of SEM cells in control (−) and DOT1Li (+) conditions. Representative of three biological replicates. c Chromatin immunoprecipitation-quantitative PCR (ChIP-qPCR) at ARID1B KEEs, LMO4 non-KEE and negative control locus for ELF1, H3K79me3, and H3 lysine 27 acetylation (H3K27ac in control (darker shade) and DOT1Li (lighter shade) conditions. n = 6, error bars represent s.e.m. *P < 0.05, **p < 0.005, ****p < 0.0001 using a Mann–Whitney U test. n.s. not significant. Source data are provided as a source data file. See also Supplementary Fig. 4
Fig. 5
Fig. 5
Loss of H3 lysine 79 methylation 2/3 (H3K79me2/3) leads to a reduction in H3K79me2/3 Enhancer Element (KEE)–promoter interactions. a Capture-C (n = 3) at ARID1B in SEM and RS4;11 cells in control (black) and DOT1Li (orange) conditions. Differential track shows average difference in Capture-C signal following DOT1Li, from three biological replicates. Loss of interaction (pink), and gain of interaction (black). H3K79me2, H3 lysine 27 acetylation (H3K27ac), H3K4me1 chromatin immunoprecipitation-sequencing (ChIP-seq) at ARID1B. Red line represents location of Capture-C probe. b Capture-C (n = 3) and ChIP-seq at LMO4 in SEM and RS4;11 cells, as in a. c Overlay of control (black) and DOT1Li (orange) Capture-C signal (average of three biological replicates) from the ARID1B and LMO4 promoters in SEM and RS4;11 cells. Gray bars represent location of Capture-C probe, ±1 kb exclusion zone. Shaded area around Capture-C signal represents 1 s.d. See also Supplementary Fig. 5
Fig. 6
Fig. 6
Loss of H3 lysine 79 methylation 2/3 (H3K79me2/3) leads to widespread reductions in H3K79me2/3 Enhancer Element (KEE)–promoter interactions. a Enhancer–promoter Capture-C interaction frequencies in Control (x-axis) and DOT1Li (y-axis) SEM cells. Left: Interactions with DOT1Li-downregulated genes; right: DOT1Li-insensitive genes. Each point represents the interaction of a KEE (purple) or non-KEE (gray) with the indicated gene promoter. Size of dot corresponds to significance of change in interaction, using a Wilcoxon’s rank test. See Supplementary Table 1 for list of p values. b, c Statistical analysis of the significance of the change in enhancer–promoter Capture-C interactions following DOT1Li in SEM and RS4;11 cells. Each point represents the interaction of a KEE (circle) or non-KEE (triangle) with a gene promoter. Holm–Bonferroni adjusted p values were calculated following a Wilcoxon’s rank test (n = 3). d Model for the role of H3K79me2/3 at KEEs. Loss of H3K79me2/3 at KEEs following DOT1Li leads to a reduction in H3K27ac, transcription factor (TF) binding and enhancer–promoter interactions. This is associated with a reduction in gene expression of the KEE-associated gene. Loss of H3K79me2/3 within the gene body leads to no changes in non-KEE enhancer activity or enhancer–promoter interaction. A reduction in transcription of the non-KEE gene may be observed due to enhancer-independent roles of H3K79me2/3 in the gene body. See also Supplementary Fig. 6

References

    1. Furlong EEM, Levine M. Developmental enhancers and chromosome topology. Science. 2018;361:1341–1345. doi: 10.1126/science.aau0320. - DOI - PMC - PubMed
    1. Williamson I, Lettice LA, Hill RE, Bickmore WA. Shh and ZRS enhancer colocalisation is specific to the zone of polarising activity. Development. 2016;143:2994–3001. doi: 10.1242/dev.139188. - DOI - PMC - PubMed
    1. Chen H, et al. Dynamic interplay between enhancer-promoter topology and gene activity. Nat. Genet. 2018;50:1296–1303. doi: 10.1038/s41588-018-0175-z. - DOI - PMC - PubMed
    1. Brown JM, et al. A tissue-specific self-interacting chromatin domain forms independently of enhancer–promoter interactions. Nat. Commun. 2018;9:3849. doi: 10.1038/s41467-018-06248-4. - DOI - PMC - PubMed
    1. Monahan K, Horta A, Lomvardas S. LHX2- and LDB1-mediated trans interactions regulate olfactory receptor choice. Nature. 2019;565:448–453. doi: 10.1038/s41586-018-0845-0. - DOI - PMC - PubMed

Publication types

MeSH terms