

Standardized next-generation sequencing of immunoglobulin and T-cell receptor gene recombinations for MRD marker identification in acute lymphoblastic leukaemia; a EuroClonality-NGS validation study
- PMID: 31243313
- PMCID: PMC6756028
- DOI: 10.1038/s41375-019-0496-7
Standardized next-generation sequencing of immunoglobulin and T-cell receptor gene recombinations for MRD marker identification in acute lymphoblastic leukaemia; a EuroClonality-NGS validation study
Abstract
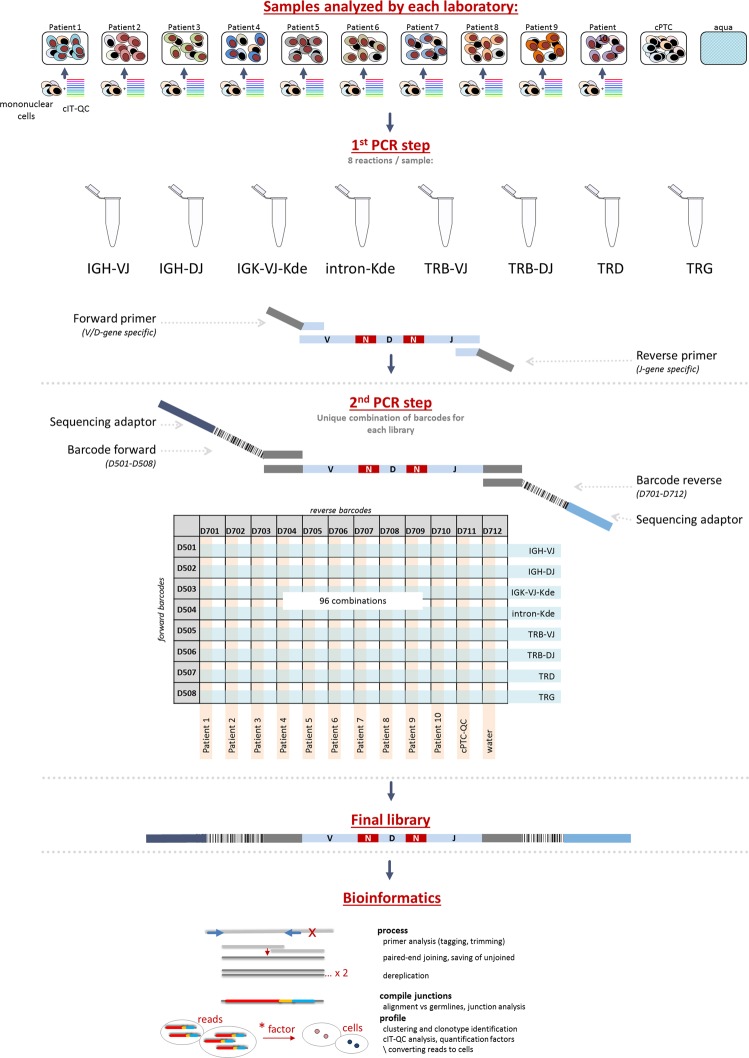
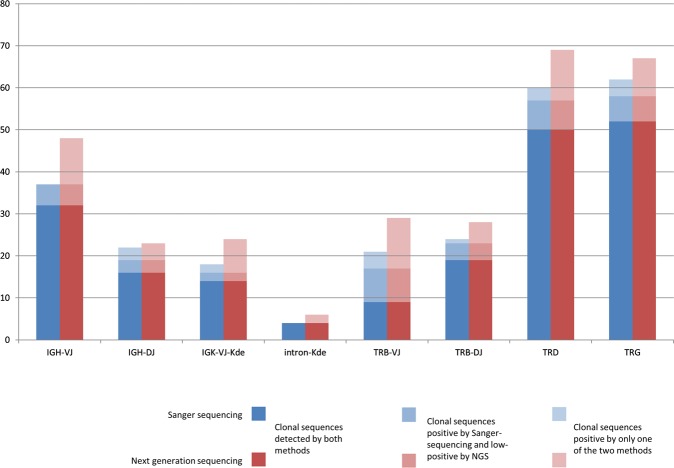
Amplicon-based next-generation sequencing (NGS) of immunoglobulin (IG) and T-cell receptor (TR) gene rearrangements for clonality assessment, marker identification and quantification of minimal residual disease (MRD) in lymphoid neoplasms has been the focus of intense research, development and application. However, standardization and validation in a scientifically controlled multicentre setting is still lacking. Therefore, IG/TR assay development and design, including bioinformatics, was performed within the EuroClonality-NGS working group and validated for MRD marker identification in acute lymphoblastic leukaemia (ALL). Five EuroMRD ALL reference laboratories performed IG/TR NGS in 50 diagnostic ALL samples, and compared results with those generated through routine IG/TR Sanger sequencing. A central polytarget quality control (cPT-QC) was used to monitor primer performance, and a central in-tube quality control (cIT-QC) was spiked into each sample as a library-specific quality control and calibrator. NGS identified 259 (average 5.2/sample, range 0-14) clonal sequences vs. Sanger-sequencing 248 (average 5.0/sample, range 0-14). NGS primers covered possible IG/TR rearrangement types more completely compared with local multiplex PCR sets and enabled sequencing of bi-allelic rearrangements and weak PCR products. The cPT-QC showed high reproducibility across all laboratories. These validated and reproducible quality-controlled EuroClonality-NGS assays can be used for standardized NGS-based identification of IG/TR markers in lymphoid malignancies.
Conflict of interest statement
The EuroClonality-NGS Working Group is an independent scientific subdivision of EuroClonality that aims at innovation, standardization and education in the field of diagnostic clonality analysis. The revenues of the previously obtained patent (PCT/NL2003/000690), which is collectively owned by the EuroClonality Foundation and licensed to InVivoScribe, are exclusively used for EuroClonality activities, such as for covering costs of the Working Group meetings, collective WorkPackages and the EuroClonality Educational Workshops. The EuroClonality consortium operates under an umbrella of ESLHO, which is an official EHA Scientific Working Group. MB: contract research for Affimed, Amgen, Regeneron, advisory board of Amgen, Incyte, Speaker bureau of Janssen, Pfizer, Roche. AWL: contract research for Roche-Genentech, research support from Gilead, advisory board for AbbVie, speaker for Gilead, Janssen. RG-S: research grants from Gilead, Takeda, Amgen, and the Spanish government; and reports consulting fees from Janssen, Takeda, Incyte, and BMS. KS: research support from Janssen, Abbvie, Gilead; speaker for Janssen, Abbvie, Gilead; advisory board for Janssen, Abbvie, Gilead. PG: speaker for Gilead.
Figures
Similar articles
-
Quality control and quantification in IG/TR next-generation sequencing marker identification: protocols and bioinformatic functionalities by EuroClonality-NGS.Leukemia. 2019 Sep;33(9):2254-2265. doi: 10.1038/s41375-019-0499-4. Epub 2019 Jun 21. Leukemia. 2019. PMID: 31227779 Free PMC article.
-
One-Step Next-Generation Sequencing of Immunoglobulin and T-Cell Receptor Gene Recombinations for MRD Marker Identification in Acute Lymphoblastic Leukemia.Methods Mol Biol. 2022;2453:43-59. doi: 10.1007/978-1-0716-2115-8_3. Methods Mol Biol. 2022. PMID: 35622319 Free PMC article.
-
Is Next-Generation Sequencing the way to go for Residual Disease Monitoring in Acute Lymphoblastic Leukemia?Mol Diagn Ther. 2017 Oct;21(5):481-492. doi: 10.1007/s40291-017-0277-9. Mol Diagn Ther. 2017. PMID: 28452038 Review.
-
[Identification of immunoglobulin and T-cell receptor gene rearrangements--prerequisite for monitoring of minimal residual disease in Polish acute lymphoblastic leukemia patients based on European standards. Preliminary results].Med Wieku Rozwoj. 2006 Jan-Mar;10(1 Pt 2):323-34. Med Wieku Rozwoj. 2006. PMID: 17028396 Polish.
-
Immune Gene Rearrangements: Unique Signatures for Tracing Physiological Lymphocytes and Leukemic Cells.Genes (Basel). 2021 Jun 27;12(7):979. doi: 10.3390/genes12070979. Genes (Basel). 2021. PMID: 34198966 Free PMC article. Review.
Cited by
-
Next-generation sequencing for MRD monitoring in B-lineage malignancies: from bench to bedside.Exp Hematol Oncol. 2022 Sep 3;11(1):50. doi: 10.1186/s40164-022-00300-2. Exp Hematol Oncol. 2022. PMID: 36057673 Free PMC article. Review.
-
Minimal residual disease detection by next-generation sequencing of different immunoglobulin gene rearrangements in pediatric B-ALL.Nat Commun. 2023 Nov 17;14(1):7468. doi: 10.1038/s41467-023-43171-9. Nat Commun. 2023. PMID: 37978187 Free PMC article.
-
Characterization of novel, recurrent genomic rearrangements as sensitive MRD targets in childhood B-cell precursor ALL.Blood Cancer J. 2019 Nov 29;9(12):96. doi: 10.1038/s41408-019-0257-x. Blood Cancer J. 2019. PMID: 31784504 Free PMC article.
-
Droplet Digital PCR Quantification of Mantle Cell Lymphoma Follow-up Samples From Four Prospective Trials of the European MCL Network.Hemasphere. 2020 Apr 3;4(2):e347. doi: 10.1097/HS9.0000000000000347. eCollection 2020 Apr. Hemasphere. 2020. PMID: 32309784 Free PMC article.
-
Application of Next-Generation Sequencing-Based Mutational Profiling in Acute Lymphoblastic Leukemia.Curr Hematol Malig Rep. 2021 Oct;16(5):394-404. doi: 10.1007/s11899-021-00641-5. Epub 2021 Oct 6. Curr Hematol Malig Rep. 2021. PMID: 34613552 Review.
References
-
- Lefranc M-P, Lefranc G. The T cell receptor factsbook. Academic Press; 2001. https://www.sciencedirect.com/science/book/9780124413528. Accessed 22 Mar 2018.
-
- Lefranc M-P, Lefranc G The immunoglobulin factsbook. Academic Press; 2001.
Publication types
MeSH terms
Substances
Grants and funding
LinkOut - more resources
Full Text Sources
Other Literature Sources
