. 2020 Sep;17(9):954-965.
doi: 10.1038/s41423-019-0254-9. Epub 2019 Jun 26.

BANK1 interacts with TRAF6 and MyD88 in innate immune signaling in B cells

Affiliations

BANK1 interacts with TRAF6 and MyD88 in innate immune signaling in B cells

Ina Georg et al. Cell Mol Immunol. 2020 Sep.

Abstract

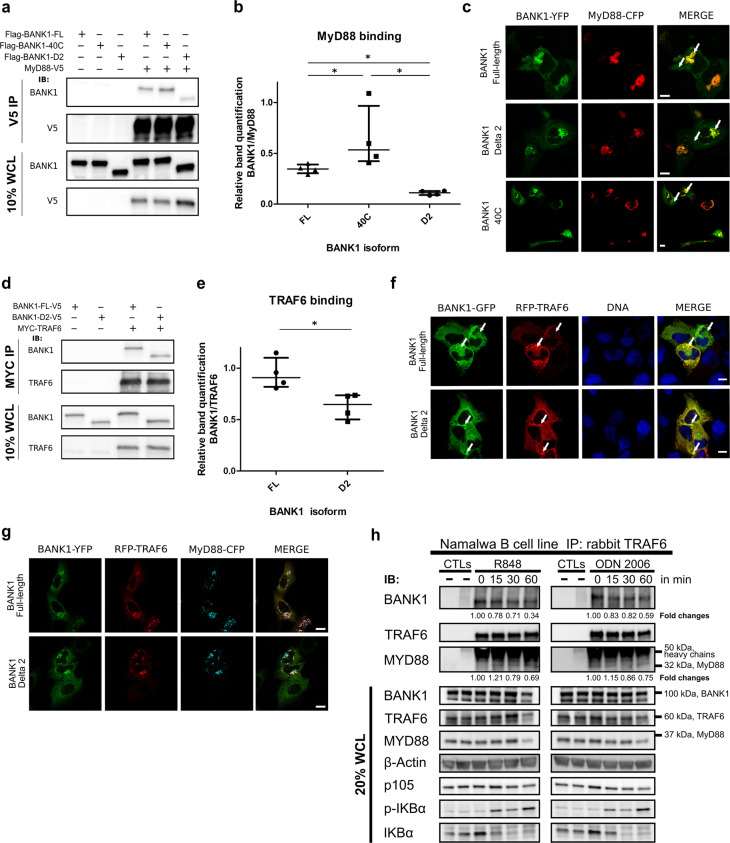
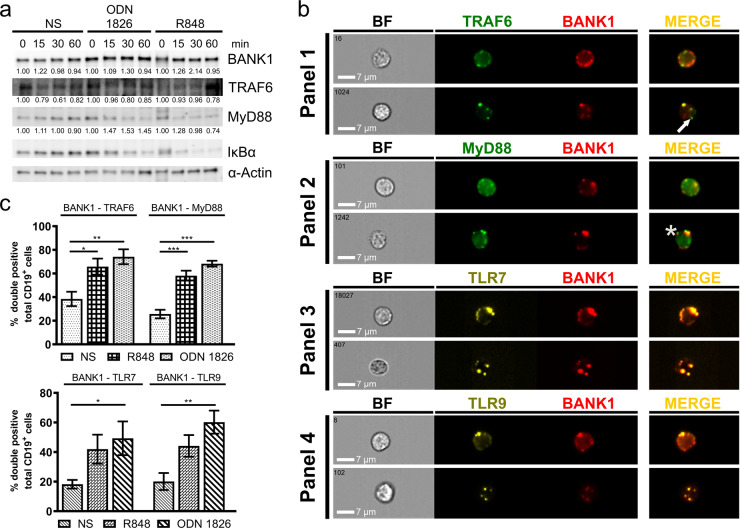
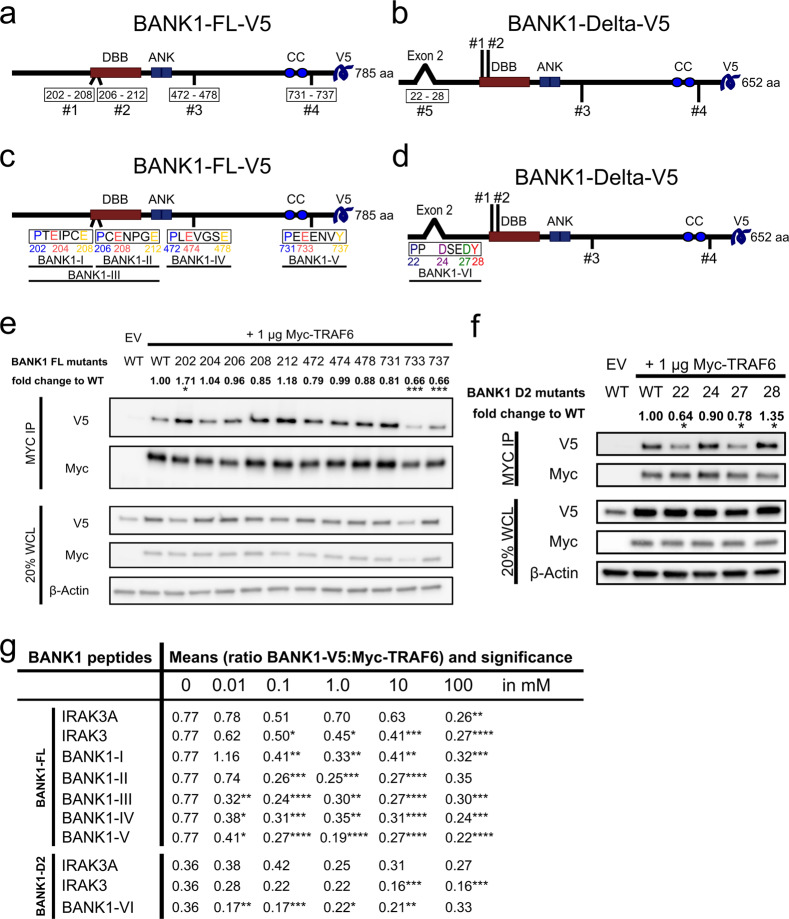
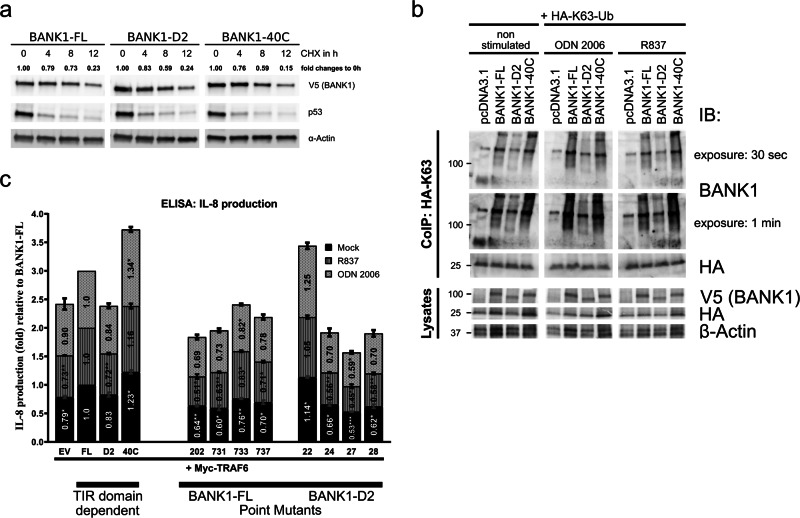
Evidence supports a possible role of BANK1 in innate immune signaling in B cells. In the present study, we investigated the interaction of BANK1 with two key mediators in interferon and inflammatory cytokine production, TRAF6 and MyD88. We revealed by coimmunoprecipitation (CoIP) analyses the binding of BANK1 with TRAF6 and MyD88, which were mediated by the BANK1 Toll/interleukin-1 receptor (TIR) domain. In addition, the natural BANK1-40C variant showed increased binding to MyD88. Next, we demonstrated in mouse splenic B cells that BANK1 colocalized with Toll-like receptor (TLR) 7 and TLR9 and that after stimulation with TLR7 and TLR9 agonists, the number of double-positive BANK1-TLR7, -TLR9, -TRAF6, and -MyD88 cells increased. Furthermore, we identified five TRAF6-binding motifs (BMs) in BANK1 and confirmed by point mutations and decoy peptide experiments that the C-terminal domain of BANK1-full-length (-FL) and the N-terminal domain of BANK1-Delta2 (-D2) are necessary for this binding. Functionally, we determined that the absence of the TIR domain in BANK1-D2 is important for its lysine (K)63-linked polyubiquitination and its ability to produce interleukin (IL)-8. Overall, our study describes a specific function of BANK1 in MyD88-TRAF6 innate immune signaling in B cells, clarifies functional differences between the two BANK1 isoforms and explains for the first time a functional link between autoimmune phenotypes including SLE and the naturally occurring BANK1-40C variant.

Keywords: B cells; BANK1 isoforms; SLE; autoimmunity; innate immune signaling.


Conflict of interest statement

The authors declare no competing interests.

Figures

Fig. 1
Fig. 1
BANK1 interacts and colocalizes with MyD88 and TRAF6. a Nonstimulated HEK293 cells transfected with V5-tagged MyD88 or empty vector (EV) together with Flag-tagged BANK1 constructs. Coimmunoprecipitations (CoIP) were carried out against the V5 epitope, and proteins were detected with the indicated antibodies. b Quantification with ImageJ of four independent experiments. Dots indicate BANK1 CoIP band intensity relative to the amount of MyD88 immunoprecipitated. Medians with interquartile ranges are represented. c BANK1-YFP vectors and MyD88-CFP were transfected into nonstimulated U2OS cells to study their subcellular localization and colocalization. Note that BANK1-YFP isoforms are shown in green and MyD88-CFP in red for a better appreciation of merged images. d Overexpression of Myc–TRAF6 in combination with V5-tagged BANK1–FL or BANK1–D2 in nonstimulated HEK293 cells and immunoprecipitation with an anti-MYC antibody. Immunoblotting with the indicated antibodies shows TRAF6 interaction with both isoforms of BANK1. e Quantification with ImageJ of four independent experiments as in b. Dots indicate BANK1 CoIP band intensity relative to the amount of TRAF6 immunoprecipitated. Medians with interquartile ranges are represented in the graph. f BANK1–GFP vectors for both isoforms and RFP-TRAF6 were transfected into nonstimulated U2OS cells. BANK1–FL and –D2 formed accumulations and defined small punctate structures in which both isoforms were highly colocalized with TRAF6 (arrows, MERGE). Nuclei were stained with DAPI. g BANK1–YFP isoforms were transfected with RFP-TRAF6 and MyD88-CFP vectors into nonstimulated U2OS cells. h Endogenous CoIP reactions in the B cell line Namalwa showed a TRAF6–BANK1–MyD88 interaction. TRAF6 was pulled down, and immunoblotting reactions were developed against BANK1, TRAF6, and MyD88. The image shown is from a single experiment that is representative of at least three separate experiments. Western blot bands from β-actin were densitometrically measured by ImageJ to determine the lane normalization factor for samples that were then used to normalize bands from CoIP reactions. Mean fold changes in the BANK1 and MyD88 interaction relative to TRAF6 over time of stimulation are shown, where time point 0 was taken as the control. See also Supplementary Fig. S4 for graphic presentations of the results and statistics. p105, p-IKBα, and IKBα immunoblots indicate successful stimulation of TLRs. The unpaired nonparametric Mann–Whitney t-test was applied *p < 0.05. All images were taken with a ×63 objective using a ZEISS confocal microscope. Scale bars = 10 µm
Fig. 2
Fig. 2
In vivo analyses of purified splenic mouse B cells. a Western blot of BANK1, TRAF6, MyD88, and IκBα upon stimulation of purified mouse B cells with TLR9 and TLR7 agonists ODN 1826 and R848 for 0, 15, 30, and 60 min. Densitometric measurements were performed on western blot bands using ImageJ. Samples were normalized using β-actin to calculate fold changes in protein expression relative to time point 0. Mean fold changes are shown. The results are from a single experiment that is representative of at least four separate experiments. See also Supplementary material Table S1 in the Excel file for statistics. b Panels 1–4 show imaging flow cytometry images of immunofluorescence reactions from nonstimulated purified mouse splenic B cells, with staining for BANK1 with TRAF6 (Panel 1), MyD88 (Panel 2), TLR7 (Panel 3), and TLR9 (Panel 4). Strong colocalization was observed for all reactions according to the bright detail similarity feature R3 (R3 > 1.0). c Percentages of cells double positive for BANK1–TRAF6, BANK1–MyD88, and BANK1 with TLRs 7 and 9 were determined in nonstimulated cells and after 30 min of R848 and ODN 1826 stimulation. One-way ANOVA was applied for statistical analyses with *p < 0.033, **p < 0.002, and ***p < 0.001 indicating significance.  NS, nonstimulated; BF, brightfield. Scale bars = 7 µm
Fig. 3
Fig. 3
TRAF6-binding motifs (BMs) are necessary for the BANK1–TRAF6 interaction. a Drawings of BANK1–FL–V5 showing the localization of the Dof/BCAP/BANK (DBB) motif (200–327, amino acids, aa, in red), the double ankyrin repeat-like (ANK) motifs (342–408 aa, in blue) and the putative coiled-coil (CC) region (677–705 aa, blue circles). Below, the protein with its four TRAF6 BMs numbered #1 (202–208 aa), #2 (206–212 aa), #3 (472–478 aa), and #4 (731–737 aa). b Drawing of BANK1–D2–V5 that differs from BANK1–FL by the lack of exon 2, creating a new TRAF6 BM #5. c Drawing of the four TRAF6 BMs in BANK1–FL and their aa sequences. Core aa that were exchanged with alanine to create BANK1 mutants are colored. Peptides used for decoy peptide assays are shown. d Drawing explicitly shows TRAF6 BM #5 in BANK1–Delta2 with core aa P(22), D(24), D(27), and Y(28) in color. The location of peptide BANK1-VI is shown underneath. e Analysis of the binding of BANK1–FL–V5 mutants by CoIP in nonstimulated HEK293 cells. Pull-down was carried out with an anti-Myc antibody, and band levels for Myc–TRAF6 were equalized by ImageJ. The figure is from a single experiment that is representative of at least ten independent experiments. Densitometric measurements were performed. Signals of bands from lysates of BANK1–V5 proteins and Myc–TRAF6 were normalized by using β-actin as a housekeeping protein. From those normalized V5/Myc signals, lane normalization factors were calculated to remove variations in transfection efficiencies among samples. The factors were used to normalize signals from CoIP bands for V5 and Myc. Fold changes in BANK1 interaction relative to TRAF6 were calculated. Interaction of BANK1–WT–V5 with Myc–TRAF6 was used as a control. See also Supplementary Fig. S8A for a graphic presentation of the results and Table S2 in the Excel file for statistical analyses. f Analyses of CoIP reactions of BANK1–D2–V5 mutants with Myc–TRAF6 were performed as described for BANK1–FL in nonstimulated HEK293 cells. See also Supplementary Fig. S8B for a graphic presentation of the results and Table S3 in the Excel file for statistical analyses. g Table summarizes the results from decoy peptide experiments. Nonstimulated HEK293 cells were transiently transfected with 1 µg Myc–TRAF6 and 4 µg BANK1–FL/D2–V5, harvested, and subjected to pull-down with an anti-Myc antibody, and the cleared lysates were incubated either without any peptide added (0 mM) or with 0.01 mM, 0.1 mM, 1 mM, 10 mM, and 100 mM peptide. For BANK1–FL, peptides BANK1-I to -V were tested, while for BANK1-D2, peptide BANK1-VI was tested. Peptide IRAK3A was applied as a negative control, while peptide IRAK3 was used as a positive control for the BANK1–V5:Myc–TRAF6 interaction. Experiments were performed for each concentration at least three times. Western blot bands of CoIP reactions were measured by ImageJ and BANK1–V5:Myc–TRAF6 ratios were calculated. The results are shown as the means of these ratios and their significance. See also Supplementary Tables S4 and S5 in the Excel file for statistical analyses. The Wilcoxon signed-rank test was used for statistical analyses of BANK1 mutants with p < 0.12 (ns), *p < 0.033, **p < 0.002, and ***p < .001 and the unpaired Mann–Whitney t-test for decoy peptides with p < 0.1234 (ns), *p < 0.0332, **p < 0.0021, ***p < 0.0002, and ****p < 0.0001. ns, not significant
Fig. 4
Fig. 4
Functional analyses of BANK1 proteins. a Protein stability of BANK1–FL, BANK1–D2, and BANK1–40C was studied in nonstimulated U2OS cells by treating cells with 100 µg/ml cycloheximide (CHX) for a time frame of 12 h. β-Actin was used as a housekeeping protein to normalize samples by ImageJ. See also Supplementary Fig. S10. b K63-linked polyubiquitination of BANK1–FL and -D2 and BANK1–40C was tested in nonstimulated HepG2 cells and in cells stimulated O/N with 2 µM ODN 2006 and 8 µg/ml R837. Pull-downs were performed with an anti-HA antibody O/N at 4 °C, and eluates of immunoprecipitates were run on a western blot and interrogated with an anti-BANK1 antibody. c Proinflammatory IL-8 cytokine production was measured in supernatants derived from HepG2 cells transfected with 0.1 µg Myc–TRAF6 only and with 0.1 µg Myc–TRAF6 together with 0.4 µg BANK1–FL–V5, -D2–V5, and -40C–V5 and treated for 72 h with R837 and ODN 2006. The results are shown as the mean fold changes in IL-8 production relative to BANK1–FL from three independent experiments. The results are presented in bars for mock (black), R837-stimulated (dark gray) and ODN 2006-stimulated (light gray) HepG2 cells. Samples are categorized as TIR domain-dependent and BANK1 point mutants. See also Supplementary Fig. S11 for transient transfection efficiency in HepG2 cells and Table S6 in the Excel file for statistical analyses. Two-way ANOVA was applied with p < 0.12 (ns), *p < 0.033, **p < 0.002, and ***p < 0.001. ns, not significant

Similar articles

Cited by

References

    1. Teruel M, Alarcón-Riquelme ME. The genetic basis of systemic lupus erythematosus:what are the risk factors and what have we learned. J. Autoimmun. 2016;74:161–175. - PubMed
    1. Ramos-Casals M, Sanz I, Bosch X, Stone JH, Khamashta MA. B-cell-depleting therapy in systemic lupus erythematosus. Am. J. Med. 2012;125:327–336. - PMC - PubMed
    1. Crampton SP, Morawski PA, Bolland S. Linking susceptibility genes and pathogenesis mechanisms using mouse models of systemic lupus erythematosus. Dis. Model Mech. 2014;7:1033–1046. - PMC - PubMed
    1. Lee H-S, Bae S-C. What can we learn from genetic studies of systemic lupus erythematosus? Implications of genetic heterogeneity among populations in SLE. Lupus. 2010;19:1452–1459. - PubMed
    1. Taylor KE, et al. Risk alleles for systemic lupus erythematosus in a large case-control collection and associations with clinical subphenotypes. PLoS Genet. 2011;7:e1001311. - PMC - PubMed

Publication types

MeSH terms