. 2019 Jul;571(7766):510-514.
doi: 10.1038/s41586-019-1341-x. Epub 2019 Jun 26.

Developmental dynamics of lncRNAs across mammalian organs and species

Affiliations

Developmental dynamics of lncRNAs across mammalian organs and species

Ioannis Sarropoulos et al. Nature. 2019 Jul.

Abstract

Although many long noncoding RNAs (lncRNAs) have been identified in human and other mammalian genomes, there has been limited systematic functional characterization of these elements. In particular, the contribution of lncRNAs to organ development remains largely unexplored. Here we analyse the expression patterns of lncRNAs across developmental time points in seven major organs, from early organogenesis to adulthood, in seven species (human, rhesus macaque, mouse, rat, rabbit, opossum and chicken). Our analyses identified approximately 15,000 to 35,000 candidate lncRNAs in each species, most of which show species specificity. We characterized the expression patterns of lncRNAs across developmental stages, and found many with dynamic expression patterns across time that show signatures of enrichment for functionality. During development, there is a transition from broadly expressed and conserved lncRNAs towards an increasing number of lineage- and organ-specific lncRNAs. Our study provides a resource of candidate lncRNAs and their patterns of expression and evolutionary conservation across mammalian organ development.


Conflict of interest statement

Competing interests

The authors declare no competing financial interests.

Figures

Extended Data Figure 1
Extended Data Figure 1. Annotation and orthology assignment of lncRNAs.
a, Schematic representation of the lncRNA annotation pipeline. b, Schematic representation of the pipeline for the detection of 1:1 lncRNA families.
Extended Data Figure 2
Extended Data Figure 2. Genomic classification and expression patterns of lncRNAs.
a, Distribution of lncRNAs among genomic classes in each species. b, Comparison of genomic classes (left), evolutionary age (middle) and organ of maximum expression (right) for known (Ensembl19) and newly annotated (novel) human lncRNAs. c, Number of species with a detected lncRNA member for human families of various evolutionary ages. d, Comparison of the fraction of species with a detected lncRNA member for human families conserved across mammals (180 Mya) and amniotes (300 Mya) with a previous study. e, Fraction of lncRNAs and protein-coding gene orthologs found in conserved synteny with at least one protein-coding gene neighbor for increasing evolutionary distances. f, Organ of maximum expression for expressed lncRNAs (≥ 1 RPKM) in each species. g, Number of lncRNAs expressed (≥ 1 RPKM) in each species during the development of each organ (in logarithmic scale).
Extended Data Figure 3
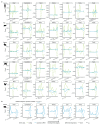
Extended Data Figure 3. Features of developmentally dynamic lncRNA expression.
a, Representative examples of human developmentally dynamic (n=5,887) and non-dynamic (n=25,791) lncRNAs’ expression profiles (mean expression; vertical bars represent the minimum and maximum values across replicates) for varying levels of maximum expression, replicate reproducibility and expression windows. The vertical dashed line represents birth; the horizontal dashed line marks 1 RPKM. b, Summary statistics for the lncRNAs and protein-coding genes in this study. c, Number of organs with developmentally dynamic expression for dynamic lncRNAs and protein-coding genes in each species. d, e, Tissue and median time-specificity of non-dynamic and dynamic lncRNAs, and protein-coding genes, across species. Tissue and time-specificity indexes range from 0 (broad expression) to 1 (specific expression). All comparisons between non-dynamic and dynamic lncRNAs, and protein-coding genes are significant (P = 2.2 x 10⁻¹⁶, two-sided Mann-Whitney U test). f, Maximum expression levels (log10 RPKM) for developmentally dynamic and non-dynamic lncRNAs across species (excluding samples from the sexually mature testis). Developmentally dynamic lncRNAs are more highly expressed in all species (P = 2.2 x 10⁻¹⁶, two-sided Mann-Whitney U test). In d-f, box plots represent median ± 25th and 75th percentiles, whiskers at 1.5 times the interquartile range.
Extended Data Figure 4
Extended Data Figure 4. Functionality signature enrichments of developmentally dynamic lncRNAs.
a, Fraction of developmentally dynamic human lncRNAs (n = 5,887) for different genomic classes. Overrepresented classes were determined by comparing the fraction of dynamic lncRNAs in each class against all other classes. b, Normalized density distribution of the distance to the nearest protein-coding gene for dynamic (n = 5,887) and non-dynamic (n = 25,791) human lncRNAs. c, Generation of expression-matched dynamic (n = 2,906) and non-dynamic lncRNAs (n = 3,098) and their distribution among genomic classes. d, Fraction of developmentally dynamic human lncRNAs among isoforms with an increasing number of exons. The number of exons is significantly higher for developmentally dynamic lncRNAs (P = 2.2 x 10⁻¹⁶, two-sided Mann-Whitney U test). e, Fraction of human lncRNAs that are intergenic, developmentally dynamic and that do not overlap enhancers (n = 16,481) among different age groups. f, Fraction of developmentally dynamic genes across expression-matched (n = 6,004) human lncRNAs of different age groups (top) and functionally characterized lncRNAs (bottom). g, Generation of expression-matched, lowly expressed (0.25-0.75 RPKM) dynamic (n = 798) and non-dynamic (n = 717) human lncRNAs and their distribution across different age groups. h, Fraction of developmentally dynamic human lncRNAs (n = 5,887) with or without a mouse (dynamic or not) ortholog (P = 2.2 x 10⁻¹⁶, hypergeometric test). i, Similarity of spatiotemporal expression (Spearman’s correlation coefficient between human and mouse organs/developmental stages) for 1:1 orthologs. j, Expression similarity across matched organs and developmental stages for mouse and rat 1:1 orthologous lncRNAs that are dynamic in both species, for different evolutionary ages. k, Fraction of lncRNAs present in the CRISPRi screen library resulting in a significant growth phenotype (hits) in at least one cell line for lncRNAs present (n = 2,364) or absent (n = 14,037) in our annotation and dynamic (n = 1,093) or non-dynamic (n = 1,277). l, Fraction of lncRNAs present in the CRISPRi screen library resulting in a significant growth phenotype (hits) in expression-matched dynamic (n = 2,906) and non-dynamic lncRNAs (n = 3,098). In c, g, h-j and l, box plots represent median ± 25th and 75th percentiles, whiskers at 1.5 times the interquartile range. In a-l, statistical tests are two-sided.
Extended Data Figure 5
Extended Data Figure 5. Transcriptional regulation of dynamic lncRNAs in mouse.
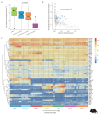
a, Fraction of promoters of protein-coding genes, dynamic and non-dynamic lncRNAs, and size-matched random intergenic regions that overlap with binding sites for TFs. Each data point corresponds to a TF (n = 355). Box plots represent median ± 25th and 75th percentiles, whiskers at 1.5 times the interquartile range. b, Selection of the 50 TFs with the highest binding variability across promoters of lncRNAs dynamic in different organs (in blue). TFs with maximum binding frequency ≤ 0.05 (red line) were not considered, as their high variability is likely associated with a low binding frequency. c, Spatiotemporal expression patterns of the 50 most variable TFs in mouse. The heatmap is clustered by rows and shows expression levels in counts (after variance-stabilizing transformation).
Extended Data Figure 6
Extended Data Figure 6. Patterns of lncRNA expression in mammalian development.
a, Number of differentially expressed protein-coding genes and dynamic lncRNAs between adjacent stages of organ development in human, rat, rabbit, opossum and chicken. b, Number of differentially expressed ‘isolated intergenic’ (> 100 kb from the closest protein-coding-gene) dynamic lncRNAs between adjacent stages during mouse development.
Extended Data Figure 7
Extended Data Figure 7. Clustering of dynamic lncRNAs based on developmental trajectories.
Clusters of developmentally dynamic lncRNAs and protein-coding genes across mouse organs (brain = 14,629 genes; cerebellum = 13,166; heart = 12,382; kidney = 14,634; liver = 13,888; ovary = 12,694; testis = 13,749). Gray lines represent individual gene trajectories and solid lines posterior mean trajectories for each cluster. Clusters are arranged by decreasing fraction of lncRNAs. Enriched representative biological processes (Benjamini-Hochberg adjusted P < 0.05, hypergeometric test) are shown for each cluster.
Extended Data Figure 8
Extended Data Figure 8. Characteristics of dynamic lncRNAs expressed in different developmental stages.
a, Expression similarity between human and mouse 1:1 orthologous protein-coding genes (n = 16,078), developmentally dynamic (n = 281) and non-dynamic (n = 1,386) lncRNAs across organs/developmental stages. Each point corresponds to the Spearman’s correlation coefficient of expression between human and mouse orthologs for matching samples. Lines and the 95% confidence interval (shaded regions) correspond to linear model predictions. Spearman’s correlation coefficients between expression similarity and developmental stage are given for each comparison (*P < 0.05, **P < 0.01, ***P < 0.001). b, Expression similarity between dynamic human and mouse orthologous lncRNAs from a, summarized by organ (*P < 0.05, **P < 0.01, ***P < 0.001, two-sided Mann-Whitney U test). c, Fraction of conserved (≥ 80 Mya) dynamic lncRNAs expressed in each mouse organ during development (*P < 0.05, **P < 0.01, ***P < 0.001, two-sided Mann-Whitney U test; the color signifies the focal organ for each comparison). d, Tissue-specificity for mouse lncRNAs with different developmental trajectories. e, Fraction of human lncRNAs with different developmental trajectories among functionally characterized lncRNAs (n = 59) and f, CRISPRi growth screen hits (n = 98). g, Fraction of late-expressed dynamic (n = 2,956) and non-dynamic lncRNAs (n = 25,791) for different age groups and functionally characterized human lncRNAs. In b-d, box plots represent median ± 25th and 75th percentiles, whiskers at 1.5 times the interquartile range. In a-g, the statistical tests are two-sided.
Extended Data Figure 9
Extended Data Figure 9. Co-expression of dynamic lncRNAs with adjacent protein-coding genes.
a, Normalized density distribution of Pearson’s correlation coefficients (r) of spatiotemporal gene expression between adjacent paralogous (human = 267; mouse = 263) and non-paralogous (human = 3,359; mouse = 3,382) mRNA-mRNA pairs. b, Number of paralogous (human = 267; mouse = 263) and non-paralogous (human = 3,359; mouse = 3,382) adjacent mRNA-mRNA pairs detected as co-expressed above a range of Pearson’s r cutoffs. c, Relationship between distance and Pearson’s correlation of expression for lncRNA-mRNA (human = 4,881; mouse = 4,722) and mRNA-mRNA (human = 3,359; mouse = 3,382) pairs. Lines were estimated through loess regression and the 95% confidence interval is shown in gray. d, Distribution of Pearson’s r for lncRNA-mRNA and mRNA-mRNA pairs across different distance intervals. Box plots represent median ± 25th and 75th percentiles, whiskers at 1.5 times the interquartile range. e, Density distributions of Pearson’s r between a protein-coding gene and its nearest dynamic lncRNA (human=2,440; mouse=2,549) and protein-coding gene (human=1,606; mouse=1,777) after excluding antisense and divergently transcribed lncRNAs. f, Enriched biological processes among human protein-coding genes with significantly higher expression correlations with their adjacent dynamic lncRNA than with the control protein-coding gene (n=358; Benjamini-Hochberg adjusted P < 0.01, hypergeometric test; data for mouse in Fig. 4b). In a-f, statistical tests are two-sided.
Figure 1
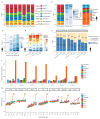
Figure 1. lncRNAs expressed during mammalian organ development.
a, Schematic representation of the dataset. b, Phylogenetic distribution of 1:1 orthologous lncRNA families (branches) and species-specific lncRNAs (leaves). c, Overlap with Ensembl v92 annotations.
Figure 2
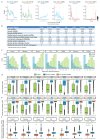
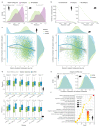
Figure 2. Developmentally dynamic lncRNAs are enriched for functional loci.
a, Number of non-dynamic and dynamic lncRNAs identified in each species. The box plots summarize the variability in the size of the repertoires across species (n = 7). b, Density distribution of transcript length for non-dynamic (n = 25,791) and dynamic human lncRNAs (n = 5,887). c, Fraction of dynamic loci for human lncRNAs of different evolutionary ages (top), functionally characterized lncRNAs and protein-coding genes (bottom; **P < 0.01, ***P < 0.001). d, Similarity of spatiotemporal expression (Spearman’s correlation coefficient between human and mouse organs/developmental stages) for 1:1 orthologs (dynamic lncRNAs = 281, protein-coding genes = 16,078). e, Fraction of a CRISPRi screen library resulting to a significant growth phenotype (“hit”) for non-dynamic (n = 1,277) and dynamic human lncRNAs (n = 1,093). f, Number of TF binding sites overlapping the promoters of protein-coding genes (n = 20,202), dynamic (n = 3,169) and non-dynamic lncRNAs (n = 11,818), and size-matched random intergenic regions (n = 20,202). g, Normalized TF binding frequency (heatmap) of the 50 TFs with the highest binding variability across organs. Rows and columns are hierarchically clustered. The row annotation depicts the organ of maximum expression for organ-specific TFs. In a, d and f, box plots represent median ± 25th and 75th percentiles, whiskers at 1.5 times the interquartile range. In a-f, statistical tests are two-sided.
Figure 3
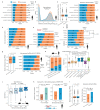
Figure 3. Patterns of dynamic lncRNA expression.
a, Number of differentially expressed (DE) protein-coding genes and dynamic lncRNAs between adjacent developmental stages (additional species in Extended Data Fig. 6a). b, Number of dynamic lncRNAs (n = 5,622) expressed and c, fraction of those conserved (evolutionary age ≥ 80 million years), during mouse organ development. Lines estimated through loess regression; 95% confidence interval shown in gray. d, Tissue-specificity of lncRNAs with different developmental trajectories. Box plots represent median ± 25th and 75th percentiles, whiskers at 1.5 times the interquartile range. e, Proportions of lncRNAs with different developmental trajectories among functionally characterized lncRNAs (n = 59) and f, CRISPRi growth screen hits (n = 98). Data for the remaining organs in Extended Data Fig. 8. In c-e, statistical tests are two-sided.
Figure 4
Figure 4. Co-expression with adjacent protein-coding genes.
a, Density distributions of the Pearson correlation coefficients between a protein-coding gene and its nearest dynamic lncRNA (n = 4,722) and protein-coding gene (control; n = 3,382). b, Enriched biological processes among protein-coding genes with significantly higher expression correlation with their adjacent dynamic lncRNA than with the control protein-coding gene (n = 449; Benjamini-Hochberg adjusted P < 0.01, hypergeometric test). c, Fraction of positionally-conserved lncRNAs (pcRNAs) among all lncRNAs (n = 31,678), developmentally dynamic lncRNAs (n = 5,887) and lncRNAs co-expressed with their adjacent protein-coding genes (n = 411). d, Overlap between human and mouse protein-coding genes that have a significantly higher expression correlation (Pearson’s r) with their adjacent dynamic lncRNA than with the control protein-coding gene. In a-c, statistical tests are two-sided.

References

    1. Cabili M, et al. Integrative annotation of human large intergenic noncoding RNAs reveals global properties and specific subclasses. Genes Dev. 2011;25:1915–1927. - PMC - PubMed
    1. Derrien T, et al. The GENCODE v7 catalog of human long noncoding RNAs: Analysis of their gene structure, evolution, and expression. Genome Res. 2012;22:1775–1789. - PMC - PubMed
    1. Iyer MK, et al. The landscape of long noncoding RNAs in the human transcriptome. Nat Genet. 2015;47:199–208. - PMC - PubMed
    1. Hon CC, et al. An atlas of human long non-coding RNAs with accurate 5′ ends. Nature. 2017;543:199–204. - PMC - PubMed
    1. Carninci P, et al. The Transcriptional Landscape of the Mammalian Genome. Science (80-. ) 2005;309:1559–1563. - PubMed

Publication types