Comparative Study
. 2019 Jul;571(7766):505-509.
doi: 10.1038/s41586-019-1338-5. Epub 2019 Jun 26.

Gene expression across mammalian organ development

Affiliations
Comparative Study

Gene expression across mammalian organ development

Margarida Cardoso-Moreira et al. Nature. 2019 Jul.

Abstract

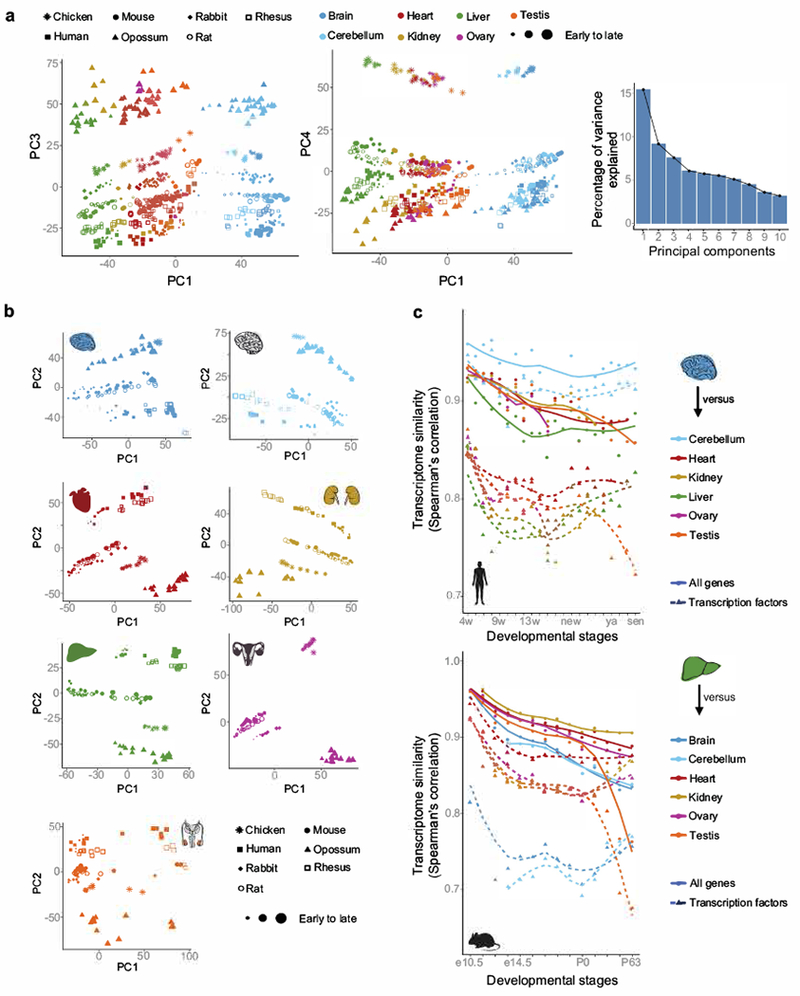
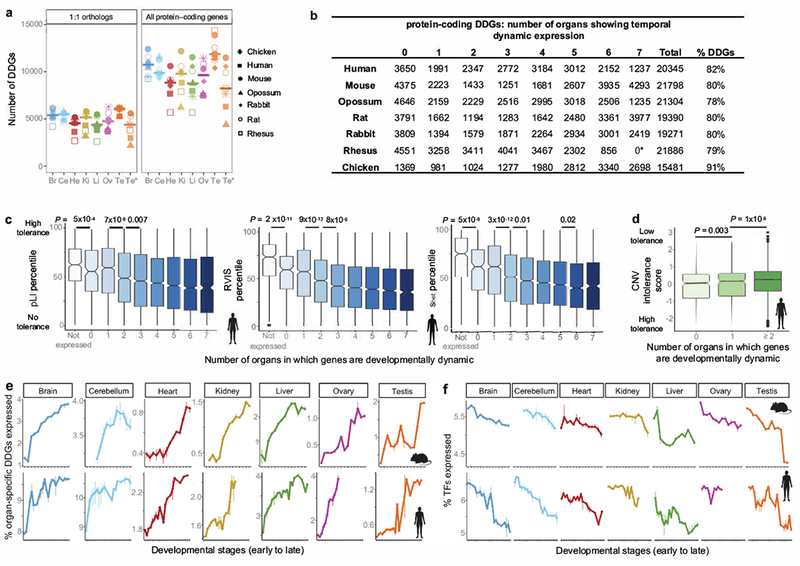
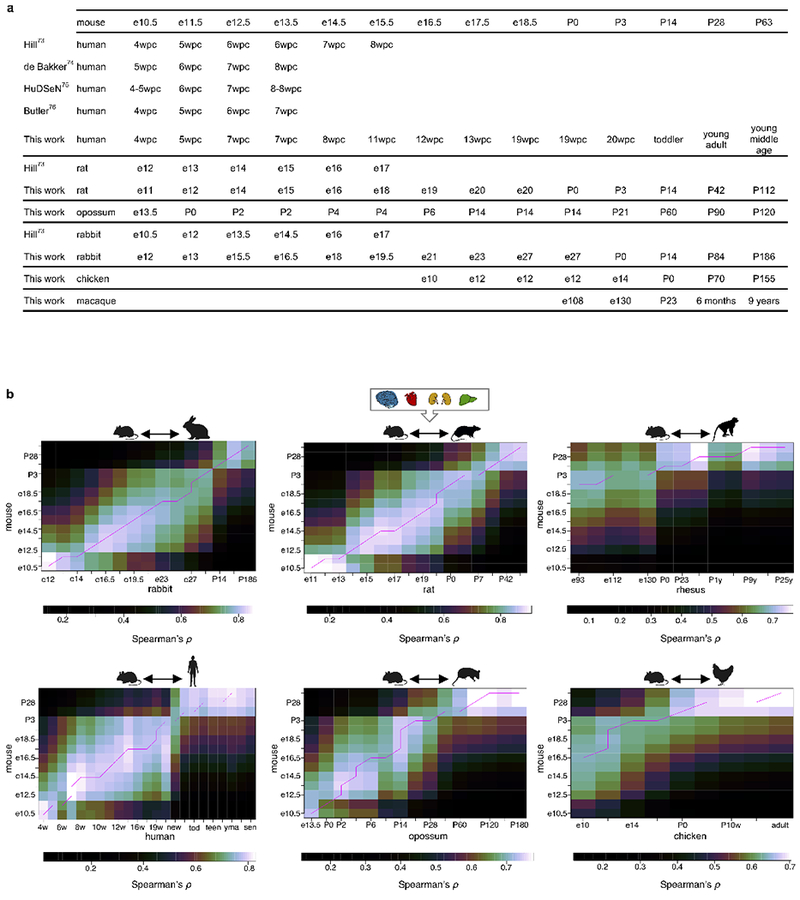
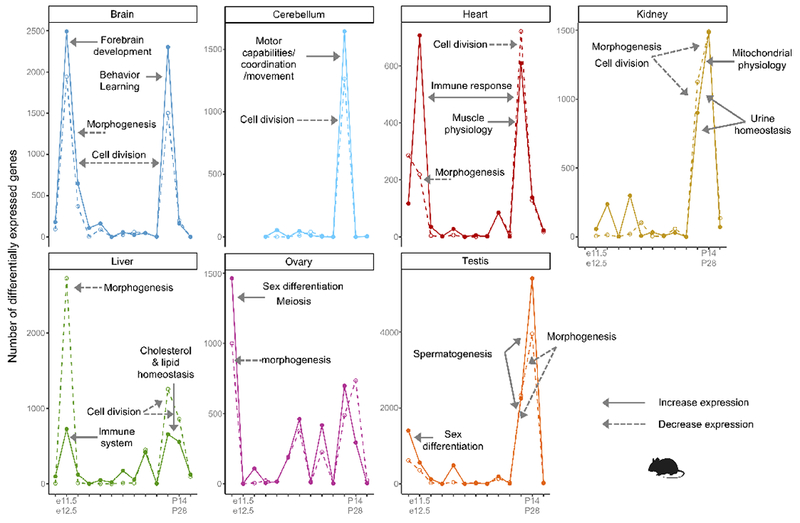
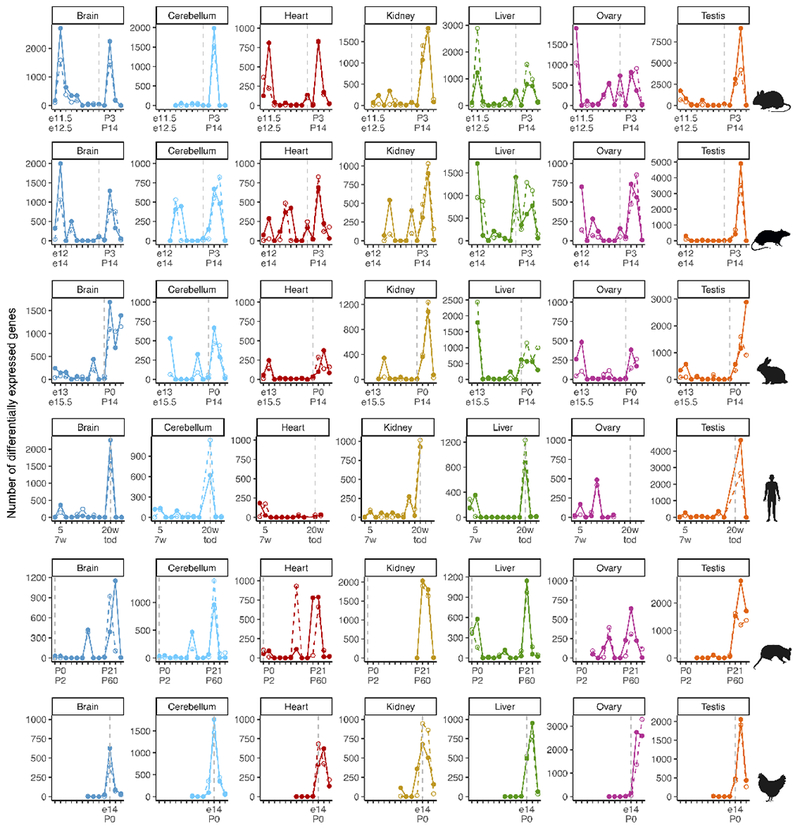
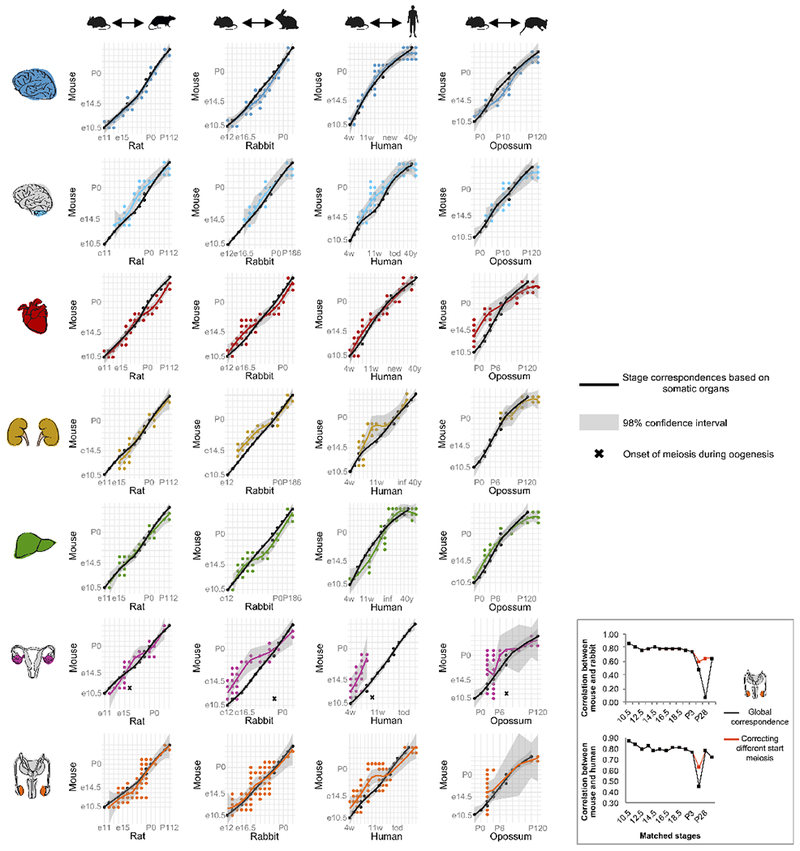
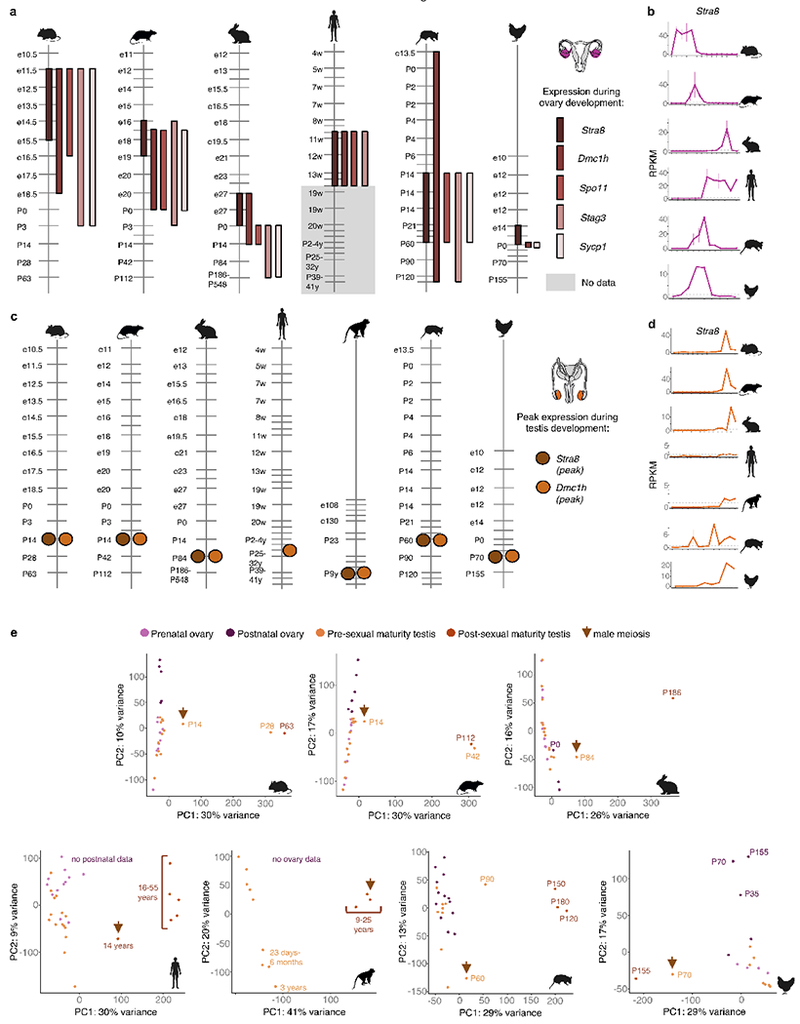
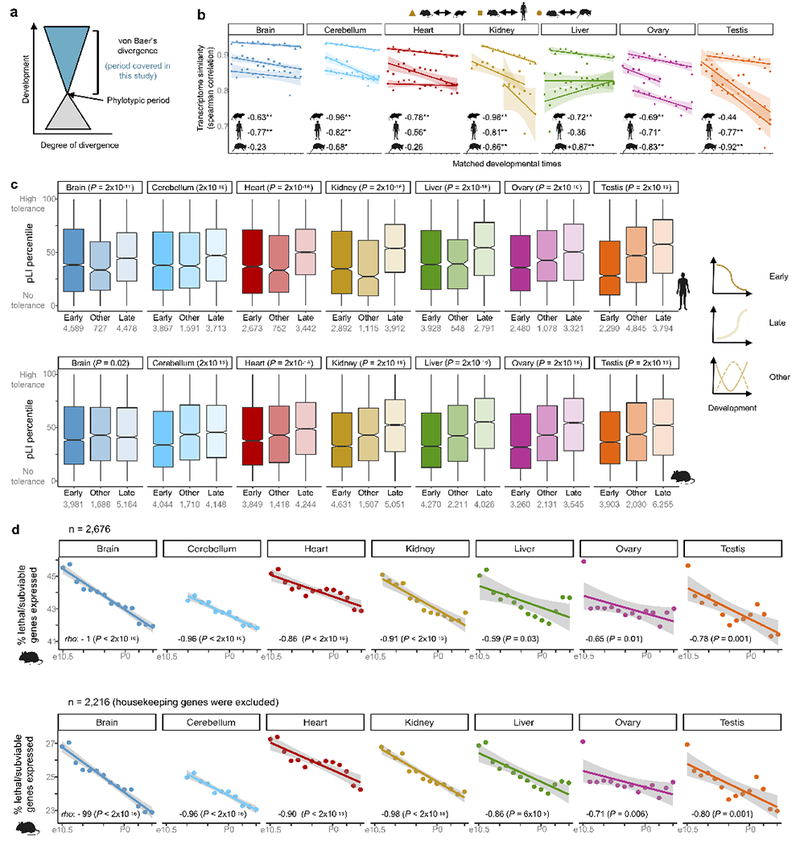
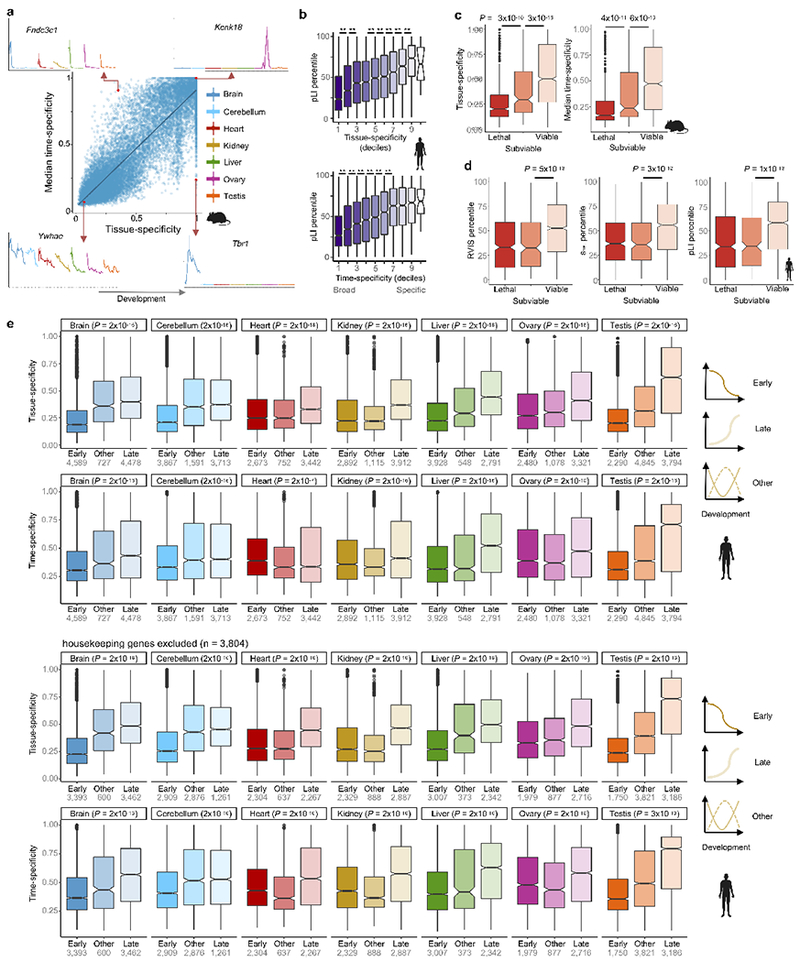
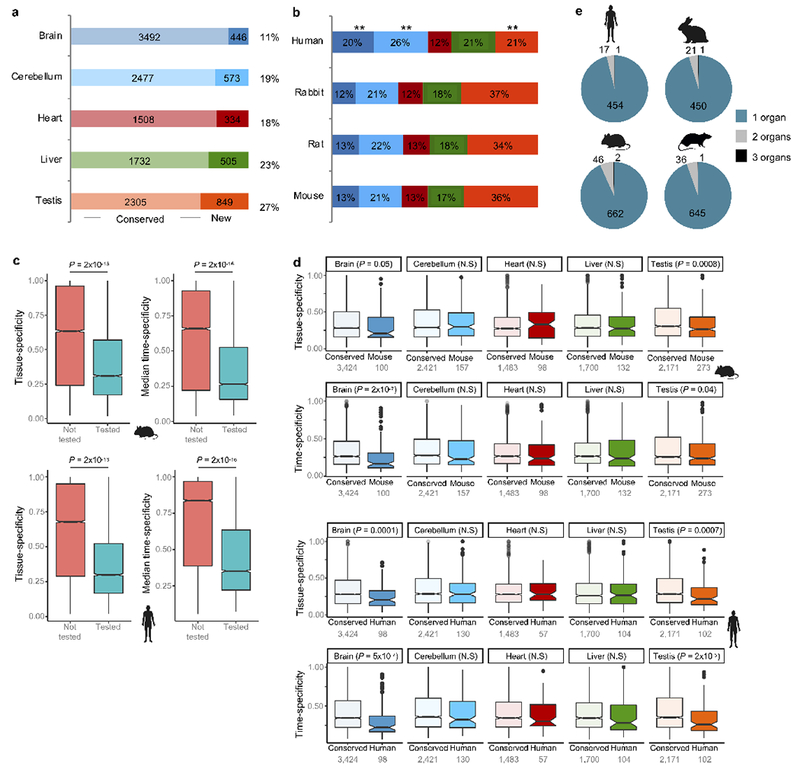
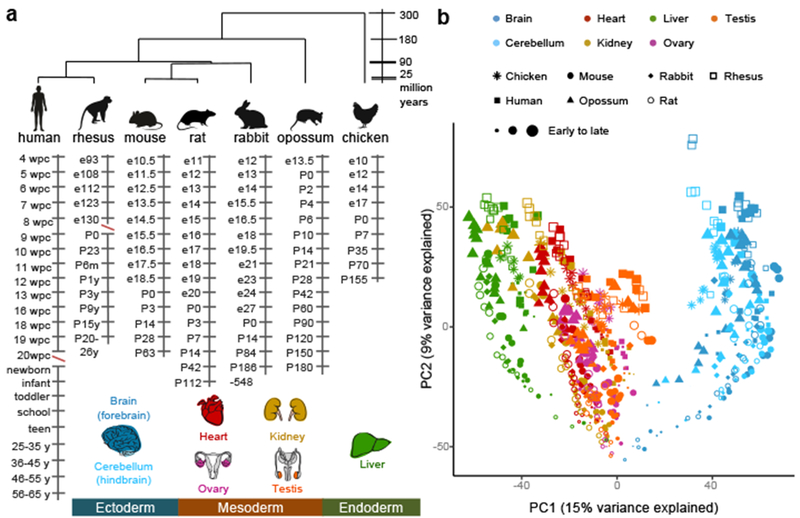
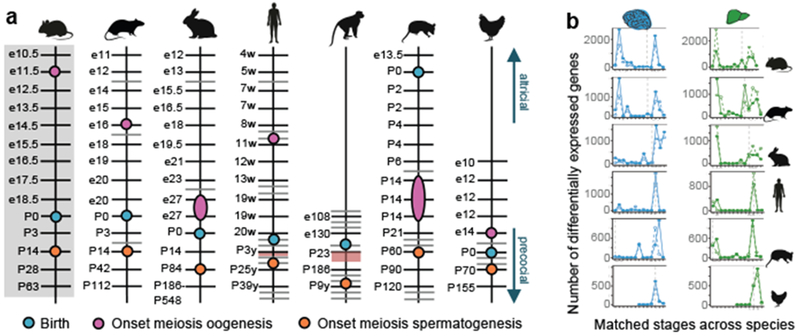
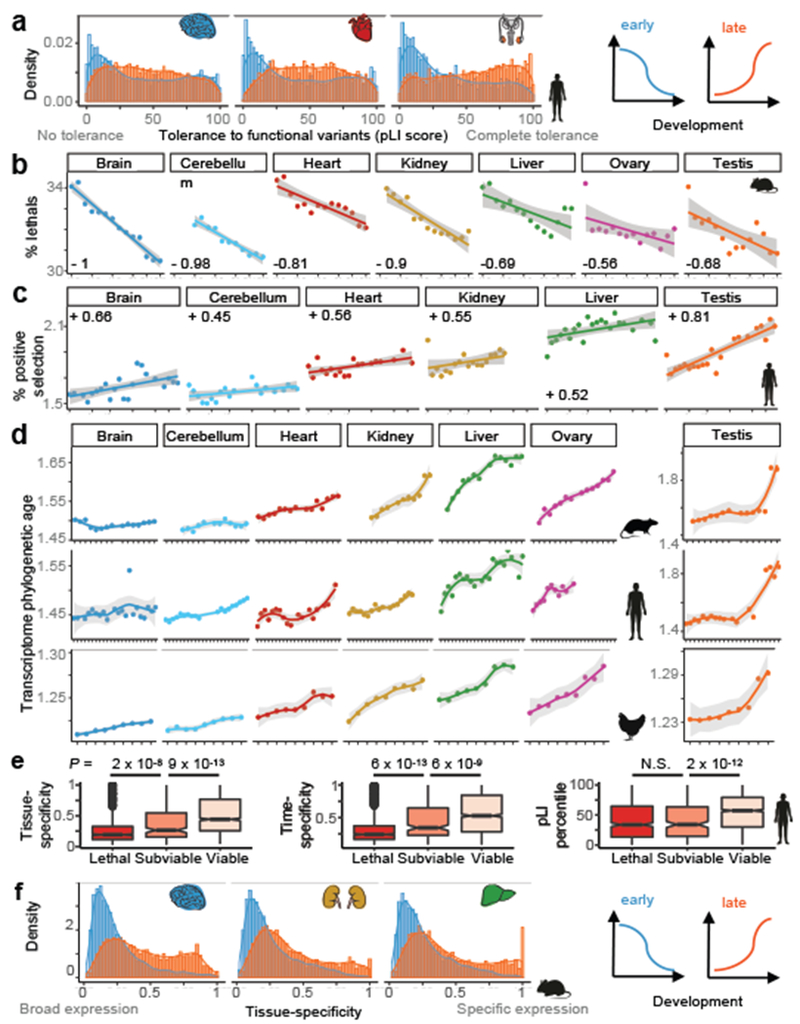
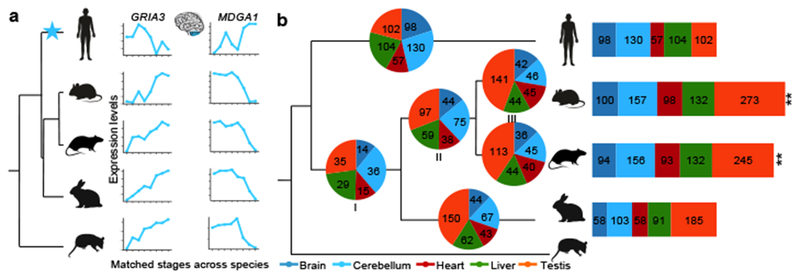
The evolution of gene expression in mammalian organ development remains largely uncharacterized. Here we report the transcriptomes of seven organs (cerebrum, cerebellum, heart, kidney, liver, ovary and testis) across developmental time points from early organogenesis to adulthood for human, rhesus macaque, mouse, rat, rabbit, opossum and chicken. Comparisons of gene expression patterns identified correspondences of developmental stages across species, and differences in the timing of key events during the development of the gonads. We found that the breadth of gene expression and the extent of purifying selection gradually decrease during development, whereas the amount of positive selection and expression of new genes increase. We identified differences in the temporal trajectories of expression of individual genes across species, with brain tissues showing the smallest percentage of trajectory changes, and the liver and testis showing the largest. Our work provides a resource of developmental transcriptomes of seven organs across seven species, and comparative analyses that characterize the development and evolution of mammalian organs.


Conflict of interest statement

Competing interests

The authors declare no competing financial interests.

Figures

Extended Data Figure 1 |
Extended Data Figure 1 |. Organ developmental transcriptomes.
a, PC3 and PC4 of the PCA based on 7,696 1:1 orthologs depicted in Fig. 1b (each dot represents the median across replicates), and scree plot describing the amount of variance explained by the first 10 PCs. b, PCAs of individual organs (n = 7,696 1:1 orthologs). c, Correlation of expression levels throughout development between (top) human brain and the other organs (20,345 genes), (bottom) mouse liver and the other organs (21,798 genes). Similar patterns were observed using other organs as the focal organ, and species. For human, the prenatal data are in weeks (w) and postnatally ‘new’ means newborn, ‘sch’ school age (7-9 years), ‘ya’ young adult (25-32 years) and ‘sen’ senior (58-63 years).
Extended Data Figure 2 |
Extended Data Figure 2 |. DDGs.
a, Number of DDGs identified in each organ and species using (left) the set of 7,696 1:1 orthologs and (right) the set of all protein-coding genes in each species. The horizontal bar depicts the median. Br: Brain, Cr: Cerebellum, He: Heart, Ki: Kidney, Li: Liver, Ov: Ovary, Te: Testis, Te*: Testis pre-sexual maturity. b, Number of DDGs per species, including number of organs where they show dynamic expression. *In rhesus ovary development is not covered, hence there are only 6 organs in total. c, Relationship between the number of organs in which genes show dynamic expression and the tolerance to functional variants as measured by: the probability of being loss-of-function intolerant (pLI score), the residual variation intolerance score (RVIS) and selection against heterozygous loss-of-function (shet score) (n = 13,160 genes; Wilcoxon rank sum test, two-sided). d, Relationship between the number of organs in which genes show dynamic expression and intolerance to duplication and deletion variants (CNV intolerance score; n = 15,728 genes; Wilcoxon rank sum test, two-sided). e, Percentage of organ-specific expressed DDGs at each developmental stage. Bars indicate the range between the replicates. For the brain tissues, DDGs are organ-specific in brain and/or cerebellum. Time-points on the x-axis described in Fig. 1a. f, Percentage of TFs expressed at each developmental stage. Bars indicate the range between the replicates. Time-points on the x-axis described in Fig. 1a. In c-d, box plots depict median ± 25th and 75th percentiles, whiskers at 1.5 times the interquartile range.
Extended Data Figure 3 |
Extended Data Figure 3 |. Developmental correspondences across species.
a, Developmental stage correspondences established in this study and correspondences based on the Carnegie staging (when available). b, Using mouse as a reference, a dynamic time warping algorithm was used to select the best alignment (pink line) between the time series based on stage transcriptome correlations combining all somatic organs (n = 8,940 genes/organ combinations). In the human correspondence, “new” means newborn, “tod” toddler (2-4 years), “teen” teenager (13-19 years), “yma” young middle age (39-41 years), “sen” senior (58-63 years).
Extended Data Figure 4 |
Extended Data Figure 4 |. Periods of greater transcriptional change in mouse.
Number of genes differentially expressed between adjacent stages in each organ (log2 fold change ≥ 0.5). Solid lines refer to genes that increase in expression and dashed lines to genes that decrease. The biological processes and phenotypes enriched at the peaks of differential expression are detailed in Supplementary Table 13.
Extended Data Figure 5 |
Extended Data Figure 5 |. Periods of greater transcriptional change across species.
Number of genes differentially expressed between adjacent, species-matched, stages for each organ (log2 fold change ≥ 0.5). Solid lines refer to genes that increase in expression and dashed lines to genes that decrease. The vertical dotted line marks birth.
Extended Data Figure 6 |
Extended Data Figure 6 |. Organ-specific stage correspondences.
Comparison of the global stage correspondences (based on the combined expression of somatic organs; n = 8,940 genes/organ combinations; black line) with organ-specific correspondences (based on 2,727 genes for brain, 2,146 for cerebellum, 1,276 for heart, 1,486 for kidney, 1,305 for liver, 1,298 for ovary, and 2,153 for testis; colored lines). With the exception of early heart development in opossum and early ovary development in rabbit and human, the global correspondences are within the 98% confidence interval for predictions computed by the loess function (local polynomial regression) for each of the organ-specific correspondences (shaded grey area). The same applies to all organs in mouse-chicken and mouse-rhesus comparisons (data not shown). The inset on the bottom right, shows the Spearman correlation between mouse and rabbit (top) and mouse and human (bottom) for testis transcriptomes using the global stage correspondences (black line) or adjusting for the different start of meiosis across species (orange line; i.e. matching a P14 mouse with a young teenager in human and a P84 rabbit).
Extended Data Figure 7 |
Extended Data Figure 7 |. Heterochronies in gonadal development.
a, Temporal dynamics of meiotic genes during ovary development. SYCP1 is not expressed in human ovary. The genes SPO11 and STAG3 are not present in the chicken gene annotations used in this work. b, Expression of Stra8 during ovary development. The vertical bars show the range between the replicates and the horizontal dashed line marks 1 RPKM. c, Temporal dynamics of meiotic genes during testis development. The profiles of Stra8 and Dmc1 are represented not by their range of expression but by their highest peak of expression. In rhesus, meiosis is known to start around 3-4 years; our data suggest it had not yet started in the 3-year-old individuals examined. STRA8 is lowly expressed in the human testis. d, Expression of Stra8 during testis development. The vertical bars show the range between the replicates and the horizontal dashed line marks 1 RPKM. e, PCA of ovary and testis development for each species (n = 21,798 protein-coding genes in mouse, 19,390 in rat, 19,271 in rabbit, 20,345 in human, 21,886 in rhesus and 15,481 in chicken).
Extended Data Figure 8 |
Extended Data Figure 8 |. Relationships between evolution and development.
a, Observed relationship between evolution and development. Divergence (horizontal distance) can be morphological or molecular. b, Transcriptome similarity between three species-pairs throughout development (matched stages) using 11,439 1:1 orthologs. Similar trends were obtained using all species-pairs. The weighted average Spearman correlation coefficients are −0.81 (P = 1 × 10⁻¹²) for the mouse-rat comparison, −0.69 (P = 2 × 10⁻¹¹) for mouse-human and −0.42 (P = 0.0004) for mouse-opossum. At the bottom are the Spearman correlations between transcriptome correlation coefficients and matched developmental time for each organ and species-pair (**P < 0.02, *P < 0.05). Lines were estimated through linear regression and the 95% confidence interval is shown in grey. c, Tolerance to loss-of-function variants (pLI score) for genes with different developmental trajectories in human (top) and mouse (bottom). Lower values mean less tolerance. The pLI scores used for mouse genes are from their human orthologs. The P-values refer to early vs. late comparisons, Wilcoxon rank sum test, two-sided. Box plots depict the median ± 25th and 75th percentiles, whiskers at 1.5 times the interquartile range. d, Percentage of lethal and subviable genes expressed throughout development among a set of 2,686 neutrally ascertained mouse knockouts (top) and the same after excluding housekeeping genes (bottom). Spearman correlations at the bottom of each plot. Lines were estimated through linear regression and the 95% confidence interval is shown in grey.
Extended Data Figure 9 |
Extended Data Figure 9 |. Pleiotropy as a determinant of the evolution of development.
a, Relationship between tissue- and time-specificity. Gene developmental profiles illustrate the extremes of the indexes, which range from 0 (broad time/spatial expression) to 1 (specific time/spatial expression). In the gene plots, the x-axis shows the samples ordered by stage and organ and the y-axis shows expression levels. b, Functional constraints (measured by pLI) decrease with increasing time- and tissue-specificity (n = 9,965 genes). **All P < 0.01, Wilcoxon rank sum test, two-sided. c, Tissue- and time-specificity of mouse genes identified as lethal, subviable, or viable (n = 2,686; Wilcoxon rank sum test, two-sided). d, Levels of functional constraint as measured by RVIS, shet, and pLI scores for the human orthologs of genes identified as lethal, subviable and viable in mouse (n = 2,408; Wilcoxon rank sum test, two-sided). e, Tissue- and time-specificity of genes with different developmental trajectories in human (top) and the same after excluding housekeeping genes (bottom). The P-values refer to early vs. late comparisons, Wilcoxon rank sum test, two-sided. In b-e, the box plots depict the median ± 25th and 75th percentiles, whiskers at 1.5 times the interquartile range.
Extended Data Figure 10 |
Extended Data Figure 10 |. Evolution of developmental trajectories.
a, Number of genes in each organ that evolved new trajectories across the phylogeny. Includes genes that differ between opossum and eutherians, for which the change cannot be polarized because of the lack of an outgroup. b, Distribution of trajectory changes among organs for the different species. The number of genes that changed in each organ is depicted in Fig. 4b. Humans show a relative excess of changes in brain tissues and a relative paucity in testis. **P = 2 × 10⁻⁵ for brain, P = 0.02 for cerebellum and P = 1 × 10⁻¹⁰ for testis (from binomial tests where the probability of success is derived from what is observed in mouse, rat and rabbit). c, Genes tested for trajectory changes (7,020 genes) in mouse (top) and human (bottom) have significantly lower tissue- and time-specificity than genes not tested for trajectory changes (13,325 genes in mouse and 14,778 in human, Wilcox rank sum test, two-sided). d, Genes with trajectory changes in mouse (top) and human (bottom) have similar or lower tissue- and time-specificity than genes with conserved trajectories (Wilcox rank sum test, two-sided, ‘N.S.’ means non-significant). e, Number of organs in which genes evolved new trajectories in the different species. In c-d, the box plots depict the median ± 25th and 75th percentiles, whiskers at 1.5 times the interquartile range.
Figure 1 |
Figure 1 |. Organ developmental transcriptomes.
a, Species, organs, and stages sampled. Red slashes highlight two sampling gaps: human development is not covered between 20 and 38 weeks post-conception (wpc) and rhesus development between embryonic (e) day 130 and e160. b, PCA based on 7,696 1:1 orthologs across all species. Each dot represents the median across replicates (~2-4).
Figure 2 |
Figure 2 |. Developmental correspondences.
a, Stage correspondences across species. Grey bars represent additionally sampled stages. Red shading highlights sampling gaps. In rhesus, male meiosis starts at 3-4 years. Because we did not detect expression of meiotic genes in the 3-year-olds, we placed meiosis’ onset between 3 and 9 years. c, Number of genes differentially expressed between adjacent, species-matched, stages for brain and liver (log2 fold-change ≥ 0.5; other organs in Extended Data Fig. 5). Solid lines mark genes that increase in expression and dashed lines genes that decrease. Vertical dotted line marks birth.
Figure 3 |
Figure 3 |. Relationships between evolution and development.
a, Intolerance to functional mutations (pLI) for human genes whose expression decreases (blue) or increases (orange) during development (4,589/4,478 genes decrease/increase in brain, 2,673/3,442 in heart, and 2,290/3,794 in testis; all P < 10−10, Wilcoxon rank sum test, two-sided). b, Percentage of lethal genes expressed at each stage (out of 2,676 knockouts). Weighted average Spearman correlation coefficient is −0.89 (P = 1 × 10⁻¹²); all organ-specific Spearman correlations are significant (P ≤ 0.04). c, Percentage of positively-selected genes expressed at each stage (out of 13,362 genes tested for positive selection). Ovary excluded due to lack of postnatal data. Weighted average Spearman correlation coefficient is +0.57 (P = 5 × 10⁻¹¹); all organ-specific correlations are significant (P ≤ 0.05). d, Phylogenetic age of organs’ transcriptomes throughout development for rat (n = 18,695 genes), human (n = 18,820) and chicken (n = 15,155). Higher values indicate larger contributions of lineage-specific genes (i.e. younger transcriptomes). Weighted average Spearman correlation coefficients are +0.87 (P = 1 × 10⁻¹²) for rat, +0.77 (P = 1 × 10⁻¹²) for human and +0.96 (P = 1 × 10⁻¹²) for chicken. All Spearman correlations are significant except for rat brain and cerebellum (ρ: +0.53 to +0.99, P: 0.03 to 10−15). Testis plotted separately because of the young age of sexually mature transcriptomes. e, Tissue-specificity, time-specificity (median across organs) and intolerance to functional mutations (pLI) of human orthologs of mouse genes identified as lethal, subviable and viable (n = 2,686; Wilcoxon rank sum test, two sided; ‘N.S.’ means non-significant). Box plots depict the median ± 25th and 75th percentiles, whiskers at 1.5 times the interquartile range. f, Tissue-specificity for mouse genes whose expression decreases (blue) or increases (orange) during development (3,981/5,164 genes decrease/increase in brain, 4,631/5,051 in kidney, and 4,270/4,026 in liver; all P < 10−15, Wilcoxon rank sum test, two-sided). In b-d, the x-axes show samples ordered by stage (Fig. 1a). In b-c, lines were estimated through linear regression; in d through loess. In b-d the 95% confidence interval is shown in grey.
Figure 4 |
Figure 4 |. Evolution of developmental trajectories.
a, Example of two genes that evolved new trajectories in the human cerebellum. GRIA3 is a glutamate receptor associated with mental retardation. MDGA1 encodes a cell surface glycoprotein important for the developing nervous system. b, Pie charts depict the number of genes in each organ that evolved new trajectories in each phylogenetic branch (3,980 genes tested in brain, 3,064 in cerebellum, 1,871 in heart, 2,284 in liver and 3,191 in testis). Bar charts depict the total number of trajectory changes in each species. For mouse, that meant adding the changes that occurred at the base of the glires (I), those shared by mouse and rat (II) and those that are mouse specific (III). **P < 10−10, binomial test.

References

    1. Pantalacci S & Semon M Transcriptomics of Developing Embryos and Organs: A Raising Tool for Evo-Devo. J. Exp. Zool. 00B, 1–9 (2014). - PubMed
    1. Silbereis JC, Pochareddy S, Zhu Y, Li M & Sestan N The Cellular and Molecular Landscapes of the Developing Human Central Nervous System. Neuron 89, 248–268 (2016). - PMC - PubMed
    1. DeFalco T & Capel B Gonad morphogenesis in vertebrates: divergent means to a convergent end. Annu. Rev. Cell. Dev. Biol. 25, 457–482 (2009). - PMC - PubMed
    1. Abzhanov A von Baer’s law for the ages: lost and found principles of developmental evolution. Trends Genet. 29, 712–722 (2013). - PubMed
    1. Kalinka AT & Tomancak P The evolution of early animal embryos: conservation or divergence? Trends Ecol. Evol. 27, 385–393 (2012). - PubMed

Methods references

    1. Bruneau BG Signaling and transcriptional networks in heart development and regeneration. Cold Spring Harb. Perspect. Biol. 5, a008292 (2013). - PMC - PubMed
    1. Carelli FN, Liechti A, Halbert J, Warnefors M & Kaessmann H Repurposing of promoters and enhancers during mammalian evolution. Nat. Commun. 9, 4066 (2018). - PMC - PubMed
    1. Marin R et al. Convergent origination of a Drosophila-like dosage compensation mechanism in a reptile lineage. Genome Res. 27, 1974–1987 (2017). - PMC - PubMed
    1. Wu TD & Nacu S Fast and SNP-tolerant detection of complex variants and splicing in short reads. Bioinformatics 26, 873–881 (2010). - PMC - PubMed
    1. Anders S, Pyl PT & Huber W HTSeq--a Python framework to work with high-throughput sequencing data. Bioinformatics 31, 166–169 (2015). - PMC - PubMed

Publication types