. 2019 Jul;571(7765):408-412.
doi: 10.1038/s41586-019-1318-9. Epub 2019 Jun 26.

FOXA1 mutations alter pioneering activity, differentiation and prostate cancer phenotypes

Affiliations

FOXA1 mutations alter pioneering activity, differentiation and prostate cancer phenotypes

Elizabeth J Adams et al. Nature. 2019 Jul.

Erratum in

Abstract

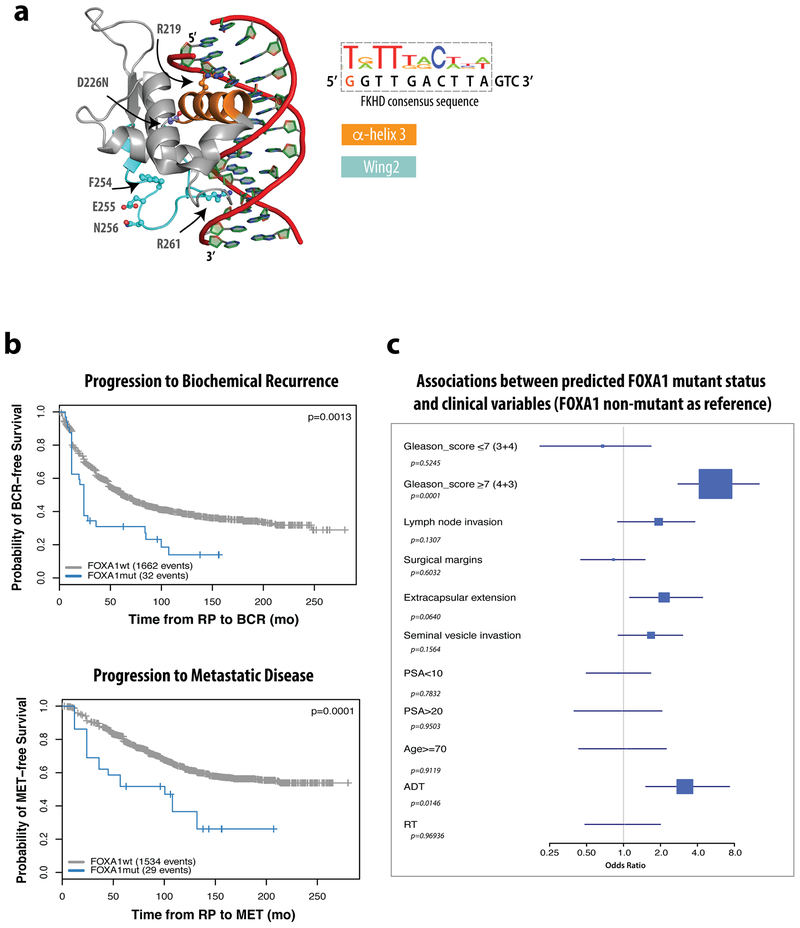
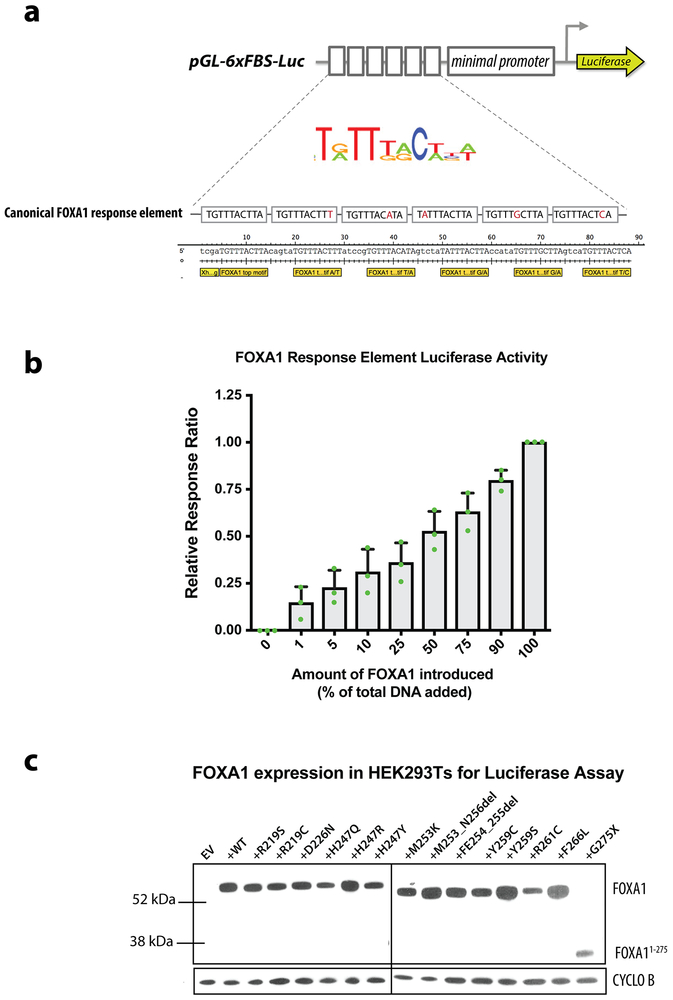
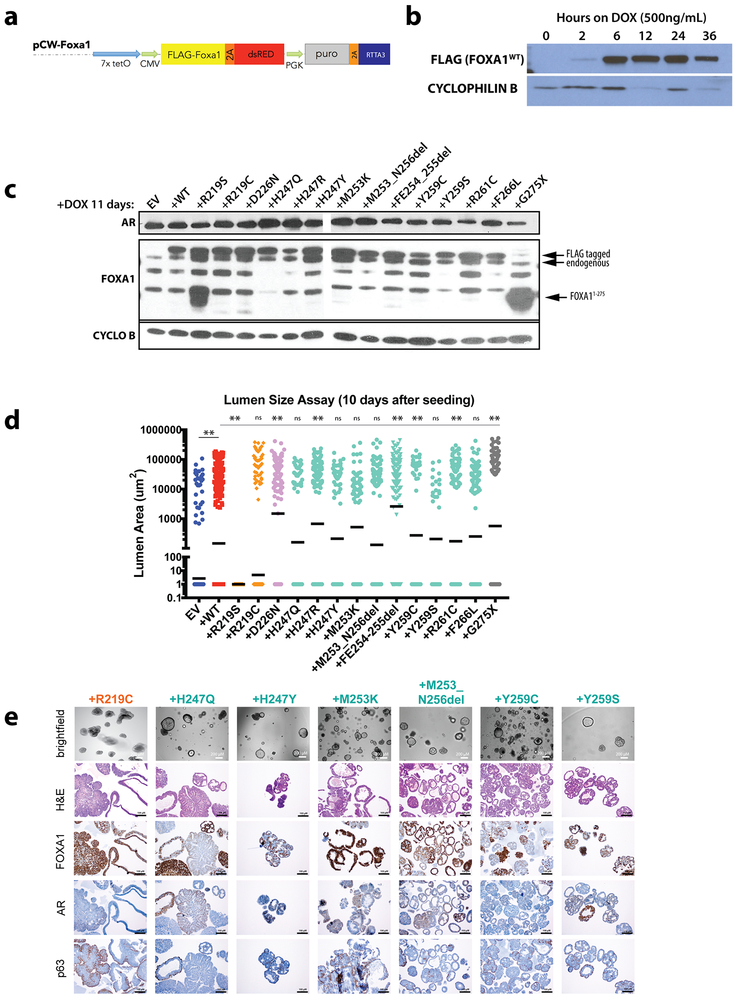
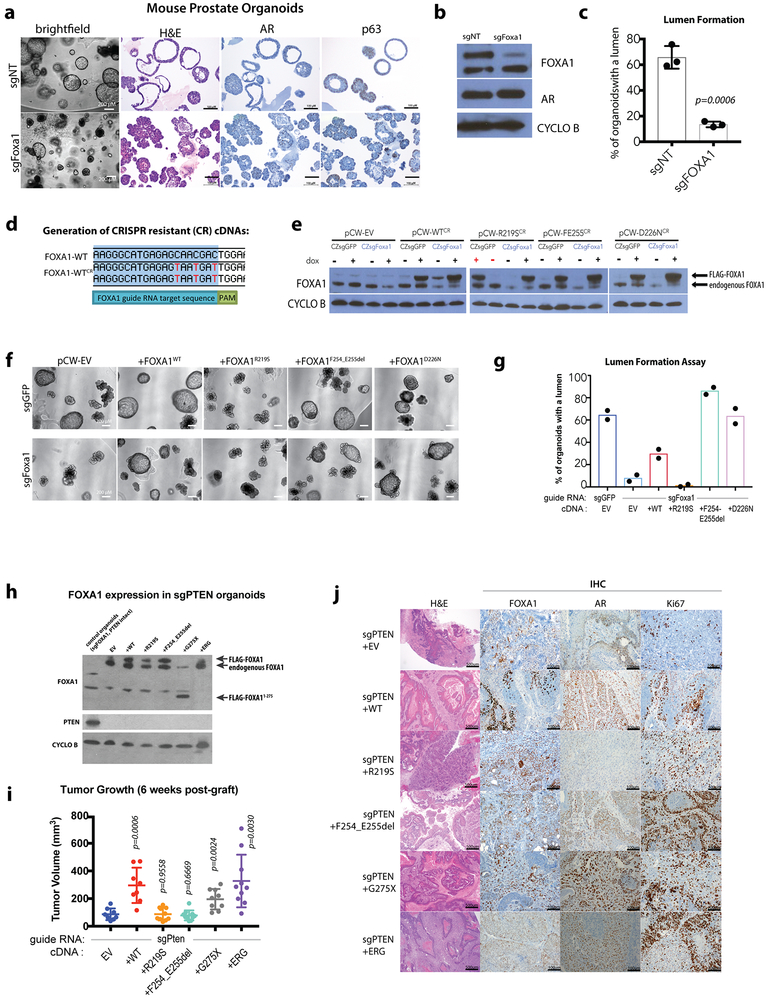
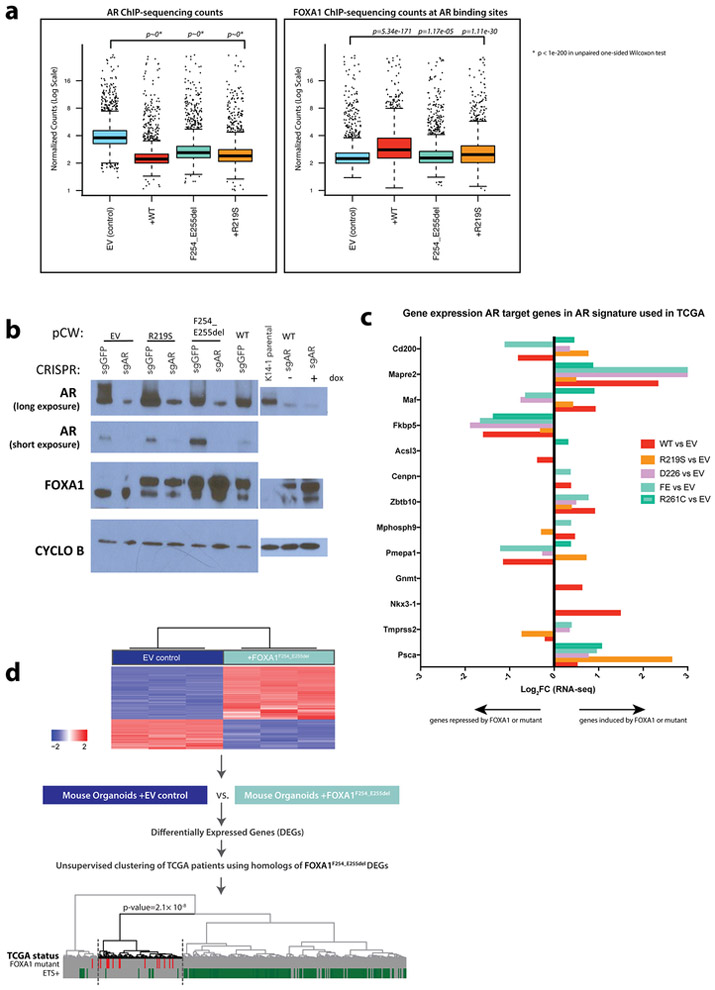
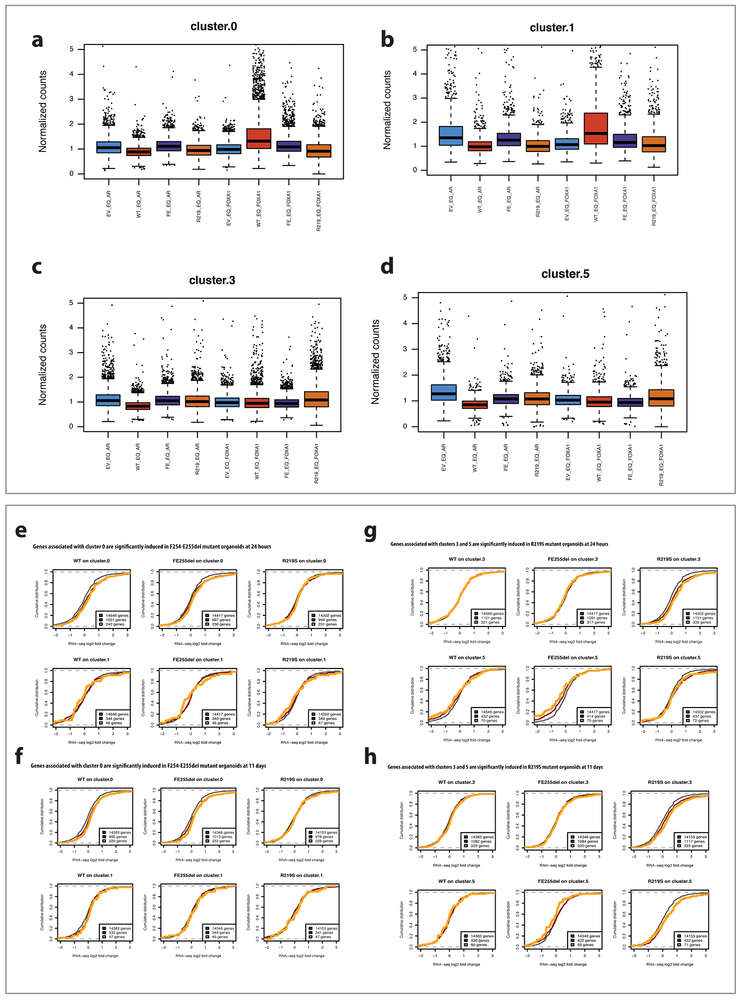
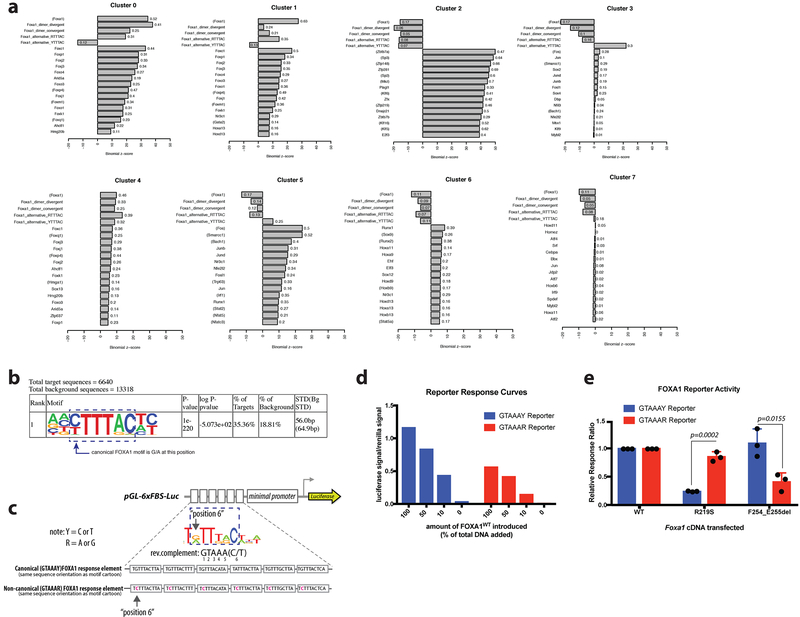
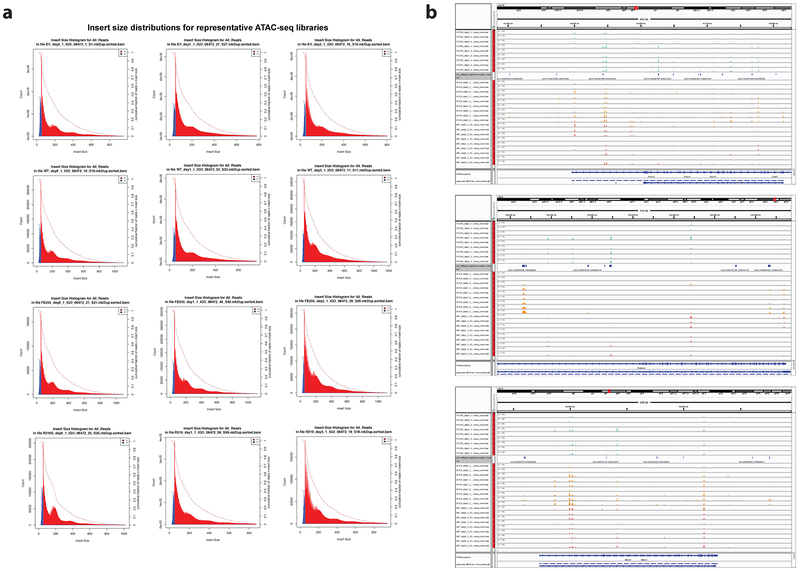
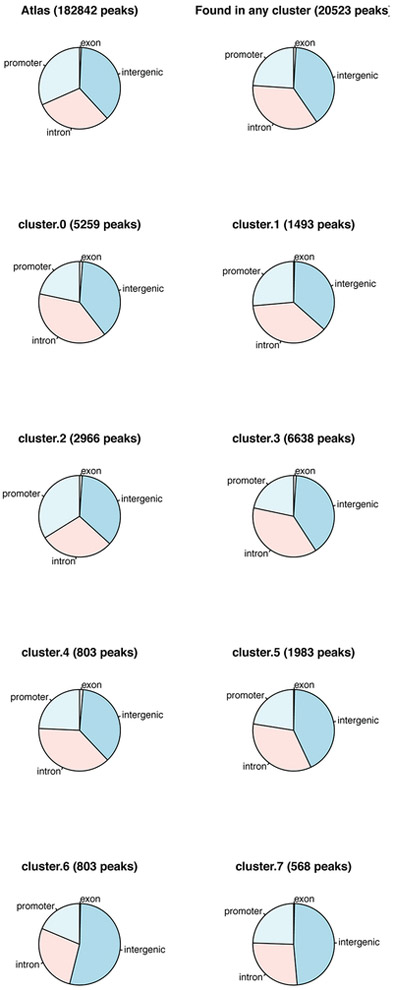
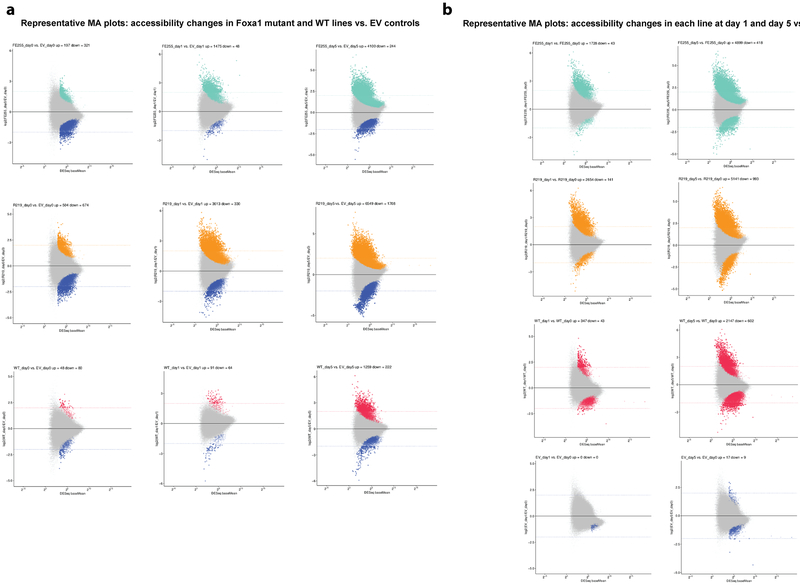
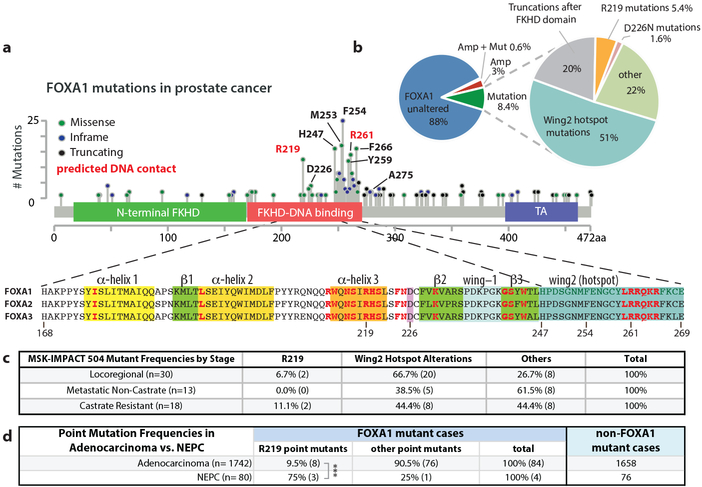
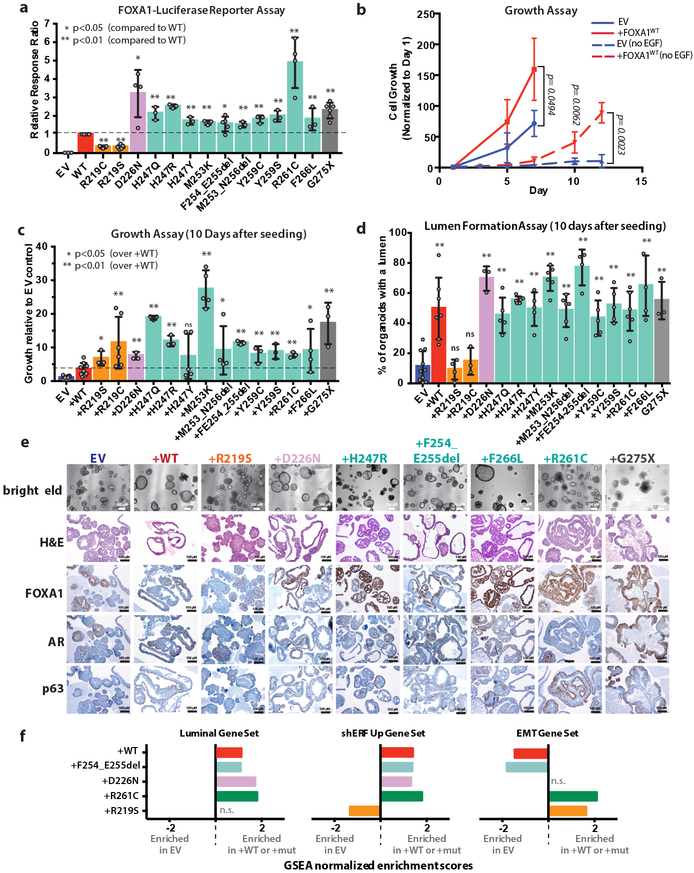
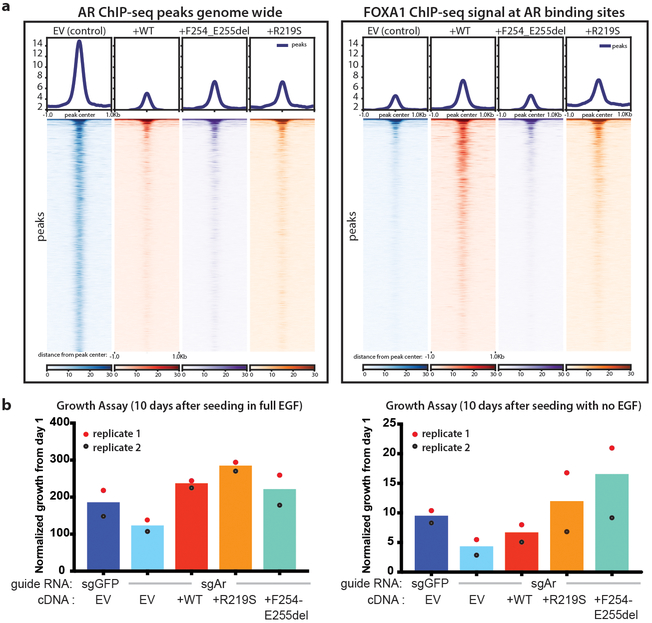
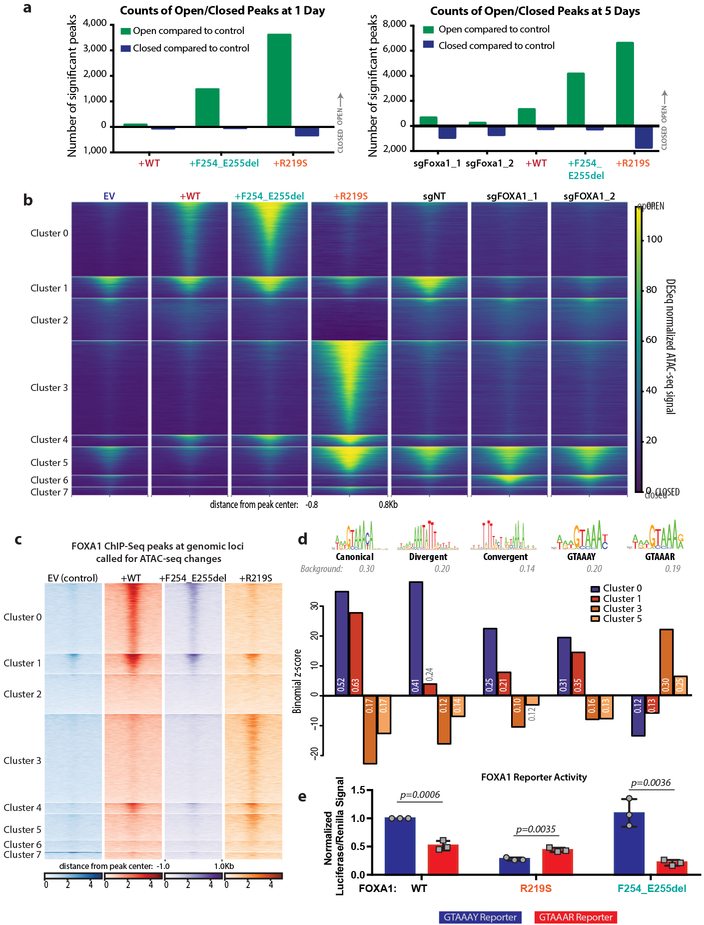
Mutations in the transcription factor FOXA1 define a unique subset of prostate cancers but the functional consequences of these mutations and whether they confer gain or loss of function is unknown1-9. Here, by annotating the landscape of FOXA1 mutations from 3,086 human prostate cancers, we define two hotspots in the forkhead domain: Wing2 (around 50% of all mutations) and the highly conserved DNA-contact residue R219 (around 5% of all mutations). Wing2 mutations are detected in adenocarcinomas at all stages, whereas R219 mutations are enriched in metastatic tumours with neuroendocrine histology. Interrogation of the biological properties of wild-type FOXA1 and fourteen FOXA1 mutants reveals gain of function in mouse prostate organoid proliferation assays. Twelve of these mutants, as well as wild-type FOXA1, promoted an exaggerated pro-luminal differentiation program, whereas two different R219 mutants blocked luminal differentiation and activated a mesenchymal and neuroendocrine transcriptional program. Assay for transposase-accessible chromatin using sequencing (ATAC-seq) of wild-type FOXA1 and representative Wing2 and R219 mutants revealed marked, mutant-specific changes in open chromatin at thousands of genomic loci and exposed sites of FOXA1 binding and associated increases in gene expression. Of note, ATAC-seq peaks in cells expressing R219 mutants lacked the canonical core FOXA1-binding motifs (GTAAAC/T) but were enriched for a related, non-canonical motif (GTAAAG/A), which was preferentially activated by R219-mutant FOXA1 in reporter assays. Thus, FOXA1 mutations alter its pioneering function and perturb normal luminal epithelial differentiation programs, providing further support for the role of lineage plasticity in cancer progression.


Figures

Extended Data Figure 1.
Extended Data Figure 1.. Patients with predicted FOXA1 mutant status have worse outcomes.
(a) Co-crystal structure of the FKHD domain of FOXA3 in complex with DNA resembling the FKHD consensus sequence (PDB 1VTN), with residues and folds of interest indicated, including α-helix3 (orange), which sits in the major groove of DNA, and Wing2 (cyan), which undergoes frequent mutation in prostate cancer. (b) Kaplan-Meier showing significantly different clinical outcomes of time to biochemical recurrence (BCR, left) or progression to metastatic disease (MET,right) for predicted FOXA1 mutant cases vs. wild-type in the GRID cohort. The difference of MET/BCR survival curves was tested via R survdiff function using G-rho family of tests, without adjustments for multiple comparisons. (c) Associations between predicted FOXA1 mutation status and clinical variables using univariate analysis of the GRID cohort, with FOXA1 wild type as reference. The GRID cohort included 1,626 radical prostatectomy (RP) tumor samples. The center values represent the median odds ratio via univariate analysis. The error bars represent first and third quartiles of odds ratio. The lines represent minimum and maximum odd ratio. Univariate logistic regression analyses were performed on the GRID cohort to test the statistical association between FOXA1 mutant status and clinical variables via generalized linear test, without adjustments for multiple comparisons. The test was two-sided with the significance level of p <0.05 as the cutoff.
Extended Data Figure 2.
Extended Data Figure 2.. Details of FOXA1 luciferase reporter assay.
(a) Schematic of FOXA1 luciferase reporter, depicting the modified response elements (at wobble positions within the canonical FOXA1 motif) cloned in tandem upstream of a minimal promoter driving luciferase expression. (b) Dose response curve of FOXA1 luciferase reporter activity in response to increased amounts of Foxa11WT cDNA introduced into the system, expressed as a relative response ratio with 100% Foxa1WT cDNA set to 1 and 0% Foxa1WT cDNA (100% “stuffer” DNA) set to 0. Data from 3 biological replicates, central line and error bars represent mean +/− standard deviation. (c) Western blot of allelic series of FOXA1 mutants in HEK293T cells 24 hours after transfection with equal amounts of cDNA as used in FOXA1-luciferase reporter assay. CYCLO B = loading control Cyclophilin B. Representative blot, experiment repeated 3 independent times with similar results. For source gel data, see Supplementary Figure 1.
Extended Data Figure 3.
Extended Data Figure 3.. Inducible overexpression of FOXA1 variants influences organoid lumen size and morphology.
(a) Schematic of dox-inducible pCW-FOXA1 constructs used in the study. (b) Western blot analysis of lysates from pCW-FOXA1WT organoids following acute dox treatment. Representative blot, experiment repeated 2 independent times with similar results. For source gel data, see Supplementary Figure 1. (c) Western blot analysis of lysates from organoids following long term dox treatment. Size of endogenous and FLAG-tagged FOXA1 noted, as well as the smaller truncated form from G275X at the expected size ~38kDa. Representative blot, experiment repeated 3 independent times with similar results. For source gel data, see Supplementary Figure 1. (d) Quantification of lumen areas measured at 10 days post-seeding. Solid black bar represents geometric mean, Values for sample size (indicated as dots) and p-values are as follows: EV (292), +WT (284, p<0.0001 over EV), +R219S (60, <0.0001), +F254_E255del (119, <0.0001), +D226N (120, <0.0001), +R261C (114, <0.0001), +R219C (333, 0.2915), +G275X (75, <0.0001), +M253_N256del (150, 0.2006), +M253K (63, 0.2343), +Y259S (32, 0.2045), +Y259C (45, 0.0082), +F266L (107, 0.1219), +H247Q (63, 0.8343), +H247R (180, <0.0001), +H247Y (71, 0.9104). All p-values are relative to WT unless noted, calculated using unpaired, two-tailed Student’s T-test. Colors represent location of mutation within FOXA1. (e) Histology and IHC of organoid lines overexpressing additional alleles of FOXA1 (+WT or +Mut) via the doxycycline-inducible pCW vector 10 days after seeding. Images from a single biological experiment.
Extended Data Figure 4.
Extended Data Figure 4.. Analysis of FOXA1 alterations in FOXA1-deleted or PTEN-deleted contexts.
(a) CRISPR/Cas9 mediated knockdown of FOXA1 results in a significantly altered morphology. Organoids lacking FOXA1 (sgFOXA1) have a reduced capacity to form lumens while maintaining expression of AR and the basal marker p63 sgNT (guide RNA targeting human gene AAVS1) serves as a negative control. (b) Western blot analysis of lysates from organoids carrying control guide RNA (sgNT) or guide RNA targeting FOXA1. Representative blot, experiment repeated 3 times with similar results. For source gel data, see Supplementary Figure 1. (c) Quantification of organoids containing lumens, 7 days after trypsinization in normal organoid media. Data from 3 biological replicates, bars represent mean +/− standard deviation, p-value calculated using unpaired, two-tailed Student’s T-test. (d) Sequence indicating the location of 3 silent point mutations introduced upstream of the PAM sequence for Foxa1 targeting RNA sgFoxa1_1. (e) Western blot analysis of lysates from organoids carrying either CRISPR-Zeo-sgGFP or sgFoxa1_1 in addition to the pCW construct indicated, either EV or with a FOXA1 allele present, plus or minus dox treatment for 10 days. Representative blot, experiment repeated 2 times with similar results. For source gel data, see Supplementary Figure 1. (f) Images of organoid lines carrying various combinations of guide RNA and cDNAs, 10 days after dox treatment. (g) Quantification of lumen containing organoids in lines with endogenous Foxa1 deleted via CRISPR/Cas9 (sgFoxa1, sgNT as control guide) and overexpression of CRIPSR-resistant Foxa1 WT or mutant cDNA 10 days after seeding. Data from 2 biological replicates, bars represent mean. (h) Western blot analysis of lysates from PTEN-deficient organoids grafted into mice, with dox-induced overexpression of appropriate FOXA1 mutants. Representative blot, experiment repeated 2 times with similar results. For source gel data, see Supplementary Figure 1. (i) Overexpression of FOXA1WT or FOXA1G275X in sgPTEN organoids promotes tumor growth in mice at 6-weeks post engraftment into the flank of NOD-Scid Gamma mice. Data from the following number of tumors: EV=8, +WT=8, +R219S=10, +F254_E255del=10, +G275X=9, +ERG=10. Error bars represent mean +/− standard deviation, p-values calculated using unpaired, two-tailed Student’s T-test vs EV. Colors represent location of mutation within FOXA1. (j) Representative histology and immunohistochemistry (IHC) of a single tumor for given PTEN-deficient, FOXA1 expressing lines. Histology and IHC done on 5–9 tumors per line, from a single in vivo experiment, with similar results.
Extended Data Figure 5.
Extended Data Figure 5.. Analysis of the interplay between AR and FOXA1 in mouse organoids expressing FOXA1 variants.
(a) Box-plot representations of normalized counts from AR (left) and FOXA1 ChIP-seq (right) shown in Figure 3a to quantify the reduction in AR binding following FOXA1 wild-type or mutant overexpression, and the increase in FOXA1 wild-type binding at those sites where AR is lost. Box: 25th to 75th percentile, band: median, top whisker: 75th percentile plus 1.5 times interquartile range, bottom whisker: 25th percentile minus 1.5 times interquartile range. Sample size = 2914 peaks. . p-values calculated using an unpaired, one-sided Wilcoxon test. (b) Western blot analysis of lysates from AR-deficient organoids generated using CRISPR-Cas9 carrying representative FOXA1 alleles. Levels are significantly reduced but AR is not completely absent (as seen on the long exposure) given that this is a bulk population rather than single cell clones thus a small number of cells escaped CRISPR/Cas9 mediated Ar deletion. Cells were treated with dox for at least 10 days. Representative blot, experiment repeated 2 times with similar results. For source gel data, see Supplementary Figure 1. (c) Expression of mouse orthologs of AR target genes found in AR signature used in TCGA cohort analysis based on mouse organoid RNA-sequencing analysis. Genes depicted are those that have a mouse ortholog of the human gene found in the signature, and a significant expression change (DESeq2 adjusted p-value < 0.05) compared to EV control at 11 days +dox, as well as Psca, an AR target gene expressed in mouse organoids. Data from RNA-sequencing of 3 biological replicates. (d) FOXA1F254_E255del signature can predict mutant tumors in TCGA. Hierarchical clustering and heat map of significantly differentially expressed genes between mouse FOXA1F254_255 organoids and EV control (FDR<=1×10⁻¹⁰). Human homologs of differentially expressed genes (DEGs) from this analysis were used to cluster FOXA1 mutant (n=14) and can detect nearly all FOXA1 mutant human tumors (p=2.1×10⁻⁸) out of the 333 TCGA samples, 199 of which are ETS+. Two-sided Fisher-exact test was used to test the enrichment of FOXA1 mutant samples within in sub-cluster, without adjustments for multiple comparisons.
Extended Data Figure 6.
Extended Data Figure 6.. Integrated analysis of ChIP-seq, ATAC-seq, and RNA-seq data in FOXA1 mutant organoid lines.
(a) Cluster 0 peaks have higher FOXA1 ChIP-seq signal in F254_E255del mutant organoid than empty vector control. Box plots show normalized day 5 AR ChIP-seq signal and FOXA1 ChIP-seq signal across different organoid lines at peaks from cluster 0, where normalization is based on background ChIP signal. FOXA1 ChIP signal is significantly higher in F254_E255del and in WT compared to EV control (all P values can be found in Supplementary Table 11). Sample size = 5260 peaks. (b) Cluster 1 peaks have higher FOXA1 ChIP-seq signal and lower AR ChIP-seq signal in WT FOXA1 overexpressing organoid than empty vector control. Box plots show normalized day 5 AR ChIP-seq signal and FOXA1 ChIP-seq signal across different organoid lines at peaks from cluster 1, where normalization is based on background ChIP signal. FOXA1 ChIP signal is significantly higher, and AR ChIP signal significantly lower, in WT compared to EV control. Sample size = 1493 peaks. (c) Cluster 3 peaks have higher FOXA1 ChIP-seq signal in R219S organoid than empty vector control. Box plots show normalized day 5 AR ChIP-seq signal and FOXA1 ChIP-seq signal across different organoid lines at peaks from cluster 3, where normalization is based on background ChIP signal. FOXA1 ChIP signal is significantly higher in R219S compared to EV control. Sample size = 6641 peaks. (d) Cluster 5 peaks have higher FOXA1 ChIP-seq signal and lower AR ChIP-seq signal in R219S organoid than empty vector control. Box plots show normalized day 5 AR ChIP-seq signal and FOXA1 ChIP-seq signal across different organoid lines at peaks from cluster 5, where normalization is based on background ChIP signal. FOXA1 ChIP signal is significantly higher, and AR ChIP signal significantly lower, in R219S compared to EV control. Sample size = 1983 peaks. For panels a-d, box: 25th to 75th percentile, band: median, top whisker: 75th percentile plus 1.5 times interquartile range, bottom whisker: 25th percentile minus 1.5 times interquartile range. p-values calculated using an unpaired, one-sided Wilcoxon test. (e) Genes associated with cluster 0 are significantly induced in F254_E255del mutant organoids. Top row: Plots show empirical cumulative distribution of log2 expression changes at 24hrs vs. day 0 in WT (left), F254_E255del mutant (middle) and R219S mutant (right) organoids for all expressed genes (black), genes associated with at least one ATAC-seq peak in cluster 0 (‘cluster 0-associated genes’, red), and the top quartile of these genes based on number of assigned cluster 0 peaks (‘strong cluster 0-associated genes’, yellow). Cluster 0-associated genes show strong expression induction compared to all genes in F254_E255del as well as in WT (red vs. black) but not in R219. Bottom row: As a control, similar cumulative log2 expression changes for cluster 1-associated genes (red) or strong cluster 1-associated genes (yellow) do not show significant induction in F254_E255del. All P-values are listed in Supplementary Table 12 and are one-sided Wilcoxon rank sum tests. (f) Genes associated with cluster 0 are significantly induced in F254-E255del mutant organoids. Top row: Plots show empirical cumulative distribution of log2 expression changes at 11 days vs. day 0 in WT (left), F254_E255del mutant (middle) and R219S mutant (right) organoids for all expressed genes (black), genes associated with at least one ATAC-seq peak in cluster 0 (‘cluster 0-associated genes’, red), and the top quartile of these genes based on number of assigned cluster 0 peaks (‘strong cluster 0-associated genes’, yellow). Cluster 0-associated genes show strong expression induction compared to all genes in F254_E255del as well as in WT but not in R219. Bottom row: As a control, similar cumulative log2 expression changes for cluster 1-associated genes (red) or strong cluster 1-associated genes (yellow) do not show significant induction in F254_E255del. All P-values are listed in Supplementary Table 12 and are one-sided Wilcoxon rank sum tests. (g) Genes associated with clusters 3 and 5 are significantly induced in R219S mutant organoid. Top row: Plots show empirical cumulative distribution of log2 expression changes at 24hrs vs. day 0 in WT (left), F254_E255del mutant (middle) and R219S mutant (right) organoids for all expressed genes (black), genes associated with at least one ATAC-seq peak in cluster 3 (‘cluster 3-associated genes’, red), and the top quartile of these genes based on number of assigned cluster 0 peaks (‘strong cluster 3-associated genes’, yellow). Cluster 3-associated genes show strong expression induction compared to all genes in R219S but not in WT or F255del. Bottom row: Similar analysis for cumulative log2 expression changes for cluster 5-associated genes (red) and strong cluster 5-associated genes (yellow). These genes are significantly induced in R219S and repressed in F254_E255del in WT for this time point. All P-values are listed in Supplementary Table 12 and are one-sided Wilcoxon rank sum tests. (h) Genes associated with clusters 3 and 5 are significantly induced in R219S mutant organoid. Top row: Plots show empirical cumulative distribution of log2 expression changes at day 11 vs. day 0 in WT (left), F254_E255del mutant (middle) and R219S mutant (right) organoids for all expressed genes (black), genes associated with at least one ATAC-seq peak in cluster 3 (‘cluster 3-associated genes’, red), and the top quartile of these genes based on number of assigned cluster 0 peaks (‘strong cluster 3-associated genes’, yellow). Cluster 3-associated genes show strong expression induction compared to all genes in R219S but not in WT or F255del. Bottom row: Similar analysis for cumulative log2 expression changes for cluster 5-associated genes (red) and strong cluster 5-associated genes (yellow). These genes are significantly induced in R219S and repressed in F254_E255del. All P-values are listed in Supplementary Table 12 and are one-sided Wilcoxon rank sum tests.
Extended Data Figure 7.
Extended Data Figure 7.. Motif analysis of ATAC-sequencing and modification of FOXA1 reporter assay for evaluation of non-canonical FOXA1 motif.
(a) FIMO motif analysis of ATAC-seq clusters. Summary of motif enrichments/depletion results for each cluster relative to the background of all differentially accessible peaks, as reported by binomial Z-score. The top 15 enriched database motifs for expressed transcription factors are shown for each cluster. In addition, enrichment/depletion results for four additional FOXA1-related motifs are shown: convergent and divergent dimer motifs, and altered FOXA1 core binding motifs with either G/A or C/T at position 6. Transcription factors in parentheses represent motifs inferred from other species. Complete lists can be found in Supplementary Tables 3-10. (b) Top motif identified de novo using HOMER on ATAC-seq cluster 3 (R219S-specific) with motif core indicated, and variation from canonical FOXA1 motif depicted. p-values derived from one-sided binomial test. (c) Schematic of reporter design. Canonical response element reporter is same reporter used in Fig. 2, with various iterations of the canonical FOXA1 motif in tandem. Non-canonical motif has substitutions at position 6, indicated in pink, to reflect the newly identified motif enriched in cluster 3 of ATAC-seq. Note: the orientation of the upper motif cartoon and the sequence in the reporter schematic are the reverse complement of the motif identified by HOMER (GTAAAR). Modified base noted in position 6. (d) Dose response curve for both FOXA1 luciferase reporters’ activity in response to increased amounts of Foxa1WT cDNA introduced into the system. Data shown is one representative biological replicate of 3 carried out, all showing same trends, but absolute luciferase/renilla ratios vary from experiment to experiment. (e) Results of reporter assays expressed as a relative response ratio, normalized to level of FOXA1WT activity for a given reporter. Data from 3 biological replicates, bars indicate mean +/− standard deviation. p-values derived using unpaired, two-tailed Student’s T-test.
Extended Data Figure 8.
Extended Data Figure 8.. Insert size distributions for ATAC-seq experiments and track figures demonstrating peak reproducibility across ATAC-seq replicates.
(a) Representative insert size distributions computed from individual ATAC-seq experiments based on aligned read pairs, showing modes corresponding to nucleosome-free regions, mono-nucleosomal fragments, and di-nucleosomal fragments. (b) Signal tracks for individual replicate ATAC-seq experiments at the Runx2, Plekha5, and Mbnl1 loci show reproducibility of accessibility events. DEseq scaling factors estimated from the atlas of IDR-reproducible peaks were used for library size normalization.
Extended Data Figure 9.
Extended Data Figure 9.. ATAC-seq peak annotation distributions.
Fraction of peaks annotated as promoter, intergenic, intronic, and exonic for full atlas of reproducible peaks, differentially accessible peaks, and by ATAC-seq cluster. See Supplementary Table 15 for full annotation counts.
Extended Data Figure 10.
Extended Data Figure 10.. MA plots for differential accessibility analysis.
(a) MA plots for differential accessibility analysis relative to EV controls. Representative MA plots (logFC vs mean read counts) for differential peak accessibility analysis of mutant and WT expressing organoid lines vs. empty vector controls at day 0, day 1, and day 5. Peaks that are significantly differential at FDR-corrected P < 0.05 are shown in color. Dotted lines at logFC = 2 and logFC = −2 show cut-offs used for requiring robust accessibility changes in pairwise comparisons. (b) MA plots for differential accessibility analysis at different time point relative to day 0. Representative MA plots (logFC vs mean read counts) for differential peak accessibility analysis in each organoid line at day 1 vs. day 0 and day 5 vs. day 0. For a-b, all sample size n=183093 (number of peaks in the atlas). Peaks that are significantly differential at FDR-corrected P < 0.05 are shown in color, using two-sided Wald test with Benjamini-Hochberg correction.
Fig. 1.
Fig. 1.. Recurrent FOXA1 mutations in prostate cancer cluster in the FKHD DNA-binding domain
(a) Distribution of FOXA1 mutations from a pan-prostate cancer analysis of 3086 patients along linear protein sequence, depicting the various alterations seen in patients, and the amino acid sequence of the conserved FKHD DNA-binding domain, with secondary structural elements indicated. Residues in red are predicted to make contacts with DNA. (b) Classification of FOXA1 alterations observed. Mutations can be subdivided into several classed based on their location within the FOXA1 protein. (c) Frequency of the various classes of FOXA1 alterations in the 3 clinical stages reported in MSK-IMPACT 504. All values are % of the total number of samples with FOXA1 mutations at a given clinical stage. (d) Prevalence of R219 mutations compared to all other point mutations found in FOXA1 in adenocarcinoma versus NEPC. Cases pooled from Trento/Cornell/Broad dataset and MSK-IMPACT 1708. ***p=0.0059, Fisher’s exact test, two-sided.
Fig. 2.
Fig. 2.. Expression of FOXA1 mutants promotes growth and reveals distinct morphologies for the various classes of alterations.
(a) FOXA1-luciferase reporter assay with results normalized to level of FOXA1WT activity. Colors indicate position of altered amino acid within the FKHD DNA-binding domain depicted in Fig. 1a. Grey indicates truncation. (b) Overexpression of FOXA1 promotes growth in prostate organoids in standard media conditions (solid lines, n=3) and in restrictive media conditions (dashed lines, no EGF, n=8). EV = pCW empty vector control. (c) Overexpression of wild-type (+WT) or various FOXA1 mutants promotes growth 10 days after seeding in media lacking EGF. (d) Quantification of lumen containing organoids for each line in the FOXA1 allelic series. All p-values are relative to EV, calculated using unpaired, two-tailed Student’s T-test. (e) Histology and IHC of organoid lines overexpressing various alleles of FOXA1 (+WT or +Mut) via the doxycycline-inducible pCW vector 10 days after seeding. Images from a single biological experiment. (f) Summary of GSEA comparing FOXA1 wild type or mutant organoid lines to EV control for a basal_low (luminal) gene set, the hallmark EMT gene set, and a gene set of the top 100 genes induced following ERF knockdown in organoids. Data from RNA-seq of 3 biological replicates for each organoid line. Only comparisons with an FDR of <0.25 are shown with the corresponding normalized enrichment score (NES). Gene sets with a positive NES are enriched in organoids carrying either FOXA1 wild-type or mutant alleles. For panels a-d, data represented as mean +/− standard deviation (SD). Values for n biological replicates (indicated as dots) as well as specific p-values can be found in the source data file. * indicates p<0.05, ** indicates p<0.01. All p-values are relative to +WT unless otherwise noted, calculated using unpaired, two-tailed Student’s T-test.
Fig. 3.
Fig. 3.. FOXA1 expression constricts the AR cistrome and promotes AR-independent growth programs.
(a) AR ChIP-sequencing in organoids overexpressing wild-type or mutant FOXA1 compared to control show significant changes in the AR cistrome in response to FOXA1 expression (left) and FOXA1 ChIP-seq showing FOXA1 binding at same loci. ChIP-seq data from two biological replicates. Statistical analysis of peaks can be found in Ext Data Fig. 6. (b) Overexpression of FOXA1 promotes growth in prostate organoids in the setting of significantly reduced AR (CRISPR-mediated deletion in a bulk population), in both standard media conditions (left panel) and in the absence of EGF (right panel). Two independent experiments result in the same growth trends for biological replicate 1 and 2.
Fig. 4.
Fig. 4.. FOXA1 mutations cause dramatic shifts in the chromatin landscape.
(a) Number of significant peaks open or closed (log2FC >2 for open, <−2 for closed peaks) after dox treatment for pCW-FOXA1wild-type or mutant organoids relative to EV. Right panel includes counts for FOXA1 CRISPR organoids 5 days after trypsinization relative to sgNT. Data from 3 biological replicates, with FDR <0.05 using two-sided Wald test, with Benjamini-Hochberg FDR correction for multiple observations. (b) ATAC-seq peak heat maps comparing organoids with (sgFOXA1_1, sgFOXA1_2) or without (sgNT) CRISPR deletion of Foxa1 or expression of WT or mutant FOXA1 after 5 days of dox treatment, with eight clusters defined by hierarchical clustering. (c) FOXA1 ChIP-seq signal at genomic loci matching ATAC-seq clusters defined in panel b shows a similar pattern of peaks correlating FOXA1 binding with open chromatin. Data from two biological replicates. (d) Enrichment or depletion of FOXA1 motif variants in clusters that gain accessibility in +F254_E255del or +R219S organoids, including the canonical motif, divergent and convergent dimer motifs, and altered versions of the FOXA1 motif (GTAAAY, similar to canonical and GTAAAR, non-canonical), expressed as a binomial Z-score computed from the number of cluster peaks with >1 motif occurrence relative to background occurrence in all heatmap peaks. Occurrence within a given cluster is reported within the bar graph. Positive scores indicate enrichment; negative scores indicate depletion. (e) Luciferase reporter assay depicting activity of FOXA1 variants on GTAAAY (blue) or GTAAAR (red) DNA templates. Luciferase/Renilla signal normalized to signal from FOXA1WT on GTAAAY reporter. Data from 3 biological replicates represented as mean +/− standard deviation. p-values determined using unpaired, two-tailed Student’s T-test. No significant difference between activity of WT and R219S on the GTAAAR reporter (p= 0.2314). F254_E255del has significantly less activity on GTAAAR than either WT (p= 0.0059) or R219S (p= 0.0033).

Comment in

References

Main Text References

    1. Pomerantz MM et al. The androgen receptor cistrome is extensively reprogrammed in human prostate tumorigenesis. Nat Genet 47, 1346–1351, doi: 10.1038/ng.3419 (2015). - DOI - PMC - PubMed
    1. Grasso CS et al. The mutational landscape of lethal castration-resistant prostate cancer. Nature 487, 239–243, doi: 10.1038/nature11125 (2012). - DOI - PMC - PubMed
    1. Gerhardt J et al. FOXA1 promotes tumor progression in prostate cancer and represents a novel hallmark of castration-resistant prostate cancer. Am J Pathol 180, 848–861, doi: 10.1016/j.ajpath.2011.10.021 (2012). - DOI - PubMed
    1. Jin HJ, Zhao JC, Ogden I, Bergan RC & Yu J Androgen receptor-independent function of FoxA1 in prostate cancer metastasis. Cancer Res 73, 3725–3736, doi: 10.1158/0008-5472.CAN-12-3468 (2013). - DOI - PMC - PubMed
    1. Barbieri CE et al. Exome sequencing identifies recurrent SPOP, FOXA1 and MED12 mutations in prostate cancer. Nat Genet 44, 685–689, doi: 10.1038/ng.2279 (2012). - DOI - PMC - PubMed

Methods References

    1. Gao J et al. Integrative Analysis of Complex Cancer Genomics and Clinical Profiles Using the cBioPortal. Science Signaling 6, pl1, doi: 10.1126/scisignal.2004088 (2013). - DOI - PMC - PubMed
    1. Cerami E et al. The cBio Cancer Genomics Portal: An Open Platform for Exploring Multidimensional Cancer Genomics Data. Cancer Discovery 2, 401, doi: 10.1158/2159-8290.CD-12-0095 (2012). - DOI - PMC - PubMed
    1. Watson PA et al. Constitutively active androgen receptor splice variants expressed in castration-resistant prostate cancer require full-length androgen receptor. Proceedings of the National Academy of Sciences 107, 16759 (2010). - PMC - PubMed
    1. Wang T, Wei JJ, Sabatini DM & Lander ES Genetic Screens in Human Cells Using the CRISPR-Cas9 System. Science 343, 80 (2014). - PMC - PubMed
    1. Motallebipour M et al. Differential binding and co-binding pattern of FOXA1 and FOXA3 and their relation to H3K4me3 in HepG2 cells revealed by ChIP-seq. Genome Biology 10, R129, doi: 10.1186/gb-2009-10-11-r129 (2009). - DOI - PMC - PubMed

Publication types

MeSH terms