. 2019 Jul;571(7765):413-418.
doi: 10.1038/s41586-019-1347-4. Epub 2019 Jun 26.

Distinct structural classes of activating FOXA1 alterations in advanced prostate cancer

Affiliations

Distinct structural classes of activating FOXA1 alterations in advanced prostate cancer

Abhijit Parolia et al. Nature. 2019 Jul.

Abstract

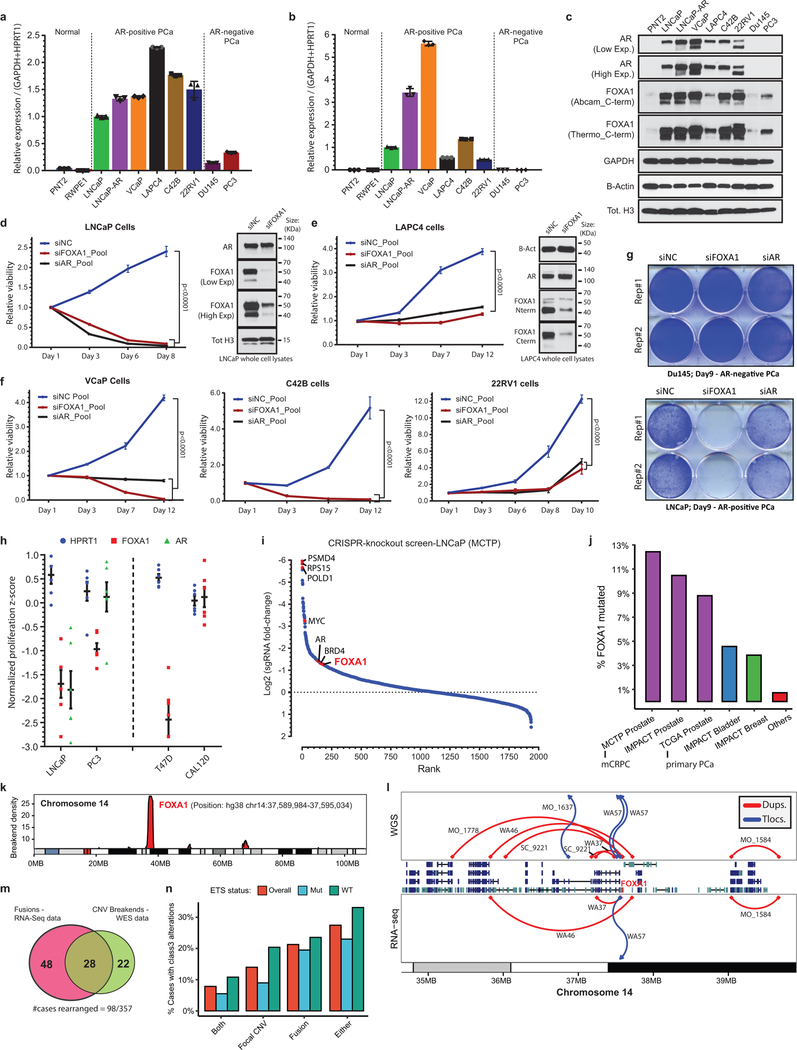
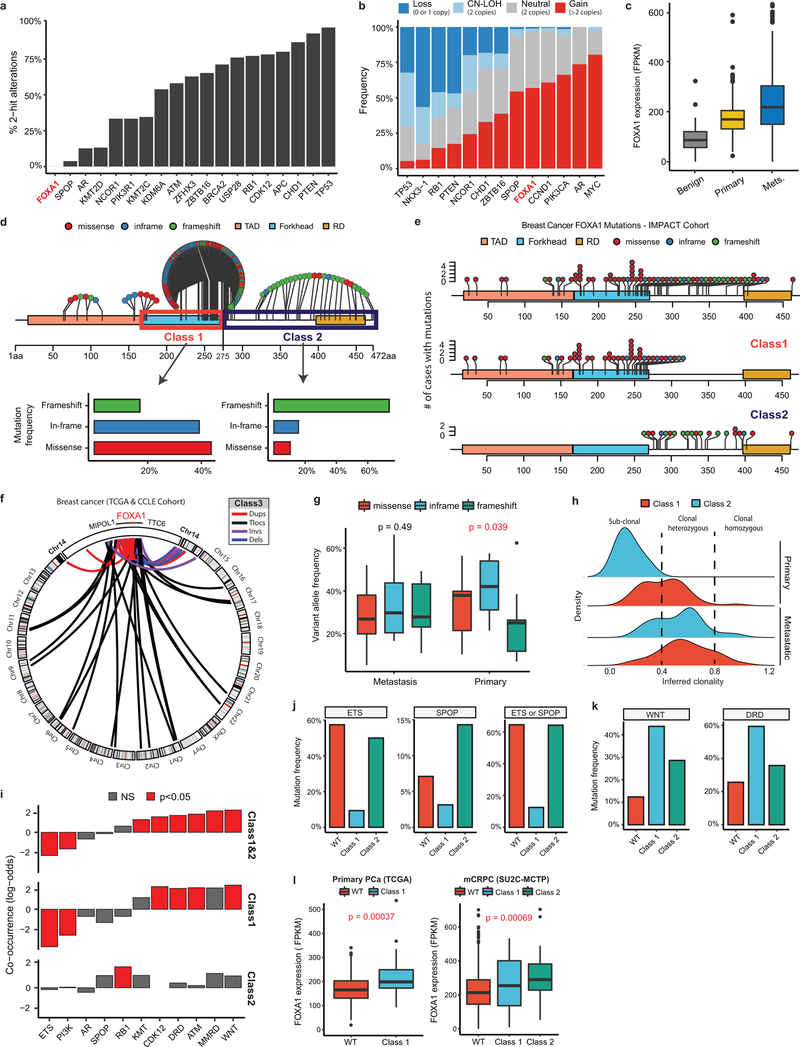
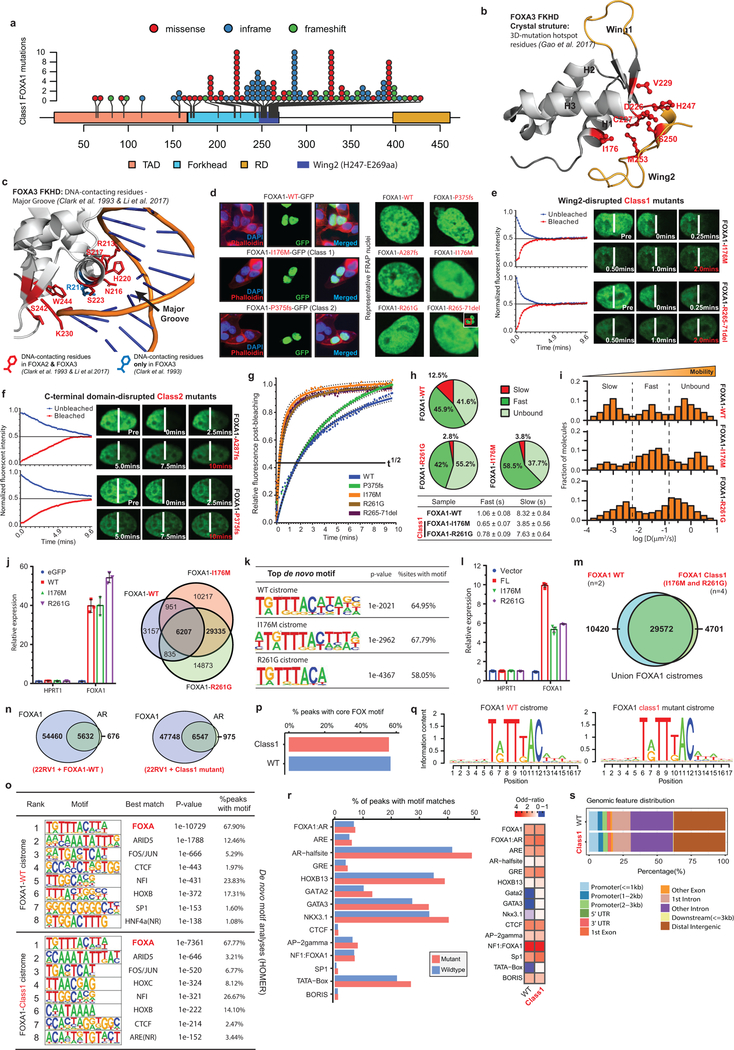
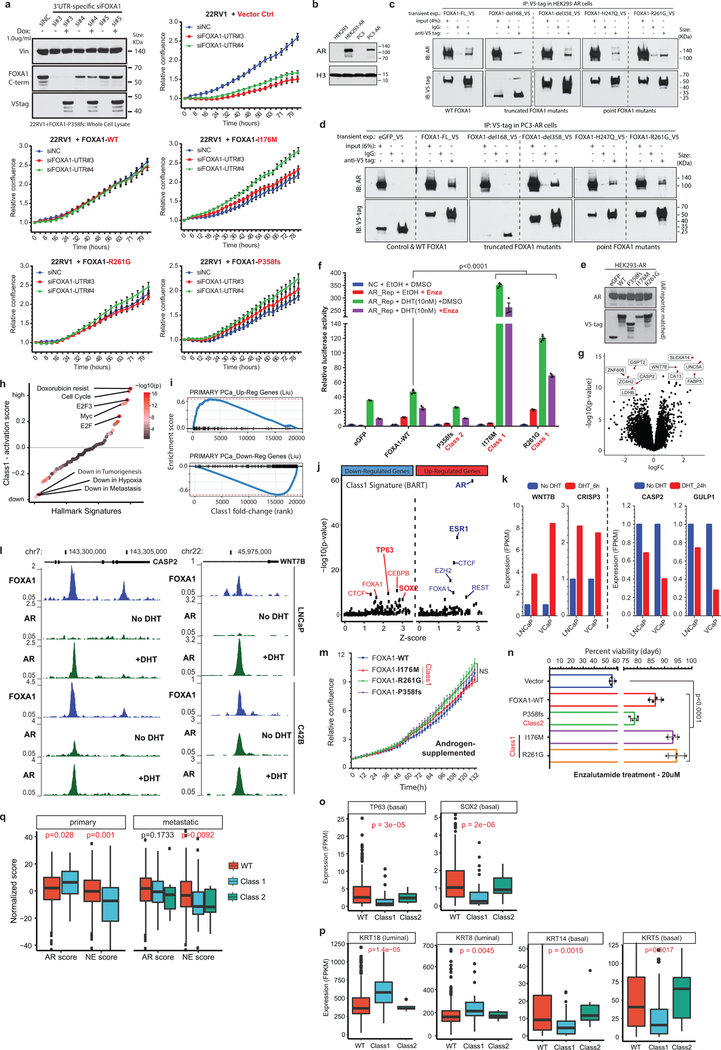
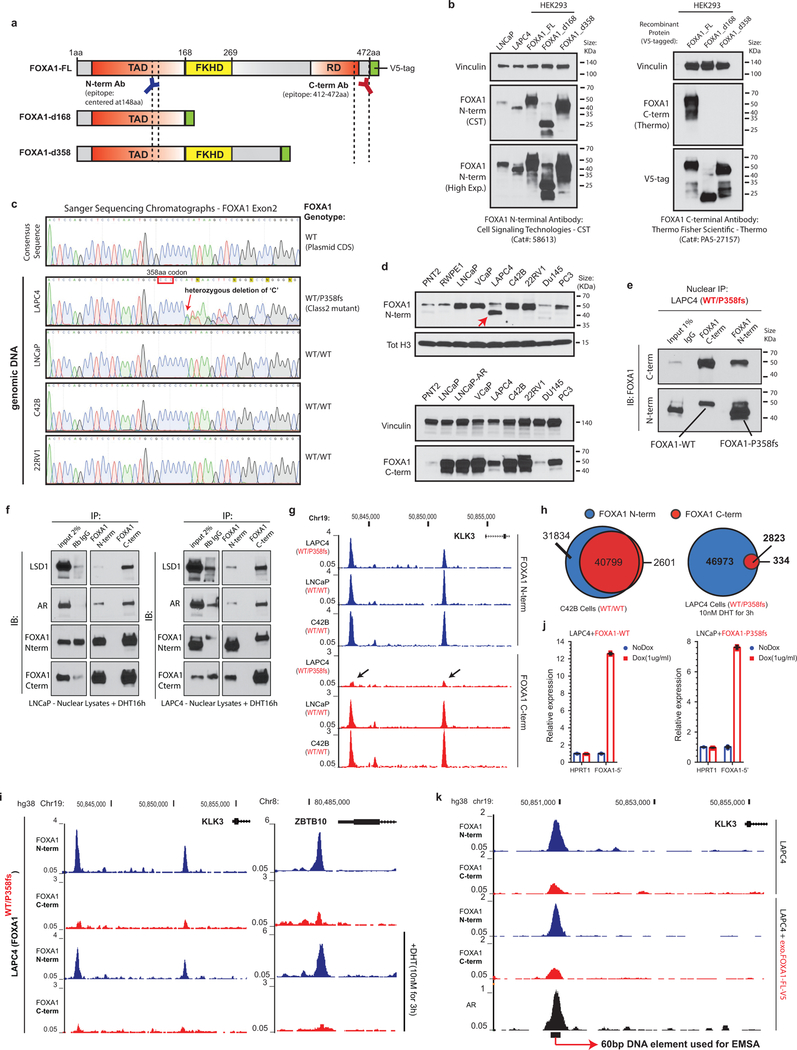
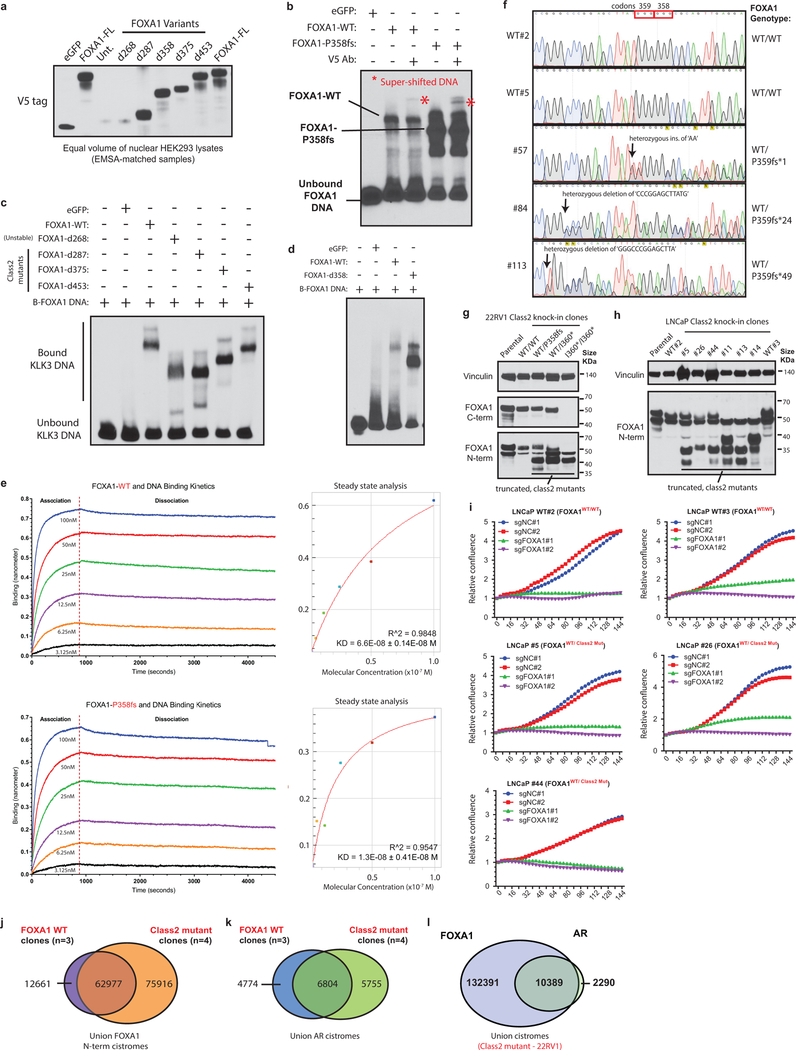
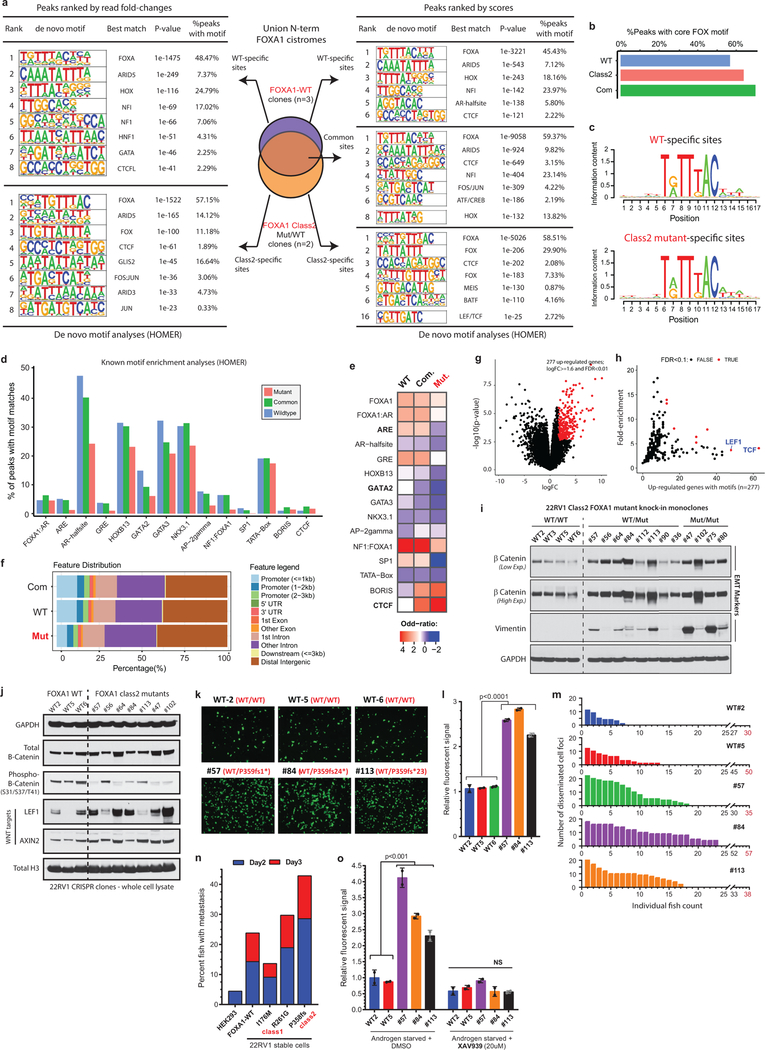
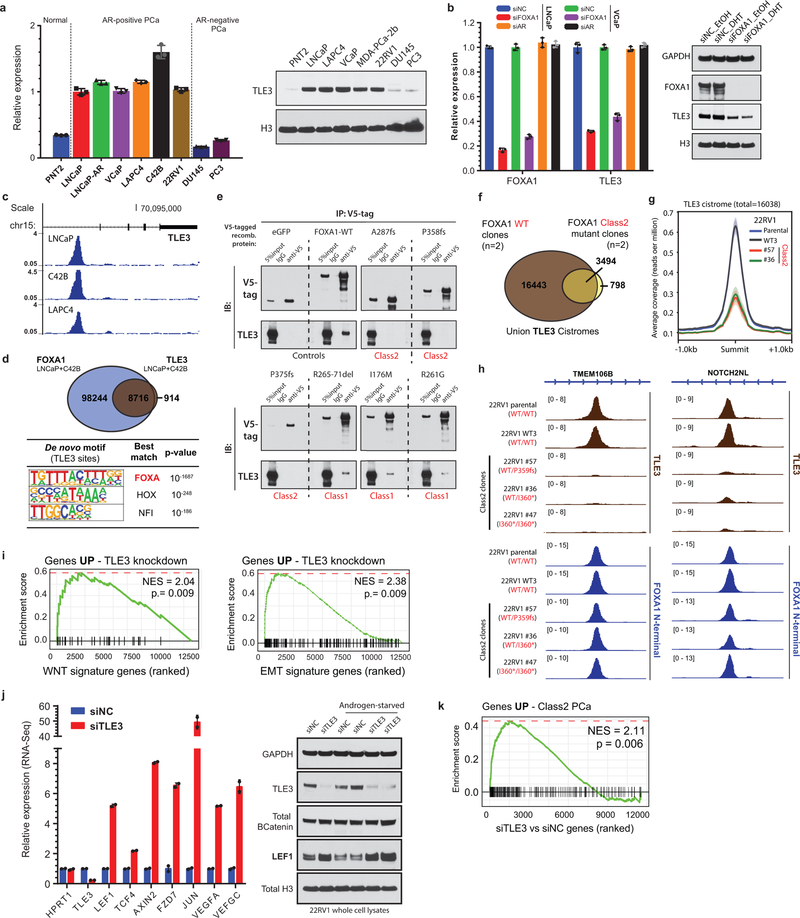
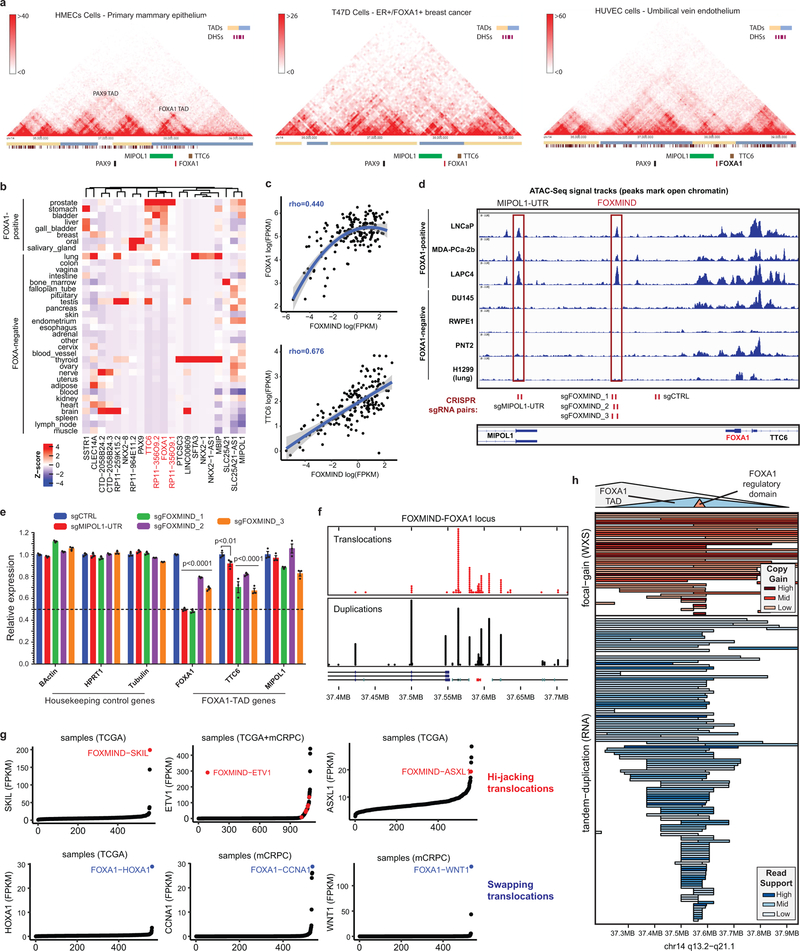
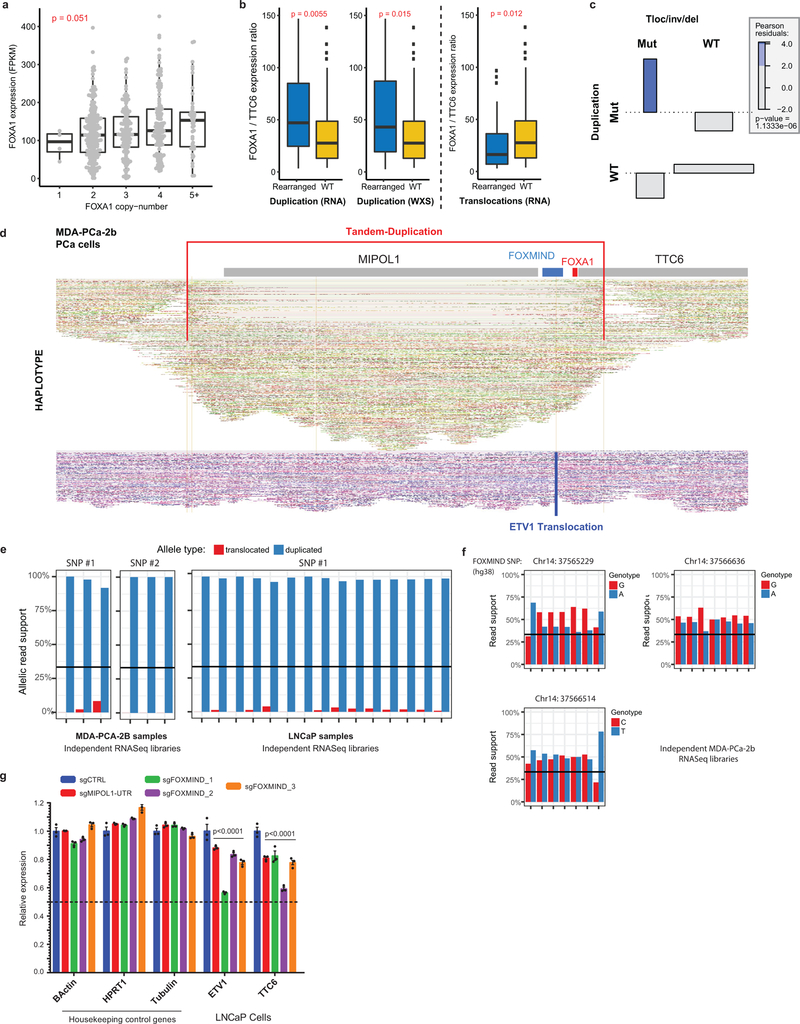
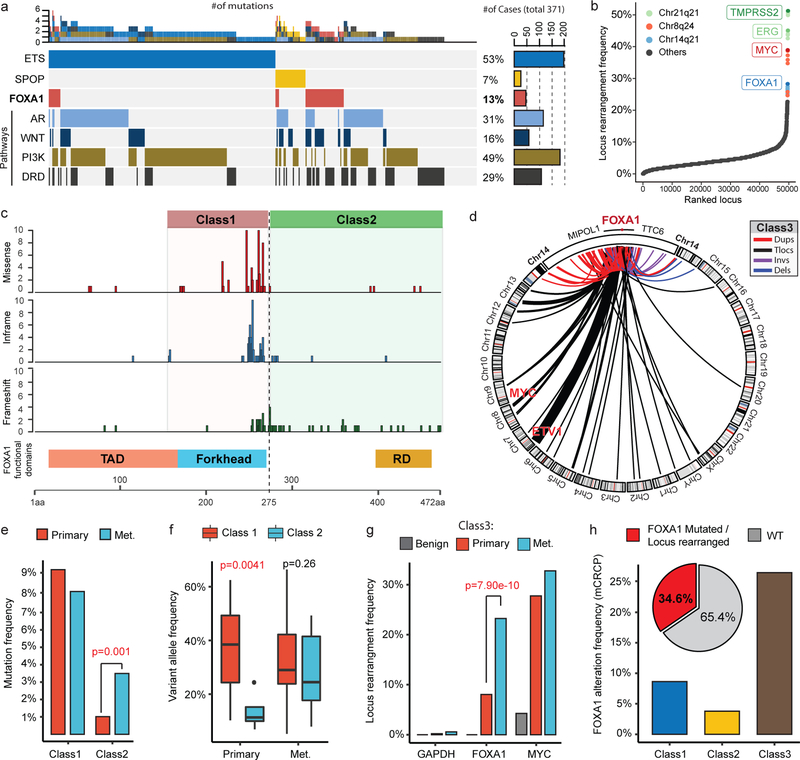
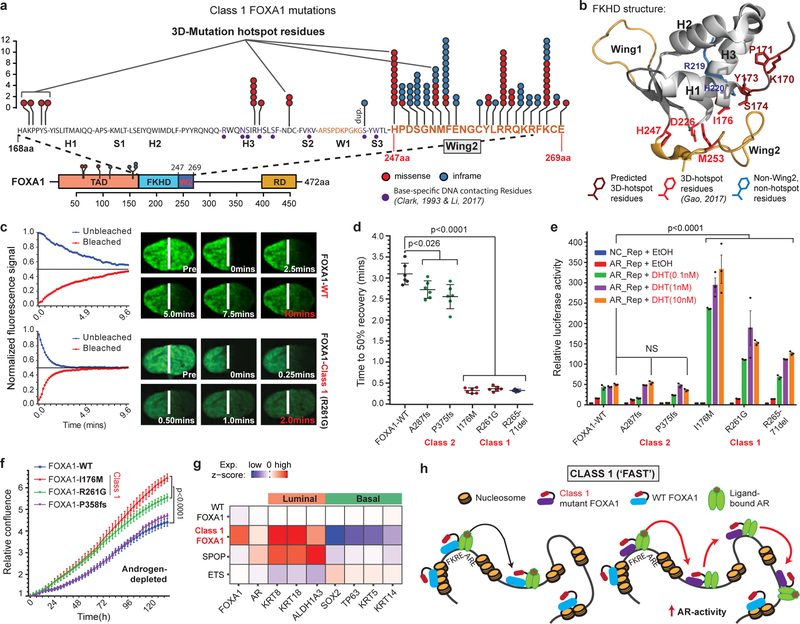
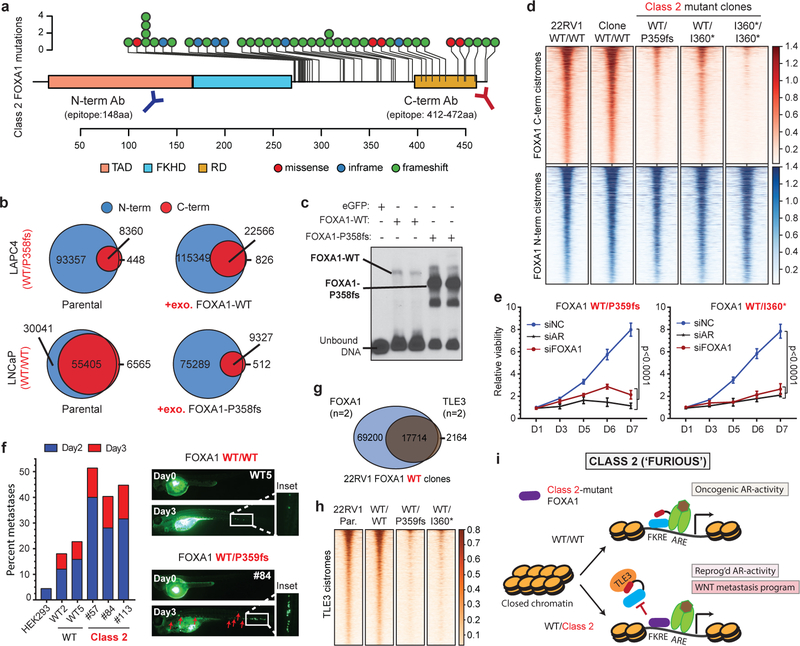
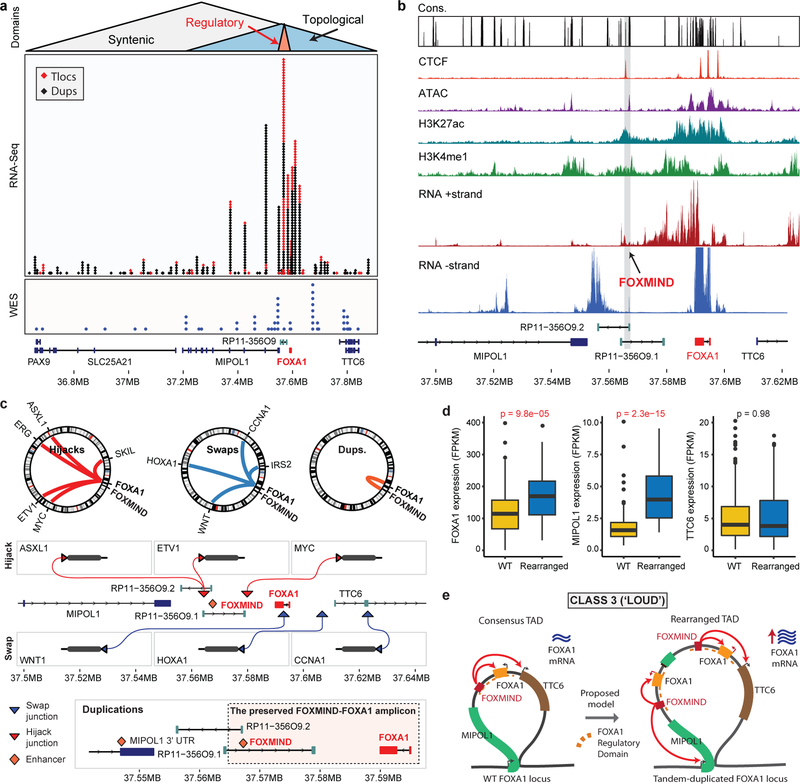
Forkhead box A1 (FOXA1) is a pioneer transcription factor that is essential for the normal development of several endoderm-derived organs, including the prostate gland1,2. FOXA1 is frequently mutated in hormone-receptor-driven prostate, breast, bladder and salivary-gland tumours3-8. However, it is unclear how FOXA1 alterations affect the development of cancer, and FOXA1 has previously been ascribed both tumour-suppressive9-11 and oncogenic12-14 roles. Here we assemble an aggregate cohort of 1,546 prostate cancers and show that FOXA1 alterations fall into three structural classes that diverge in clinical incidence and genetic co-alteration profiles, with a collective prevalence of 35%. Class-1 activating mutations originate in early prostate cancer without alterations in ETS or SPOP, selectively recur within the wing-2 region of the DNA-binding forkhead domain, enable enhanced chromatin mobility and binding frequency, and strongly transactivate a luminal androgen-receptor program of prostate oncogenesis. By contrast, class-2 activating mutations are acquired in metastatic prostate cancers, truncate the C-terminal domain of FOXA1, enable dominant chromatin binding by increasing DNA affinity and-through TLE3 inactivation-promote metastasis driven by the WNT pathway. Finally, class-3 genomic rearrangements are enriched in metastatic prostate cancers, consist of duplications and translocations within the FOXA1 locus, and structurally reposition a conserved regulatory element-herein denoted FOXA1 mastermind (FOXMIND)-to drive overexpression of FOXA1 or other oncogenes. Our study reaffirms the central role of FOXA1 in mediating oncogenesis driven by the androgen receptor, and provides mechanistic insights into how the classes of FOXA1 alteration promote the initiation and/or metastatic progression of prostate cancer. These results have direct implications for understanding the pathobiology of other hormone-receptor-driven cancers and rationalize the co-targeting of FOXA1 activity in therapeutic strategies.


Conflict of interest statement

Competing interests

The authors declare no competing financial interests.

Figures

Extended Data Figure 1
Extended Data Figure 1. Functional essentiality and recurrent alterations of FOXA1 in AR-positive prostate cancer.
AR (a) and FOXA1 (b) mRNA (qPCR) and (c) protein expression in a panel of PCa cells (n=3 technical replicates). Mean ± s.e.m are shown and dots are individual data points. d-f) Growth curves of AR-positive PCa cells treated with non-targeting control (siNC), AR, or FOXA1 targeting siRNAs (25nM at Day 0 and 1; n=6 biological replicates). Immunoblots confirm knockdown of FOXA1 protein in LNCaP and LAPC4 72h after siRNA-treatment. For all gel source data, see Supplementary Figure 1. g) Crystal violet stain of AR-negative, DU145 PCa and LNCaP (control) cells treated with siNC, AR or FOXA1 targeting siRNAs. Results represent 3 independent experiments (n=2 biological replicates). h) Averaged proliferation Z-scores for 6 independent FOXA1-targeting sgRNAs extracted from publically available CRISPR Project Achilles data (BROAD Institute) in prostate and breast cancer cells. HPRT1 and AR data serve as negative and positive controls, respectively. Mean ± s.e.m are shown; dots are proliferative z-score for independent sgRNAs. i) Ranked depletion or enrichment of sgRNA read counts from GeCKO-V2 CRISPR knockout screen in LNCaP cells (at day 30) relative to the input sample. Only a subset of genes, including essential controls, chromatin modifiers and transcription factors, are visualized. j) Recurrence of FOXA1 mutations across TCGA, MSK-IMPACT, and SU2C cohorts. k) Density of breakends (RNA-seq chimeric junctions) within overlapping 1.5Mb windows along chr14 in mCRPC tumors. l) Whole-genome sequencing of 7 mCRPC index cases with distinct patterns FOXA1 translocations (Tlocs) and duplications (Dups), nominated by RNA-seq (WA46, WA37, WA57, MO_1584) or WES (MO_1778, SC_9221, MO_1637). m) Concordance of RNA-seq (chimeric junctions) and WES based FOXA1 locus rearrangements calls (mCRPC cohort). n) Frequency of FOXA1 locus rearrangements in mCRPC based on RNA-seq and WES.
Extended Data Figure 2
Extended Data Figure 2. Genomic characteristics of the three classes of FOXA1 alterations in prostate and breast cancer.
a) Bi-allelic inactivation and b) copy-number variations of FOXA1 across mCRPC (n=371). c) FOXA1 expression in benign (n=51), primary (n=501), and metastatic (n=535) prostate RNA-seq libraries. d) Distribution and functional categorization of FOXA1 mutations (all cases in the aggregate cohort) on the protein map of FOXA1. TAD, trans-activating domain; RD, regulatory domain. e) Aggregate and class-specific distribution of FOXA1 mutations in advanced breast cancer (MSK-Impact cohort). f) Structural classification of FOXA1 locus rearrangements in breast cancer (TCGA and CCLE cell lines). g) Variant allele frequency of FOXA1 mutations by tumor stage, and h) clonality estimates of class1 and class2 mutations in tumor content corrected primary PCa (n=500) and mCRPC (n=370) specimens. i) Mutual exclusivity or co-occurrence of FOXA1 mutations (two-sided Fisher’s exact test). Mutations in AR, WNT, and PI3K were aggregated at the pathway level. ETS, ETS gene fusions; DRD, DNA repair defects and included alterations in BRCA½, ATM and CDK12; MMRD, mismatch repair deficiency (total n=371). j) Mutual exclusivity of ETS and/or SPOP (n=26) aberrations with FOXA1 (n=46) alterations distinguished by class in mCRPC (n=371). k) Co-occurrence of WNT (n=58) and DRD (n=107) pathway alterations with FOXA1 alteration classes in mCRPC (n=371). l) Stage and class-specific increase in FOXA1 expression levels in primary (n=500) and metastatic PCa (n=357). Right: two-sided t-test. Left: two-way ANOVA. For all boxplots: center shows median, box extends from Q1 to Q3, and whiskers span Q1/Q3±1.5xIQR.
Extended Data Figure 3
Extended Data Figure 3. Biophysical and cistromic characteristics of the Class1 FOXA1 mutants.
a) Distribution of class1 mutations on the protein map of FOXA1. b) 3D-structure of FKHD (FOXA3) with visualization of all mutated residues collectively identified as the 3D-mutational hotspot in FOXA1 across cancers. c) DNA-bound 3D structure of FKHD with visualization of all residues shown through crystallography to make direct base-specific contacts with the DNA in FOXA2 and FOXA3 proteins. FKHD; Forkhead domain. d) Representative fluorescent images of nuclei expressing different FOXA1 variants fused to GFP at the C-termini. e, f) FRAP recovery kinetic plots (left) and representative time-lapse images (right) from pre-bleaching (‘Pre’) to 100% recovery (red timestamps) for (e) wing2-altered class1 and (f) truncated class2 mutants (i.e. A287fs and P375fs), respectively (n=6 nuclei/variants; quantified in Fig 2d). White lines indicate the border between bleached and unbleached areas. g) Representative FRAP fluorescence recovery kinetics in the bleached area for indicated FOXA1 variants. t½ line indicates the time to 50% recovery. Colored dots show raw data; superimposed solid curves show a hyperbolic fit with 95% confidence intervals. h) SPT quantification of chromatin bound (slow and fast) and unbound (freely diffusing) particles of WT and class1 FOXA1 variants, and average chromatin dwell times (mean ± s.d.) for the bound fractions (n≥500 particles/variant). i) Diffusion constant histograms of single particles of WT or distinct class1 FOXA1 mutants. Particles were categorized into chromatin bound (slow and fast) or unbound fractions using cutoffs marked by dashed lines (n≥500 particles/variant imaged in 3–5 distinct nuclei). j) Left, mRNA expression (qPCR) of labeled FOXA1 variants in stable, isogenic HEK293 cells (n=3 technical replicates). Right, overlaps between FOXA1 WT and class1 mutant cistromes from these cells (n=2 biological replicates). k) Top de novo motifs identified from the three FOXA1 cistromes from HEK293 cells (HOMER: hypergeometric test). l) mRNA expression (qPCR) of labeled FOXA1 variants in stable, isogenic 22RV1 cells (n=3 technical replicates). For j and l, centers show mean values and lines mark s.e.m. m) Overlap between WT (n=2 biological replicates) and class1 (n=4 biological replicates) cistromes from stable 22RV1 overexpression models. n) Overlap between the FOXA1 WT and AR union cistromes generated from 22RV1 cells overexpressing WT (n=2 biological replicates) or class1 mutant (I176M or R216G; n=2 biological replicates each) FOXA1 variants. o) De novo motif results for the WT or class1 mutant FOXA1 binding sites from PCa cells (HOMER: hypergeometric test). p) Percent of WT or class1 binding sites with perfect match to the core FOXA1 motif (5’-T[G/A]TT[T/G]AC-3’) and q) the consensus FOXA1 motifs identified from these sites. r) Left, Percent of WT or class1 binding sites harboring known motifs of the labelled FOXA1 or AR cofactors; Right, Enrichment of the cofactor motifs in the two cistromes relative to the background (n=top 5000 peaks by score/variant, see Methods). s) Genomic distribution of WT and class1 binding sites in PCa cells.
Extended Data Figure 4
Extended Data Figure 4. Functional impact of FOXA1 mutations on oncogenic AR-signaling.
a) Immunoblot showing expression of endogenous and V5-tagged exogenous FOXA1 proteins in dox-inducible 22RV1 cells transfected with distinct UTR-specific FOXA1 siRNAs (#3–5) or a non-targeting control siRNA (siNC). These results represent 2 independent experiments. Incucyte growth curves of 22RV1 cells overexpressing empty vector (control), WT, or mutant FOXA1 variants upon treatment with UTR-specific FOXA1-targeting siRNAs (n = 5 biological replicates). Mean ± s.e.m are shown. b) Immunoblots confirming stable overexpression of the WT AR protein in HEK293 and PC3 cells. c, d) Co-immunoprecipitation assay of indicated recombinant FOXA1 variants using a V5-tag antibody in (c) HEK293-AR and (d) PC3-AR cells. eGFP is a negative control; FL is the full-length WT FOXA1. d168 and d358 are truncated FOXA1 variants with only the first 168aa (i.e. before the Forkhead domain) or 358aa of FOXA1 protein. H247Q and R261G are missense class1 mutant variants. e) Immunoblots confirming comparable expression of AR and recombinant FOXA1 variants in AR reporter assay-matched HEK293 lysates. Immunoblots show representative results from 2–3 independent experiments and class1 and class2 mutants serve as biological replicates. For all gel source data (a,b-e), see Supplementary Figure 1. f) AR dual-luciferase reporter assays with transient overexpression of indicated FOXA1 variant in HEK293-AR cells with or without DHT stimulation and Enzalutamide treatment (n=3 biological replicates/group). Mean ± s.e.m are shown (two-way ANOVA and Tukey’s test). g) Genes differentially expressed in class1 patient samples (n=38) compared to FOXA1 WT tumors (see Methods). Most significant genes are shown in red and labeled (Limma two-sided test). h) Differential expression of cancer hallmark signature genes in class1 mutant PCa tumors (GSEA statistical test). i) Localized, primary PCa gene signature showing concordance between class1 tumor and primary PCa genes. j) BART prediction of specific TFs mediating observed transcriptional changes. The significant and strong (Z-score) mediators of transcriptional responses in class1 tumors are labeled (BART: Wilcoxon rank-sum test). k) mRNA expression (RNA-Seq) of class1 signature genes in LNCaP and VCaP cells either starved for androgen (no DHT) or stimulated with DHT (10nM). RNA-seq from two distinct PCa cell lines are shown. l) Representative FOXA1 and AR ChIP-Seq normalized signal tracks at the WNT7B or CASP2 gene loci in LNCaP and VCaP cells. ChIP-seq were carried out in two distinct PCa cell lines with similar results. m) Growth curves (IncuCyte) of 22RV1 cells overexpressing distinct FOXA1 variants in complete, androgen-supplemented growth medium (n = 2 biological replicates). Mean ± s.e.m are shown. n) Percent viable 22RV1 stable cells, overexpressing either empty vector, WT, or mutant FOXA1 variants upon treatment with enzalutamide (20 uM for 6 days; n = 4 biological replicates). Mean ± s.e.m are shown. P-values in m and n were calculated using two-way ANOVA and Tukey’s test. o,p) mRNA expression (RNA-Seq) of labeled basal and luminal TFs or canonical markers in FOXA1 WT, class1, or class2 mutant tumors in primary PCa (total n = 500; two-way ANOVA). q) Extent of AR and NE pathway activation in FOXA1 WT, class1, or class2 mutant cases from both primary (n = 500) and metastatic (n = 370) PCa. Both AR and NE scores were calculated using established gene signatures (see Methods. Left, two-sided t-test; right, two-way ANOVA). For all boxplots: center shows median, box marks Q1/Q3, whiskers span Q1/Q3±1.5xIQR.
Extended Data Figure 5
Extended Data Figure 5. DNA-binding dominance of the Class2 FOXA1 mutants.
a) FOXA1 protein maps showing the recombinant proteins used to validate the N-terminal (N-term) and C-terminal (C-term) FOXA1 antibodies. TAD, trans-activating domain; FKDH, Forkhead domain; RD, regulatory domain. b) Immunoblots depicting detection of all variants by the N-term antibody (left), and of only the full-length WT FOXA1 protein by the C-term antibody (right). These results were reproducible in 2 independent experiments. Antibody details are included in the Methods. c) Sanger sequencing chromatograms showing the heterozygous class2 mutation in LAPC4 cells after the P358 codon in Exon2 (n=2 technical replicates). All other tested PCa cell lines were WT for FOXA1. d) Immunoblots confirming the expression of the truncated FOXA1 variant in LAPC4 at the expected ~40kDa size (top, red arrow). The short band is detectable only with the N-term (top) FOXA1 antibody and not the C-term (bottom) antibody. These results were reproducible in 2 independent experiments. e) Co-immunoprecipitation and immunoblotting of FOXA1 using a N-term and C-term antibodies from LAPC4 nuclei with species-matched IgG used as control. f) Nuclear co-immunoprecipitation of FOXA1 from LAPC4 or LNCaP cells stimulated with DHT (10nM for 16h) using N-term and C-term antibodies. Species-matched IgG are controls. Immunoprecipitations and immunoblots in d-f were reproducible in 2 and 3 independent experiments, respectively. For gel source data (b,d,e,f), see Supplementary Figure 1. g) FOXA1 N-term and C-term ChIP-seq normalized signal tracks from FOXA1 WT or class2 mutant PCa cells at canonical AR targets KLK3 and ZBTB10. h) Left, Overlap between global N-term and C-term FOXA1 cistromes in untreated C42B cells. Right, Overlap between global N-term and C-term FOXA1 cistromes in LAPC4 cells treated with DHT (10nM for 3h). i) FOXA1 ChIP-seq normalized signal tracks from N-term and C-term antibodies in LAPC4 cells with or without DHT-stimulation (10nM for 3h) at KLK3 and ZBTB10 locus. ChIP-seqs in g and i were carried out in two distinct FOXA1 WT PCa cells. For LAPC4 ChIP-seqs, results were repreproducible in two independent experiments. j) Left, mRNA (qPCR) expression of FOXA1 in LAPC4 cells with exogenous overexpression of WT FOXA1; Right, in LNCaP cells with exogenous overexpression of the P358fs mutant (n=3 technical replicates). Mean ± s.e.m are shown and dots are individual data values. k) FOXA1 ChIP-seq normalized signal tracks from N-term and C-term antibodies in parental LAPC4 cells and LAPC4 cells overexpressing WT FOXA1 at the KLK3 locus. This experiment was independently repeated twice with similar results. The 60bp AR and FOXA1 bound KLK3 enhancer element used for EMSA is shown.
Extended Data Figure 6
Extended Data Figure 6. DNA-binding affinity and functional essentiality of the Class2 FOXA1 mutants.
a) Immunoblot showing comparable expression of recombinant FOXA1 variants in equal volume of nuclear HEK293 lysates used to perform EMSAs. b) Higher exposure of EMSA with recombinant WT or P358fs mutant and KLK-enhancer element showing the super-shifted band with addition of the V5 antibody (red asterisks; matched to Main Fig. 3f). c, d) EMSA with recombinant WT or different class2 mutants (truncated at 268, 287, 358, 375, and 453aa) and KLK3 enhance element. Class2 mutants display higher affinity vs WT FOXA1. Each class2 mutant serves as a biological replicate and these results were reproducible in two independent experiments. e) DNA association and dissociation kinetics at varying concentrations of purified WT or P358fs class2 FOXA1 mutants from the biolayer-interferometry assay performed using OctetRED system. Overall binding curves and equilibrium dissociation constants (mean± s.d.) are shown. These results were reproducible in 2 independent experiments. f) Sanger sequencing chromatograms from a set of 22RV1 CRISPR clones confirming the introduction of distinct indels in the endogenous FOXA1 allele, resulting in a premature stop codon (n=2 technical replicates). Protein mutations are identified on the right. g) Immunoblots showing the expression of endogenous WT or class2 mutant FOXA1 variants in parental and distinct CRISPR-engineered 22RV1 clones. h) Immunoblots showing expression of FOXA1 (N-term antibody) in parental and CRISPR-engineered LNCaP clones expressing distinct class2 mutants with truncations closer to the Forkhead domain. For gel source data (a,b,c,d,g,h), see Supplementary Figure 1. i) Growth curves of WT or mutant clones upon treatment with the non-targeting or FOXA1-targeting sgRNAs and CRISPR-Cas9 protein (see Methods). For i, distinct class2 clones and distinct sgRNAs serve as biological replicates. j, k) Overlap between union (j) FOXA1 and (k) AR cistromes from WT (n=3 biological replicates) and class2-mutant (n=4 biological replicates) 22RV1 clones. l) Overlap between union FOXA1 and AR cistromes from class2 mutant 22RV1 cells.
Extended Data Figure 7
Extended Data Figure 7. Cistromic and WNT-driven phenotypic characteristics of the Class2 FOXA1 mutants.
a) De novo motif analyses of the WT-specific, common, and class2-specific FOXA1 binding site subsets defined from either (left) sequencing read fold-changes or (right) peak-calling scores of ChIP-seq data in 7a. WT and class2 cistromes were generated from n=3 and n=2 independent biological replicates, respectively. Only the top 5K or 10K peaks from each subset were used as inputs for motif discovery (see Methods; HOMER: hypergeometric test). b) Percent of WT or class2 binding sites with perfect match to the core FOXA1 motif (5’-T[G/A]TT[T/G]AC-3’) and c) the consensus FOXA1 motifs identified from these sites. d) Percent of binding sites in the three FOXA1 binding site subsets harboring known motifs of the labelled FOXA1 or AR cofactors, and e) enrichment of the cofactor motifs in the three binding site subsets relative to the background. f) Genomic distribution of WT-specific, common and class2-specific binding sites in PCa cells. g) Differential expression of genes in FOXA1 class2 mutant CRISPR clones relative to FOXA1 WT clones (n=2 biological replicates (Limma two-sided test). h) Distinct TF motifs within the promoter (2kb upstream) of differentially expressed genes. TFs with the highest enrichment (fold-change, percent of up-regulated genes with the motif, and significance) are highlighted and labeled (two-tailed Fisher’s exact test). i) Immunoblots showing the expression of B-Catenin and Vimentin in a panel of WT and heterozygous or homozygous class2 mutant 22RV1 CRISPR clones. j) Immunoblots showing the phosphorylation status of B-Catenin and expression of direct WNT target genes in select class2 mutant 22RV1 clones. Immunoblots in i) and j) are representative of two independent experiments; every individual clone serves as a biological replicate. For gel source data, see Supplementary Figure 1. k) Representative images of Boyden chambers showing invaded cells stained with Calcein AM dye. l) Quantified fluorescence signal from invaded cells (n=2 biological replicates/group; two-way ANOVA and Tukey’s test). Mean ± s.e.m are shown and dots are individual data points. n) Percent metastasis at day2 and day3 in zebrafish embryos injected with either the normal HEK293 cells (negative controls) or 22RV1 PCa cells virally overexpressing WT, class1, or class2 mutant FOXA1 variants (n>20 for each group). m) Absolutely counts of disseminated cell foci in individual zebrafish embryos as a measure of metastatic burden. o) Fluorescent signal from the invaded WT or class2-mutant 22RV1 cells after androgen starvation (5% charcoal-stripped serum medium for 72h) or treatment with the WNT inhibitor, XAV939 (20μM for 24h; n=2 biological replicates/group; two-way ANOVA and Tukey’s test). Mean ± s.e.m and individual data points are shown.
Extended Data Figure 8
Extended Data Figure 8. Functional association of FOXA1 and TLE3 in prostate cancer.
a) mRNA (qPCR) and protein (immunoblot) expression of TLE3 in a panel of PCa cells. Mean ± s.e.m and individual data points are shown. b) Left, mRNA expression of FOXA1 and TLE3 in LNCaP and VCaP cells treated with siRNAs targeting either FOXA1 or AR (n=3 technical replicates). Two FOXA1 WT PCa cells serve as biological replicates. Mean ± s.e.m and individual data points are shown. Right, protein expression of FOXA1 and TLE3 in matched LNCaP lysates. c) FOXA1 N-terminal ChIP-seq normalized signal tracks from LNCaP, C42B and LAPC4 PCa cells at the TLE3 locus. Each cell line serves as a biological replicate. d) Overlap of the union WT FOXA1 and TLE3 binding sites from LNCaP, C42B and 22RV1 PCa cells (n=1 for each), and top de novo motifs discovered (HOMER: hypergeometric test) in the TLE3 cistrome. e) Co-immunoprecipitation assays of labelled recombinant FOXA1 WT, class1, or class2 variants using a V5-tag antibody in HEK293 cells overexpressing the TLE3 protein. V5-tagged GFP protein was used as a negative control. These results were reproducible in two independent experiments and distinct class1 and class2 mutant serve as biological replicates. f) Overlap of union TLE3 cistromes from isogenic WT (n=2 biological replicates) or heterozygous class2-mutant (n=2 biological replicates) 22RV1 CRISPR clones. g) ChIP peak profile plots from TLE3 ChIP-seq in isogenic FOXA1 WT or class2-mutant 22RV1 clones (n=2 biological replicates each). h) Representative TLE3 and FOXA1 ChIP-seq read signal tracks from independent 22RV1 CRISPR clones with or without endogenous FOXA1 class2 mutation (n=2 biological replicates each). i) Gene set enrichment analyses showing significant enrichment of (left) WNT and (right) EMT pathway genes in 22RV1 cells treated with TLE3-targeting siRNAs (n=2 biological replicates for each treatment; GSEA enrichment test). j) Left, mRNA (RNA-seq) expression of direct WNT target genes in 22RV1 upon siRNA-mediated knockdown of TLE3 (n=2 biological replicates). Right, Immunoblot showing LEF1 up-regulation upon TLE3 knockdown in 22RV1 PCa cells with and without androgen starvation (representative of two independent experiments). For gel source data (a-d,j), see Supplementary Figure 1. k) Gene enrichment plots showing significant enrichment of class2 up-regulated genes upon TLE3 knockdown in 22RV1 cells (n=2 biological replicates for each treatment; GSEA enrichment test).
Extended Data Figure 9
Extended Data Figure 9. Topological, physical, and transcriptional characteristics of the FOXA1 locus in normal tissues and prostate cancer.
a) HI-C data (from: http://promoter.bx.psu.edu/hi-c/view.php) depicting conserved topological domains within the PAX9/FOXA1 syntenic block in normal and FOXA1-positive cancer cell lines. b) Highly tissue-specific patterns of gene expression within the PAX9/FOXA1 syntenic block. Tissues were dichotomized into FOXA1+ and FOXA1- based on FOXA1 expression levels; genes were subject to unsupervised clustering. Z-score normalization was performed for each gene across all tissues. c) Correlation of FOXMIND (Methods) and FOXA1 / TTC6 expression levels across metastatic tissues (n=370; Spearman rank-correlation coefficient). The 95% confidence interval is shown. d) Representative ATAC-seq (n=1) read signal tracks from normal basal epithelial prostate (RWPE1, PNT2) or PCa cells. Cells are grouped based on expression of FOXA1 and differentially pioneered loci are marked with the red boxes. CRISPR sgRNA pairs used for genomic deletion of the labelled elements are shown at the bottom. Distinct FOXA1+ and FOXA1- cell lines serve as biological replicates for ATAC-seq. e) mRNA (qPCR) expression of control, FOXA1 TAD genes, and MIPOL1 in VCaP cells treated with CRISPR-sgRNA pairs targeting a control site (sgCTRL), the FOXMIND, or the MIPOL1-UTR regulatory element (see Extended Data Fig. 2c for sgRNA binding sites). Distinct sgRNA pairs cutting at FOXMIND serve as biological replicates. Mean ± s.e.m are shown (n=3 technical replicates; two-way ANOVA and Tukey’s test). f) Distribution of tandem duplication and translocation breakends (chimeric junctions or copy-number segment boundaries) focused at the FOXMIND-FOXA1 regulatory domain. g) Outlier expression of genes involved in translocations with the FOXA1 locus. Translocations positioning a gene between FOXMIND and FOXA1 (Hi-jacking) are shown on top (red). Translocations positioning a gene upstream of the FOXA1 promoter (Swapping) are shown on the bottom (blue). h) Inferred duplications within the FOXA1 locus based on RNA-seq (tandem breakends) and WES (copy-gains) zoomed-in at the FOXA1 TAD.
Extended Data Figure 10
Extended Data Figure 10. Transcriptional and genomic characteristics of Class3 FOXA1 rearrangements in prostate cancer.
a) Dosage sensitivity of the FOXA1 gene. Expression of FOXA1 (RNA-seq) across mCRPC tumors (n=370) as a function of gene ploidy (as determined by absolute copy number at the FOXA1 locus (two-way ANOVA). b) Relative expression of FOXA1 (within the minimally amplified region) to TTC6 (outside the amplified region) in rearranged (n=50) (duplication or translocation) vs WT (n=320) FOXA1 loci (two-sided t-test). All boxplot center shows median, box marks Q1/Q3, whiskers span Q1/Q3±1.5xIQR. c) Association plot visualizing the relative enrichment of cases with both translocation and duplications within the FOXA1 locus (n=370). Over-abundance of cases with both events is quantified using Pearson-residuals. Significance of this association is based on the Chi-square test without continuity correction. Tloc, translocation; inv, inversion; del, deletion. d) FOXA1 locus visualization of linked-read (10X platform) whole genome-sequencing of the MDA-PCA-2B cell line. Alignments on the haplotype-resolved genome are shown in green and purple. Translocation and tandem-duplication calls are indicated in blue and red, respectively. e) Monoallelic expression of FOXA1 cell-lines with FOXMIND-ETV1 translocations in MDA-PCA-2b (n=6 biological replicates) and LNCaP (n=15 biological replicates). Phasing of FOXA1 SNPs to structural variants is based on linked-read sequencing (Methods). f) Biallelic expression of RNA from the FOXMIND locus assessed using three distinct SNPs in MDA-PCa-2b cells that harbor ETV1 translocation into the FOXA1 locus (n=7 biological replicates). g) mRNA (qPCR) expression of ETV1 and TTC6 upon sgRNA-mediated disruption of the FOXMIND or the MIPOL1-UTR enhancer in LNCaP cells, which also harbor ETV1 translocation into the FOXA1 locus (see Extended Data Fig. 9d for sgRNA binding sites). Distinct sgRNA pairs cutting at FOXMIND serve as biological replicates. Mean ± s.e.m are shown (n=3 technical replicates; two-way ANOVA and Tukey’s test).
Figure 1
Figure 1. Distinct structural classes of FOXA1 aberrations.
a) FOXA1 mutations and key alterations in mCRPC. Mutations in ETS, AR, WNT, PI3K, DNA repair (DRD) were aggregated at the pathway/group level. b) Locus-level recurrence of RNA-seq structural variations (SVs). c) Structural classification of FOXA1 mutations. TAD, transactivation domain; Forkhead, Forkhead DNA-binding domain; RD, regulatory domain d) Structural classification of FOXA1 locus rearrangements. Dups, Tandem duplications; Tlocs, translocations; Invs, inversions; Dels, deletions. e) Frequency of FOXA1 mutational classes by PCa stage (n=888 primary, 658 metastatic) (two-sided Fisher’s exact test; tFET). f) Variant allele frequency by stage and class (two-sided t-test). Boxplot center: median, box: Q1/Q3, whiskers: Q1/Q3±1.5xIQR. g) Locus-level recurrence of SVs based on RNA-seq by PCa stage (tFET). h) Integrated (RNA-seq and WES) recurrence of FOXA1 alterations classes in mCRPC (SU2C-MCTP, n=370).
Figure 2
Figure 2. Functional characterization of Class1 mutations of FOXA1.
a) Distribution of class1 mutations on the protein map of FOXA1 functional domains and FKHD secondary structures. b) Crystal structure of the FKHD with visualization of non-Wing2 (i.e. outside of 247–269aa) mutations. 3D-hotspot mutations are in red. c) FRAP kinetic plots (left) and representative time-lapse images from pre-bleaching to the equilibrated state (n=6 biological replicates). Images are uniformly brightened for signal visualization. d) FRAP durations till 50% recovery (n=6 nuclei/variant). e) AR reporter activity with overexpression of FOXA1 variants and DHT stimulation (n=3 biological replicates). f) Growth (IncuCyte) of 22RV1 cells overexpressing FOXA1 variants in androgen-depleted medium (n=5 biological replicates). In d-f, means ± s.e.m are shown, and p-values are from two-way ANOVA and Tukey’s test. g) Relative expression of luminal and basal markers in class1 (n=38) tumors compared with WT (n=457), SPOP (n=48), and ETS (n=243) primary PCa tumors. h) Class1 model: Wing2-disrupted FOXA1 shows increased chromatin mobility and chromatin sampling frequency, resulting in stronger transcriptional activation of oncogenic AR-signaling. FKRE, forkhead responsive element; ARE, androgen responsive element.
Figure 3
Figure 3. Functional characterization of Class2 mutations of FOXA1.
a) Class2 mutations and antibody epitopes on the protein map of FOXA1. b) N-term and C-term FOXA1 cistromes in PCa cells that are (right) untreated or (left) have exogenous overexpression of FOXA1 variants. c) Electromobility shift of FOXA1 variants bound to the KLK3-enhancer (n=3 biological replicates). For gel source data, see Supplementary Figure 1. d) FOXA1 ChIP-seq read-density heatmaps in independent class2-mutant 22RV1 CRISPR clones. e) Growth of class2-mutant 22RV1 clones treated with non-targeting (siNC), AR or FOXA1 targeting siRNAs (n=5 biological replicates; two-way ANOVA and Tukey’s test). Mean ± s.e.m. are shown. f) Left, Metastasis frequency in zebrafish embryos injected with HEK293 (negative control), WT, or class2-mutant 22RV1 clones (n≥30 embryos/group); Right, representative embryo images showing the disseminated PCa cells. g) Overlap of WT FOXA1 and TLE3 binding sites in 22RV1 CRISPR clones (n=2 biological replicates each). h) TLE3 ChIP-seq read-density heatmaps in two distinct FOXA1 WT and class2-mutant 22RV1 clones. i) Class2 model: Truncated FOXA1 shows dominant chromatin binding and displaces WT FOXA1 and TLE3 from the chromatin, resulting in increased WNT-signaling. FKRE, forkhead responsive element; ARE, androgen responsive element.
Figure 4
Figure 4. Genomic characterization of Class3 rearrangements of the FOXA1 locus.
a) Breakends in relation to the FOXA1 syntenic, topological, and regulatory domains. b) Representative functional genomic tracks at the FOXA1 locus. Base level conservation (Cons), DNA accessibility (ATAC), enhancer-associated histone modifications (H3K27me1 and H3K27Ac), CTCF chromatin binding, and stranded RNA-seq read densities are visualized. FOXMIND enhancer is highlighted. c) Structural patterns of translocations and duplications. Hijacks occur between FOXMIND and FOXA1; swaps occur upstream of FOXA1. Duplications amplify the highlighted FOXMIND-FOXA1 regulatory domain. d) Transcriptional changes in FOXA1 TAD gene in locus WT (n=320) and rearranged (n=50) cases (two-sided t-test). Boxplot center: median, box: Q1/Q3, whiskers: Q1/Q3±1.5xIQR. e) Class3 model: Tandem duplications within the FOXA1 TAD amplify FOXMIND to drive FOXA1 overexpression.

Comment in

References

    1. Gao N et al. Forkhead box A1 regulates prostate ductal morphogenesis and promotes epithelial cell maturation. Development 132, 3431–3443 (2005). - PubMed
    1. Friedman JR & Kaestner KH The Foxa family of transcription factors in development and metabolism. Cell. Mol. Life Sci 63, 2317–2328 (2006). - PMC - PubMed
    1. The Cancer Genome Atlas Research Network. Comprehensive molecular characterization of urothelial bladder carcinoma. Nature 507, 315 (2014). - PMC - PubMed
    1. Robinson D et al. Integrative clinical genomics of advanced prostate cancer. Cell 161, 1215–1228 (2015). - PMC - PubMed
    1. Cancer Genome Atlas Research Network. The Molecular Taxonomy of Primary Prostate Cancer. Cell 163, 1011–1025 (2015). - PMC - PubMed

Publication types