. 2019 Dec;56(12):8392-8407.
doi: 10.1007/s12035-019-01673-y. Epub 2019 Jun 26.

Neurovascular Drug Biotransformation Machinery in Focal Human Epilepsies: Brain CYP3A4 Correlates with Seizure Frequency and Antiepileptic Drug Therapy

Affiliations

Neurovascular Drug Biotransformation Machinery in Focal Human Epilepsies: Brain CYP3A4 Correlates with Seizure Frequency and Antiepileptic Drug Therapy

Sherice Williams et al. Mol Neurobiol. 2019 Dec.

Abstract

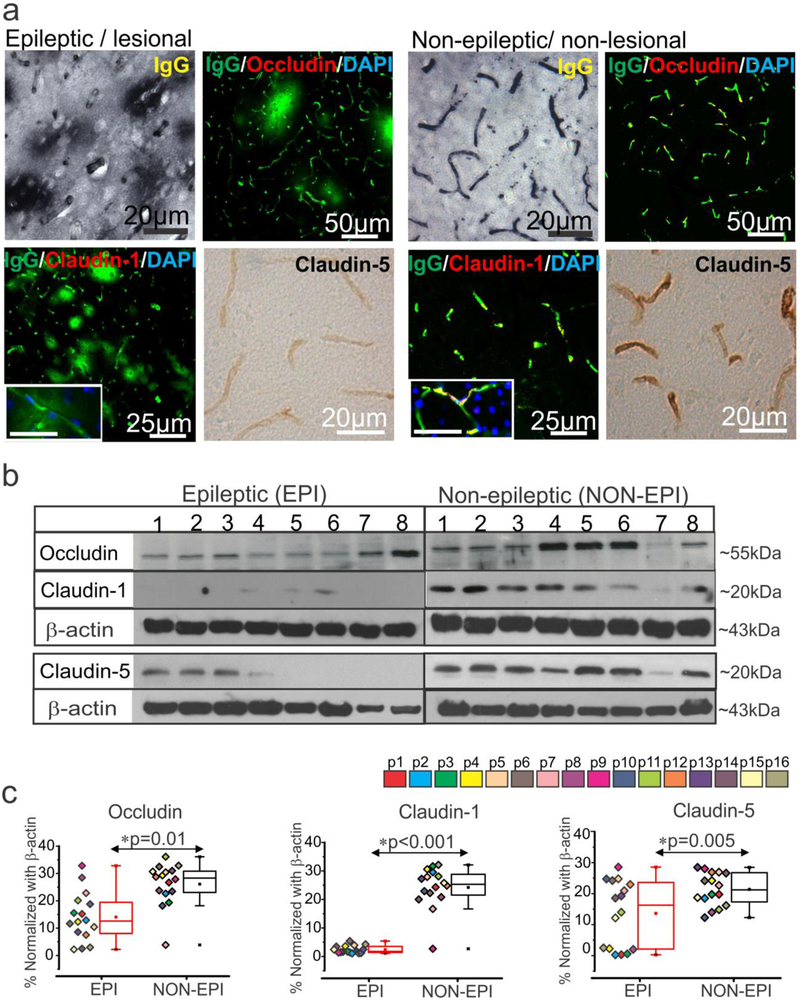
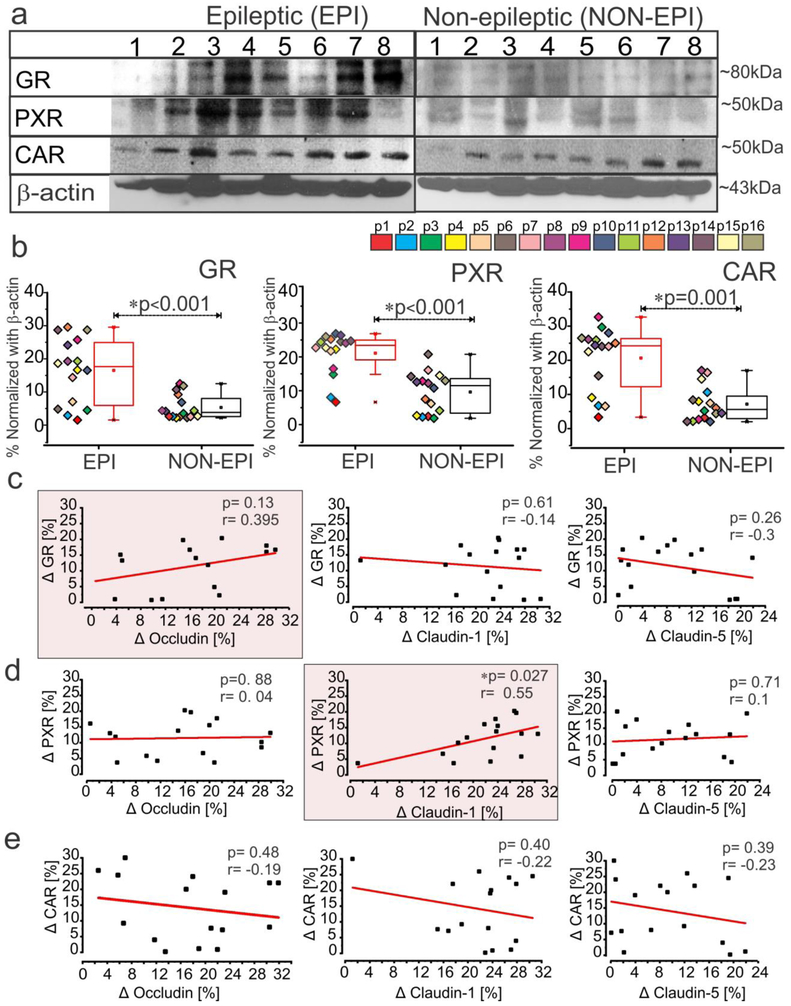
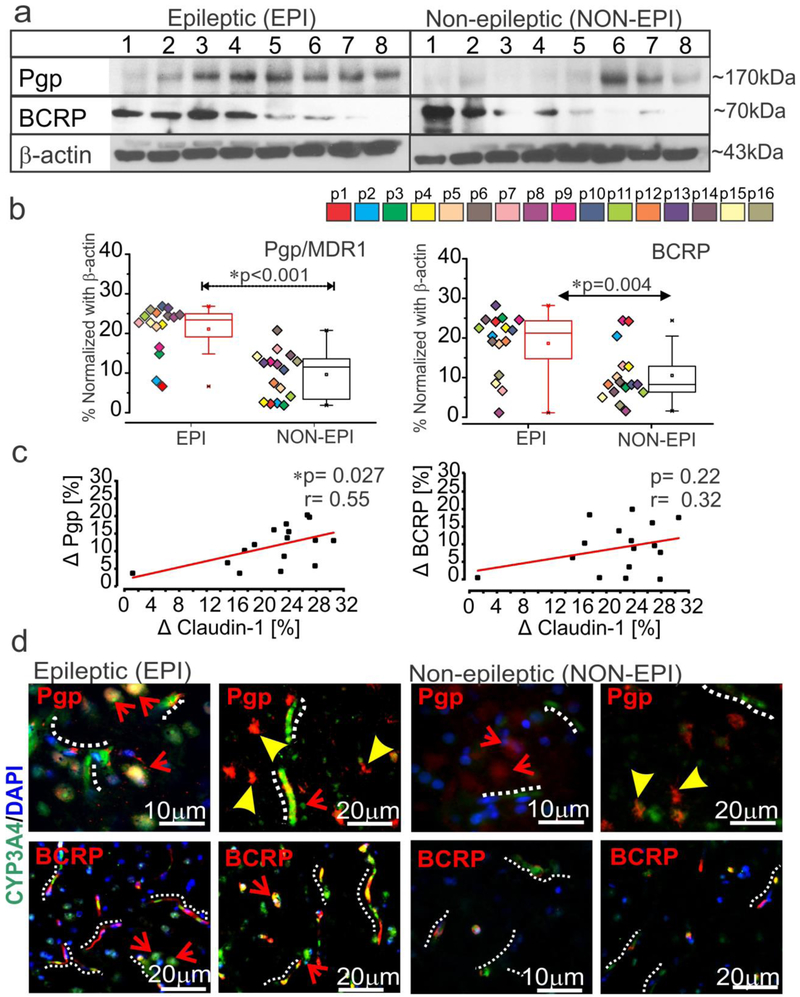
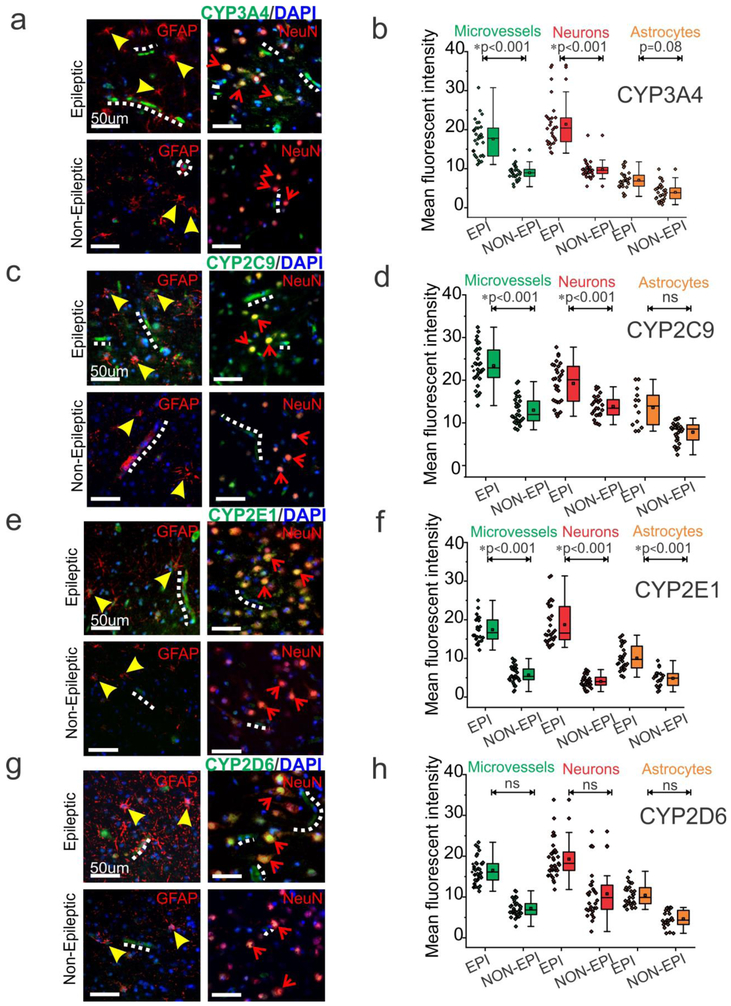
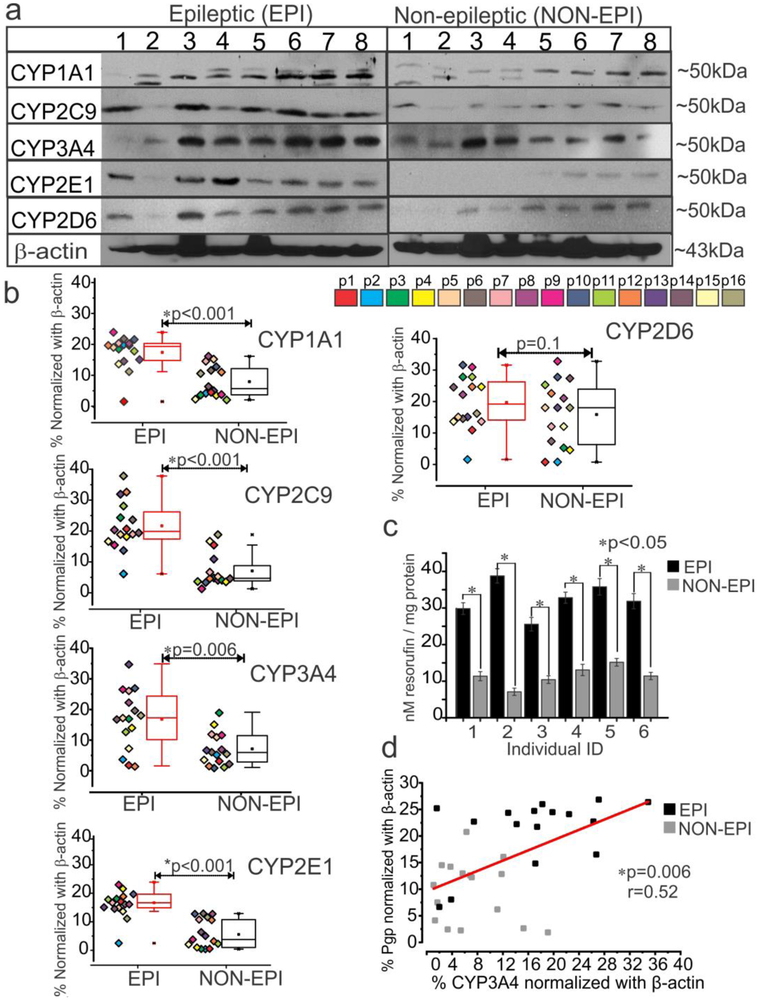
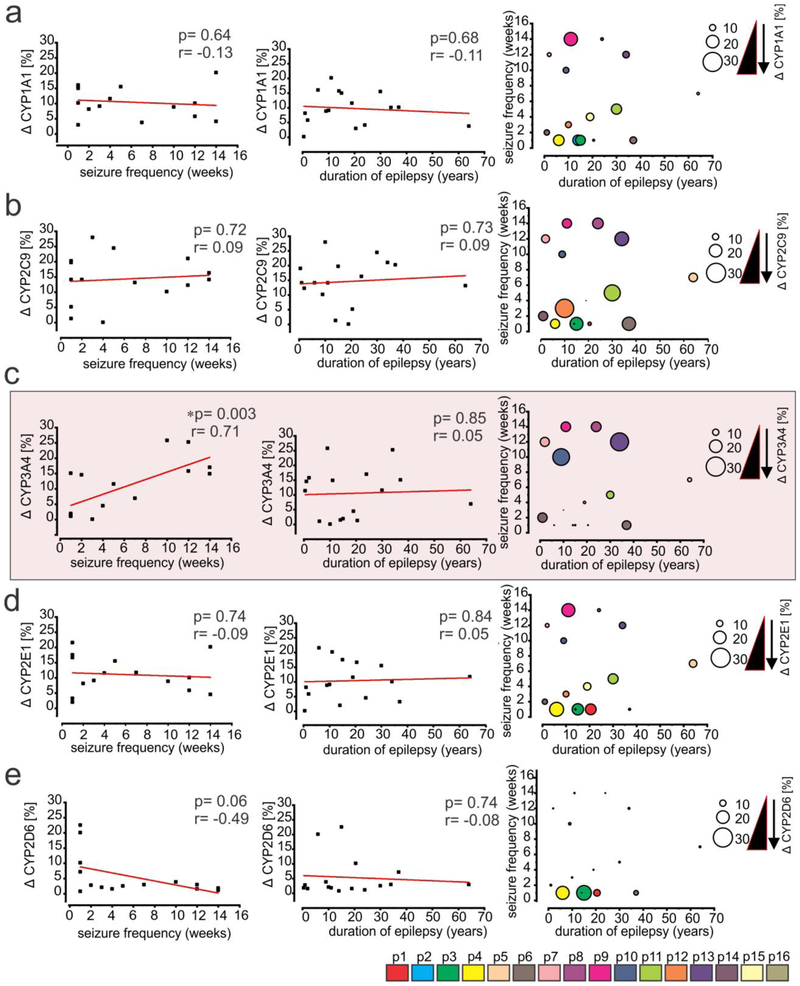
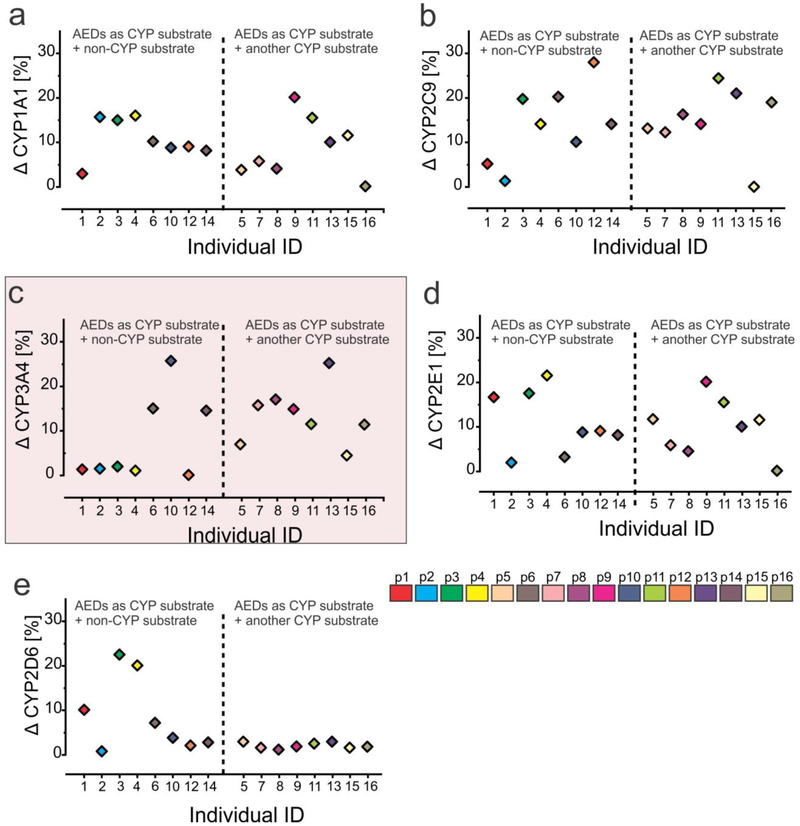
Pharmacoresistance is a major clinical challenge for approximately 30% of patients with epilepsy. Previous studies indicate nuclear receptors (NRs), drug efflux transporters, and cytochrome P450 enzymes (CYPs) control drug passage across the blood-brain barrier (BBB) in drug-resistant epilepsy. Here, we (1) evaluate BBB changes, neurovascular nuclear receptors, and drug transporters in lesional/epileptic (EPI) and non-lesional/non-epileptic (NON-EPI) regions of the same brain, (2) examine regional CYP expression and activity, and (3) investigate the association among CYP brain expression, seizure frequency, duration of epilepsy, and antiepileptic drug (AED) combination. We used surgically resected brain specimens from patients with medically intractable epilepsy (n = 22) where the epileptogenic loci were well-characterized by invasive and non-invasive methods; histology confirmed distinction of small NON-EPI regions from EPI tissues. NRs, transporters, CYPs, and tight-junction proteins were assessed by western blots/immunohistochemistry, and CYP metabolic activity was determined and compared. The relationship of CYP expression with seizure frequency, duration of epilepsy, and prescribed AEDs was evaluated. Decreased BBB tight-junction proteins accompanied IgG leakage in EPI regions and correlated with upregulated NR and efflux transporter levels. CYP expression and activity significantly increased in EPI compared to NON-EPI tissues. Change in EPI and NON-EPI CYP3A4 expression increased in patients taking AEDs that were CYP substrates, was downregulated when CYP- and non-CYP-substrate AEDs were given together, and correlated with seizure frequency. Our studies suggest focal neurovascular CYP-NR-transporter alterations, as demonstrated by the relationship of seizure frequency and AED combination to brain CYP3A4, might together impact biotransformation machinery of human pharmacoresistant epilepsy.

Keywords: Antiepileptic drugs; Blood-brain barrier; Cytochrome P450; Multiple drug transporters; Nuclear receptors; Pharmacoresistant epilepsy.


Conflict of interest statement

Disclosure

J.G.M. has conflict of interest with Zimmer Biomet, Cleveland. I.N. serves on the Speaker’ bureau and as a member of ad hoc advisory board for Eisai, Inc. E.P. received speaker’s or consultancy fees from Axovant, Biogen, Eisai, GW Pharma, Sanofi, Takeda, UCB Pharma and Xenon Pharma. None of the other authors has any potential conflict of interest to disclose. We confirm that we have read the Journal's position on issues involved in ethical publication and affirm that this report is consistent with those guidelines.

Figures

Fig. 1
Fig. 1
BBB leakage and decrease in tight-junction proteins expression predominates in the epileptogenic region. (a) Representative images of immunostaining shows increase in IgG extravagation to the brain parenchyma across the brain vasculature and a corresponding decrease in expression of the tight-junction proteins claudin-1, claudin-5, and occludin in EPI/lesional region (n = 6, in triplicates) compared to NON-EPI /non-lesional region. Inset scale bars represents 20 μm. (b, c) Western blot analysis confirms decrease in the level of tight-junction protein expression, occludin (*p = 0.01), claudin-1 (*p < 0.001) and claudin-5 (*p = 0.005) in brain tissue specimens obtained from EPI vs. NON-EPI regions. Representative westerns depicting expression of tight-junction proteins (n = 8 subjects) with β-actin used as loading control (b). Densitometries for individual protein bands (from n = 16 subjects, with color codes p1-p16 depicting each subject) normalized with β-actin (c). Results are expressed as mean ± SEM by non-parametric analysis for paired samples Wilcoxon signed rank test for direct comparison of two population of data.
Fig. 2
Fig. 2
Increased expression of nuclear receptors, GR, PXR and CAR in epileptic region selectively correlates to tight-junction proteins. (a, b) Representative western blots for individual proteins (a) and corresponding densitometric analysis (b) shows a significant increase in GR (*p < 0.001), PXR (*p < 0.001) and CAR expression (*p = 0.001) in EPI regions compared to NON-EPI (n = 16 subjects). Non-parametric analysis for paired samples Wilcoxon signed rank test was performed for direct comparison of two population of data set obtained. Results are expressed as mean ± SEM. (c-e) The association between the EPI to NON-EPI difference in observed expression (Δ) of nuclear receptors GR, PXR and CAR to tight-junction proteins occludin, claudin-1 and claudin-5 is explored within individual subjects (n = 16). Change in GR percentage trended towards a relationship (p = 0.13, r = 0.395) with the change in occludin levels in EPI vs NON-EPI (c); however change in PXR within EPI and NON-EPI regions has a direct correlation to claudin-1 in the same areas (*p = 0.027, r = 0.55), which is statistically significant (d). CAR levels did not correlate with tight-junction proteins (occludin, p = 0.48, r = −0.19; claudin-1, p = 0.40, r = −0.22; claudin-5, p = 0.39, r = −0.23) within the specimens analyzed. The linear correlation (Pearson’s co-efficient, r) for each comparison was determined by one-way ANOVA.
Fig. 3
Fig. 3
Elevated drug efflux transporters co-localize with CYP3A4 and correlate with claudin-1 expression in the epileptic brain. (a-b) Analysis of the brain tissue showing (a) representative western blots (n = 8 subjects) and densitometric quantification normalized with β-actin (b). A significant increase was noted in P-gp (*p < 0.001) and BCRP (*p = 0.004) in EPI vs. NON-EPI region (n = 16 subjects). Non-parametric analysis for paired samples Wilcoxon signed rank test was performed for direct comparison of two population of data set obtained. Results are expressed as mean ± SEM. (c) A positive correlation between the differences between EPI and NON-EPI claudin-1 expression and that of the drug efflux transporter P-gp (*p = 0.027, r = 0.55) was observed within the specimens analyzed (n = 16) by one-way ANOVA. The association between claudin-1 and BCRP (p = 0.22, r = 0.32) failed statistical significance. The percent difference in protein expression between EPI and NON-EPI regions is indicated by Δ. (d) Representative immunostaining of the brain sections show increased CYP3A4 and P-gp/BCRP in the micro-capillaries and neurons of EPI compared to NON-EPI regions (n = 6, in triplicates). Note: micro-capillaries are indicated with dotted white-lines; astrocytes with arrowheads and neurons with arrows. Nuclei are stained with DAPI.
Fig. 4
Fig. 4
CYP distribution in the endothelial cells, neurons and astrocytes in epileptic brain. (a, c, e, g) Representative images of resected tissues shows increased expression of CYP in the EPI brain BBB interface and neurons compared to NON-EPI brain tissue (n = 6, in triplicates). (b, d, f, h) Quantification of immunohistochemistry indicating increased CYP isoform expression in EPI compared to NON-EPI tissue. Elevated CYP3A4 levels were found in the microvessels (*p < 0.001), neurons (*p < 0.001), and minimally in astrocytes (p = 0.08). Similarly, CYP2C9 is overexpressed in the microvessels (*p < 0.001) and neurons (*p < 0.001); and CYP2E1 in the microvessels (*p < 0.001), neurons (*p < 0.001), and astrocytes (*p < 0.001). However, CYP2D6 showed non-significant (ns) difference in these cell types among EPI and NON-EPI brain regions. Non-parametric analysis for paired samples Wilcoxon signed rank test was performed for direct comparison of two population of data set obtained. Results are expressed as mean ± SEM. Note: micro-capillaries are indicated with dotted white-lines; astrocytes with arrowheads and neurons with arrows. Nuclei are stained with DAPI.
Fig. 5
Fig. 5
Expression and functional relevance of CYP in the epileptic regions of the brain. (a, b) Representative western blots of (a) CYP isoform expression and densitometric (b) quantification normalized by β-actin. The majority of CYPs (CYP1A1, *p < 0.001; CYP2C9, *p < 0.001; CYP3A4, *p = 0.006 and CYP2E1, *p < 0.001) were overexpressed in EPI regions compared to NON-EPI (n = 16 subjects) counterparts. In contrast, CYP2D6 expression remained unaltered (p = 0.1) in both regions. Results are expressed as mean ± SEM (by Wilcoxon signed rank test). (c) Increased CYP contribution in metabolic conversion of 7-ethoxyresorufin to resorufin was evident in the epileptic brain region (*p < 0.05, n = 6). (d) An apparent direct correlation between levels of P-gp and CYP3A4 expression (*p = 0.006, r = 0.52) was identified in the EPI and NON-EPI regions among the subject cohort. The linear correlation (Pearson’s co-efficient, r) for this comparison was determined by one-way ANOVA.
Fig. 6
Fig. 6
CYP3A4 expression in the epileptic brain correlates with seizure frequency. (a-e) Differences in CYP isoform expression between EPI and NON-EPI tissues (Δ) were associated with individual subject seizure frequency and duration of epilepsy. A direct correlation between the percent change in CYP3A4 expression (c) in EPI and NON-EPI brain regions (n = 16 subjects) vs. respective seizure frequency was observed in the same subjects (*p < 0.003, r = 0.71). However, non-significant correlations were obtained for (a) CYP1A1 (p = 0.64; r = −0.13); (b) CYP2C9 (p = 0.72; r = 0.09); and (d) CYP2E1 (p = 0.74; r = −0.09). Within the subjects analyzed no association was noticed between CYP isoforms and duration of epilepsy (a) CYP1A1 (p =0.68; r = −0.11); (b) CYP2C9 (p = 0.73; r = 0.09); (c) CYP3A4 (p = 0.85; r = 0.05); (d) CYP2E1 (p = 0.84; r = 0.05); (e) CYP2D6 (p = 0.74; r = −0.08). The bubble graph with dot plot (in the right, a-e) shows the distribution pattern of CYP isoforms together with seizure frequency and duration of epilepsy. The plot suggests that with the same duration of epilepsy, the increase in seizure frequency was exclusively associated with the increased change in CYP3A4 levels between EPI and NON-EPI regions (c; indicated by the different size circle). This trend was absent in case of CYP1A1 (a) and CYP2C9 (b) and somewhat reversed for CYP2E1 (d) and CYP2D6 (e). The linear correlation (Pearson’s co-efficient, r) for each comparison was determined by one-way ANOVA. Asterisks indicate p < 0.05.
Fig. 7
Fig. 7
CYP3A4 expression changes in epileptic brain with antiepileptic drug combination used. (a-b) The percentage change in CYP1A1 (Δ CYP1A1) in EPI vs NON-EPI is increased irrespective of antiepileptic drug (AED) combination used, whether CYP substrate dependent or not. Similar pattern was observed in case of CYP2C9 among the specimens analyzed (n = 16) (b). (c) In the same subjects, a single CYP substrate AED given alone or with another non-CYP substrate resulted in a decreased change of CYP3A4 expression (Δ CYP3A4 [%]; 5/8). However, EPI CYP3A4 expression was increased in 7/8 subjects, compared to the corresponding NON-EPI regions, when multiple AEDs, including two or more CYP substrates, were given in combination, (d) Change of CYP2E1 (Δ CYP2E1 [%]) expression remains consistently high despite drug combination, reflecting a pattern similar to CYP1A1 (a). (e) Consistently low level of CYP2D6 (Δ CYP2D6 [%]) was noticed with negligible association to drug combination in these subjects.

Similar articles

Cited by

References

    1. Krauss GL, Sperling MR (2011) Treating patients with medically resistant epilepsy. Neurol Clin Pract 1(1):14–23. doi: 10.1212/CPJ.0b013e31823d07d1 - DOI - PMC - PubMed
    1. Kwan P (2011) Defining drug-resistant epilepsy. Neurology Asia 16: 67–69.
    1. Zanger UM, Schwab M (2013) Cytochrome P450 enzymes in drug metabolism: Regulation of gene expression, enzyme activities, and impact of genetic variation. Pharmacol Ther 138(1):103–141. doi: 10.1016/j.pharmthera.2012.12.007. - DOI - PubMed
    1. Johannessen SI, Landmark CJ (2010) Antiepileptic drug interactions - principles and clinical implications. Curr Neuropharmacol 8(3):254–267. doi: 10.2174/157015910792246254 - DOI - PMC - PubMed
    1. Perucca E (2006) Clinically relevant drug interactions with antiepileptic drugs. Br J Clin Pharmacol 61(3):246–255. doi: 10.1111/j.1365-2125.2005.02529.x - DOI - PMC - PubMed

MeSH terms