. 2019 Oct 1;40(14):4279-4286.
doi: 10.1002/hbm.24701. Epub 2019 Jun 26.

Characterization of a temporoparietal junction subtype of Alzheimer's disease

Affiliations

Characterization of a temporoparietal junction subtype of Alzheimer's disease

François Meyer et al. Hum Brain Mapp. .

Abstract

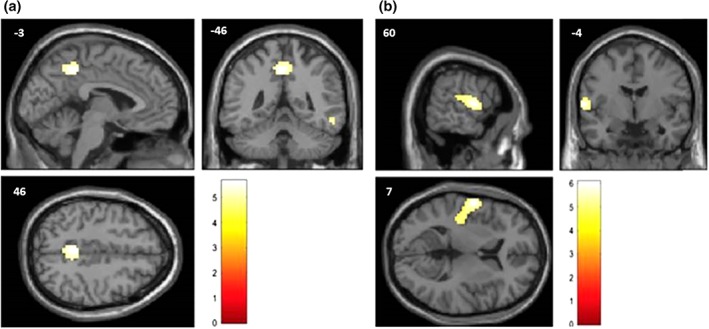
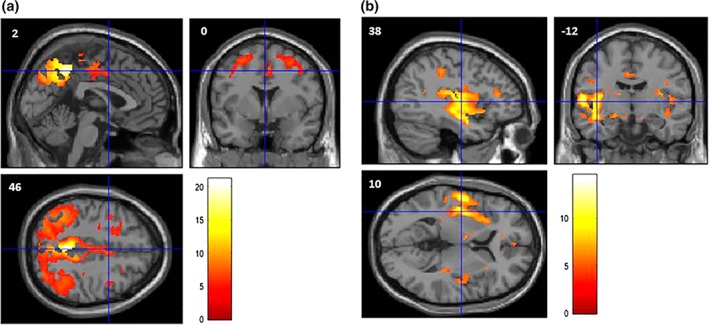
Alzheimer's disease (AD) subtypes have been described according to genetics, neuropsychology, neuropathology, and neuroimaging. Thirty-one patients with clinically probable AD were selected based on perisylvian metabolic decrease on FDG-PET. They were compared to 25 patients with a typical pattern of decreased posterior metabolism. Tree-based machine learning was used on those 56 images to create a classifier that was subsequently applied to 207 Alzheimer's Disease Neuroimaging Initiative (ADNI) patients with AD. Machine learning was also used to discriminate between the two ADNI groups based on neuropsychological scores. Compared to AD patients with a typical precuneus metabolic decrease, the new subtype showed stronger hypometabolism in the temporoparietal junction. The classifier was able to distinguish the two groups in the ADNI population. Both groups could only be distinguished cognitively by Trail Making Test-A scores. This study further confirms that there is more than a typical metabolic pattern in probable AD with amnestic presentation.

Keywords: Alzheimer; FDG-PET; machine learning; neuroimaging; subtypes.


Figures

Figure 1
Figure 1
Representation, on a standard structural magnetic resonance (MR) image, of the cortical regions showing a significant metabolic decrease (measured with FDG‐PET) in the typical group (a) and the TPJ subtype group (b) compared to the control group, using the age as a nuisance variable. The regions, represented in the MNI space, are mostly posterior associative cortices. Color scale represents t‐value ((a, degree of freedom = 36; b, degree of freedom = 42)
Figure 2
Figure 2
(a) Representation, on a standard structural MRI, of the cortical regions showing a significant metabolic decrease in the typical group compared to the TPJ subtype group, using the age as a nuisance variable. The regions, represented in the MNI space, are mostly the precuneus and the right latero‐inferior temporal cortex. (Table 2). (b) Representation, on a standard structural MRI, of the cortical regions showing a significant metabolic decrease in the TPJ subtype group compared to the typical group, using the age as a nuisance variable. The region, represented in the MNI space, is mostly the parieto‐temporal junction. (Table 2). Color scale represents t‐value (degree of freedom = 55)
Figure 3
Figure 3
Interregional metabolic correlations, between peak voxel values of the most discriminant regions taken as “seed regions” (obtained in the GIGA‐CRC population) and metabolism in the other regions of the brain, in the ADNI population, with p‐value <.05 (FWER corrected). MNI space. Color scale represents t‐value (degree of freedom = 205). (a) In the “Typical” group, activity in the left precuneus correlates with metabolism in parietal and premotor regions. (b) In the “TPJ subtype” group, activity in the left temporoparietal junction correlates with metabolism in perisylvian regions

References

    1. Alladi, S. , Xuereb, J. , Bak, T. , Nestor, P. , Knibb, J. , Patterson, K. , & Hodges, J. R. (2007). Focal cortical presentations of Alzheimer's disease. Brain, 130(Pt 10), 2636–2645. 10.1093/brain/awm213 - DOI - PubMed
    1. Andrews‐Hanna, J. R. , Reidler, J. S. , Sepulcre, J. , Poulin, R. , & Buckner, R. L. (2010). Functional‐anatomic fractionation of the brain's default network. Neuron, 65(4), 550–562. 10.1016/j.neuron.2010.02.005 - DOI - PMC - PubMed
    1. Bokde, A. L. , Pietrini, P. , Ibanez, V. , Furey, M. L. , Alexander, G. E. , Graff‐Radford, N. R. , … Horwitz, B. (2001). The effect of brain atrophy on cerebral hypometabolism in the visual variant of Alzheimer disease. Archives of Neurology, 58(3), 480–486. - PubMed
    1. Breiman, L. (2001). Random forests. Machine Learning, 45(1), 5–32.
    1. Ferreira, D. , Verhagen, C. , Hernandez‐Cabrera, J. A. , Cavallin, L. , Guo, C. J. , Ekman, U. , … Westman, E. (2017). Distinct subtypes of Alzheimer's disease based on patterns of brain atrophy: Longitudinal trajectories and clinical applications. Scientific Reports, 7, 46263 10.1038/srep46263 - DOI - PMC - PubMed

Publication types