. 2019 Nov;286(21):4261-4277.
doi: 10.1111/febs.14973. Epub 2019 Jul 12.

Light-induced complex formation of bacteriophytochrome RpBphP1 and gene repressor RpPpsR2 probed by SAXS

Affiliations

Light-induced complex formation of bacteriophytochrome RpBphP1 and gene repressor RpPpsR2 probed by SAXS

Miroslav Z Papiz et al. FEBS J. 2019 Nov.

Abstract

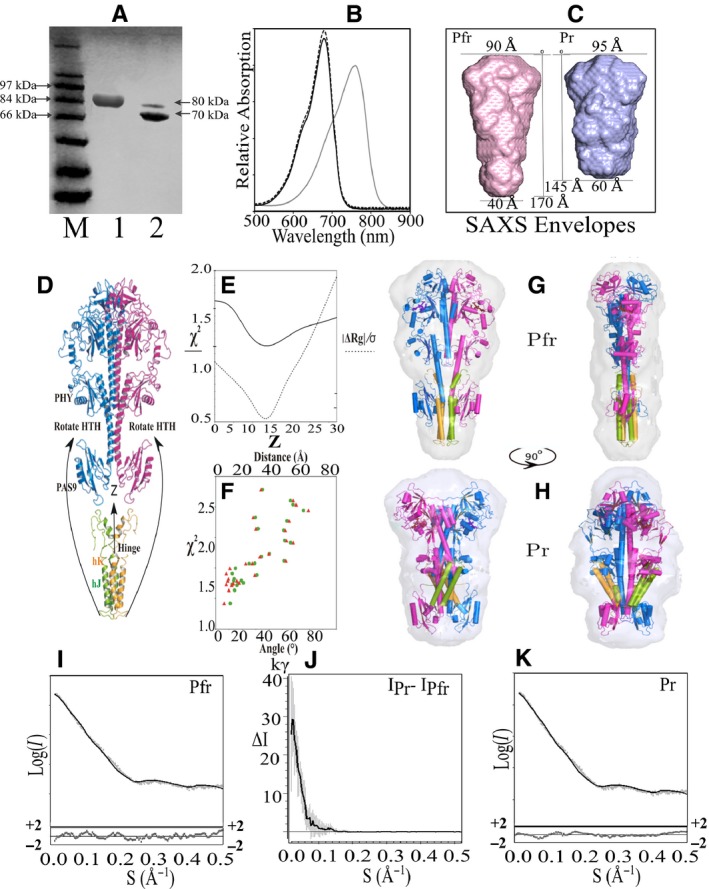
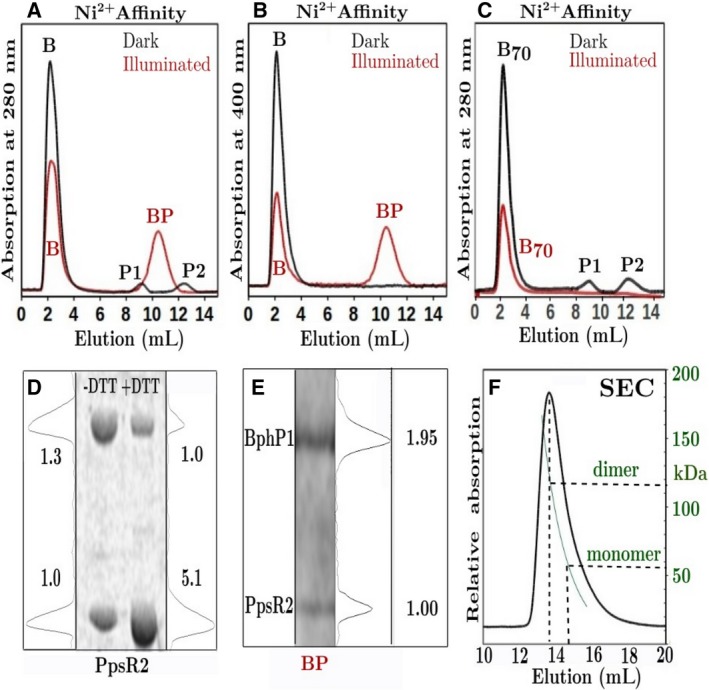
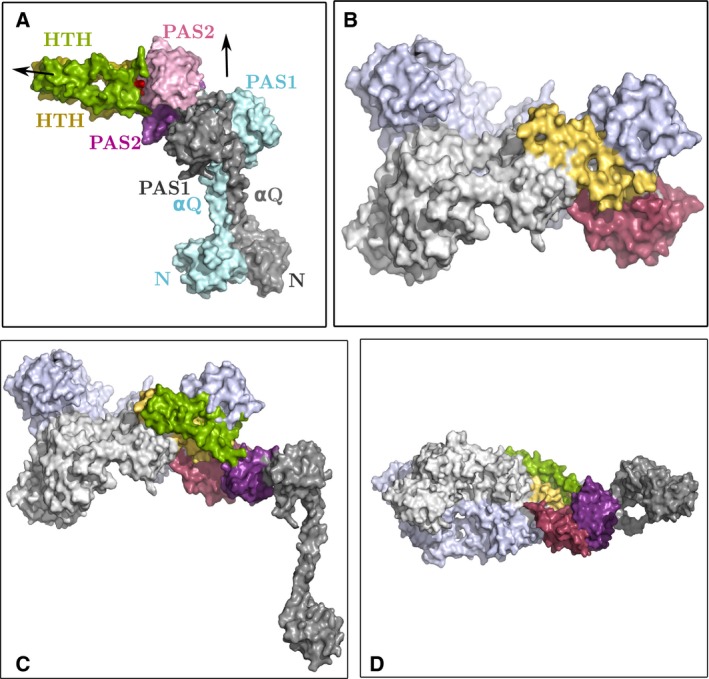
Bacteriophytochrome proteins (BphPs) are molecular light switches that enable organisms to adapt to changing light conditions through the control of gene expression. Canonical type 1 BphPs have histidine kinase output domains, but type 3 RpBphP1, in the bacterium Rhodopseudomonas palustris (Rps. palustris), has a C terminal PAS9 domain and a two-helix output sensor (HOS) domain. Type 1 BphPs form head-to-head parallel dimers; however, the crystal structure of RpBphP1ΔHOS, which does not contain the HOS domain, revealed pseudo anti-parallel dimers. HOS domains are homologs of Dhp dimerization domains in type 1 BphPs. We show, by applying the small angle X-ray scattering (SAXS) technique on full-length RpBphP1, that HOS domains fulfill a similar role in the formation of parallel dimers. On illumination with far-red light, RpBphP1 forms a complex with gene repressor RpPpsR2 through light-induced structural changes in its HOS domains. An RpBphP1:RpPpsR2 complex is formed in the molecular ratio of 2 : 1 such that one RpBphP1 dimer binds one RpPpsR2 monomer. Molecular dimers have been modeled with Pfr and Pr SAXS data, suggesting that, in the Pfr state, stable dimeric four α-helix bundles are formed between HOS domains, rendering RpBphP1functionally inert. On illumination with light of 760 nm wavelength, four α-helix bundles formed by HOS dimers are disrupted, rendering helices available for binding with RpPpsR2.

Keywords: SAXS; bacteriophytochrome; complex formation; photo-induced changes; photosynthesis.


Conflict of interest statement

The authors declare no conflict of interest.

Figures

Figure 1
Figure 1
Domain organization, tertiary/quaternary structure, UV‐Vis spectra, and SEC chromatography. Domain organizations of (A) bacteriophytochrome RpBphP1 from Rhodopseudomonas palustris, bacteriophytochrome, XccBphP from Xanthomonas campestris pv. campestris and the gene repressor RpPpsR2 from Rhodopseudomonas palustris. RpBphP1 and XccBphP are composed of the chromophore binding domain comprising PAS‐GAF domains (CBD) or the larger photo‐sensory core domain PAS‐GAF‐PHY (PCD), which is the minimal unit for stable photo‐conversion, and C‐terminal output domains PAS9‐HOS and PAS9 respectively. Gene repressor RpPpsR2 is composed of the PAS domain variants N, PAS1, and PAS2. Domains N and PAS1 are connected by a glutamate rich Q‐linker α‐helix (αQ) and the C terminus terminated by the helix‐turn‐helix DNA binding motif HTH. (B) High resolution X‐ray structures of RpBphP1ΔHOS (excluding HOS domain, 4GW9) and XccBphP (5AKP). Quaternary structures are pseudo anti‐parallel dimers for RpBphP1ΔHOS and parallel dimers for XccBphP, TR is a tongue region capping the biliverdin chromophore pocket, PHY is a phytochrome specific domain and PAS9 is a type 9 PAS domain. (C) RpBphP1 UV‐Vis spectra of Pfr dark state (red) and the photo‐converted Pr state (blue), a spectrum was also measured 30 min after the start of dark reversion (black dashed line). RpBphP1 dark reversion half‐life is 50 min and for RpBphP1ΔHOS is estimated to be less than 1 min. (D) size exclusion chromatography (SEC) of RpBphP1; apparent dimer molecular weights are ~ 220 kDa for the Pfr dark state (blue) and ~ 160 kDa for the Pr state (red) which was prepared by illumination with 760 nm light. A fully dark reverted Pfr protein (dashed‐blue) is shown to elute as the original Pfr state demonstrating that the process is reversible.
Figure 2
Figure 2
Pfr and Pr SAXS data collection statistics and structure modeling. SDS/PAGE gel (A) of RpBphP1 protein taken from the SAXS sample cell immediately after Pr SAXS data collection, the sample was created by continuous illumination with 760 nm light; M protein markers, lane 1–80 kDa full length protein, lane 2 – by comparison a 3 week old sample showing degradation to a 70 kDa RpBphP1ΔHOS fragment; (B) photo‐conversion UV‐Vis spectrum of RpBphP1 measured offline using the same configuration as on the SAXS beamline; a white light source placed 4 cm from the sample with an intervening interference filter producing 760 nm wavelength light, UV‐Vis optical path‐length was 2 mm and protein concentration 4 mg·mL−1. Pfr dark state (gray) and Pr (black) spectrum measured 1 min after illuminating with 760 nm light and 30 min after continuous illumination with 760 nm light (dashed). (C) SAXS ab‐initio calculated envelopes, Pfr (pink) and Pr (blue); Pfr has a dimer axis of 170 Å, tapering from 90 to 40 Å; Pr has dimer axis 145 Å, tapering from 95 to 60 Å. (D) A full length Pfr parallel dimer was assembled from RpBphP1ΔHOS (4GW9) monomers and HOS domain dimers were created in Modeller from four sequence aligned Dhp homolog structures, Pr was assembled from a modified XccBphP and HOS dimers in which HTH motifs were bent at the hinge toward the PHY domain, relative orientations were optimized in CRYSOL. (E) CRYSOL Pfr optimization statistics; χ2 (solid) as a function of HOS translation along the common Z twofold axis. The function |ΔRg|/σ (dashed) was used to test the quality of calculated model Rg with respect to the observed Rg. The function is the modulus difference between observed and calculated Rg divided by its standard deviation σ; (F) Pr structures were tested by rotating HTH motifs into Pr envelope ‘bulge’ region between PAS9 and PHY domains. CRYSOL χ2 values are plotted with respect to ‘Angle’ (red triangles) which is an angle defined by the line from the hinge region, through the HTH helices, relative to the fixed line between hinge and helix hF in PHY, ‘Distance’ (green circles) is the corresponding separation in Å between T in HTH and hF. Pfr (G) and Pr (H) models positioned in their respective SAXS envelopes, front and side views. PCD‐PAS9 domains are colored blue/magenta and HOS domains are colored green/orange, the same subunit is colored blue/orange and magenta/green. (I) and (K) are Log(I) versus scattering vector S(Å−1) plots for Pfr and Pr states respectively. Solid lines are model calculated SAXS curves superimposed on SAXS experiment scattering points (gray), reduced residuals (I(S)exp − k.I(S)cal))/σ(S) are shown which are differences between experimental and calculate intensities divided by experimental standard deviation σ(S), k is a scaling factor; (J) shows intensity differences (ΔI) between illuminated Pr and dark Pfr SAXS data versus scattering vector S. ΔI values are expressed in kilo photons (kγ) units.
Figure 3
Figure 3
Raw SAXS data log(I(S)), P(R), intensity differences and Guinier plots. Experimental SAXS scattering curves Log(I(S)) versus S(Å−1) with error bars (A), Pfr (red) and Pr (blue), inset are intensity differences (I Pr ‐I Pfr) between illuminated and dark SAXS data with superimposed error bars. (B) Pair‐distance distribution function P(R) versus distance R(Å), Pfr Dmax is 160 and 140 Å for Pr. Ripples in P(R) originated from inter helix packing of ~ 10 Å which can also be seen as a scattering curve peak at S = 0.65 Å−1. Inset are Guinier plots of Pfr and Pr up to the maximum Guinier resolution Smax = 1.3/Rg where Rg is the radius of gyration 47.8 and 42.8 Å for Pfr and Pr respectively. The Guinier plots are linear down to S = 0.014 Å which corresponds to a real space dimension of 450 Å (~ 3 times Dmax) suggesting the absence of molecular aggregates.
Figure 4
Figure 4
Model of HOS domain. The HOS domain sequence was used to search for homolog PDB structures with HHpred toolkit. Four structures (PDBID, 4MT8, 4Q20, 3A0R, 5IDJ) were found, with probabilities ~ 97% and E‐values in the range 7 × 10‐5–1.5 × 10−6, which are histidine kinase dimerization domains (Dhp) and were used as templates to build HOS domain dimers within the program modeller 49. (A) is a single HOS domain comprising three α‐helices hJ′, hJ, and hK, (B) is a four α‐helix bundle dimer made from two HOS monomers. Random coils were predicted in the sequence regions 632–643 and 720–732. A small α‐helix segment hJ’ was predicted at 644–651 with a break between residues 651–654 followed by a helix‐turn‐helix (HTH) motif which is hJ (656–678), T (679–688), and hK (689–719). In several runs of Modeller, using different Dhp template structures, the amino acid sequence 651–654 was observed to behave as a hinge; the angle between helix axes of hJ′ and hJ varied between 20° and 95°.
Figure 5
Figure 5
Complex formation by Ni(II)‐affinity chromatography and SDS/PAGE. Ni(II)‐affinity plots (A–C) of samples incubated in the dark (black) or after illumination with light of wavelength 760 nm for 5 min (red). Samples were of untagged RpBphP1 or untagged RpBphP1ΔHOS mixed with N‐terminal His6‐tagged RpPpsR2 in the protein ratio 4 : 1. Profiles (A) and (C) were monitored at the protein absorption wavelength 280 nm. (B) was measured at the biliverdin IXα absorption wavelength 400 nm. Protein peak B is full length RpBphP1 and B70 the 70 kDa fragment RpBphP1ΔHOS and in the dark both elute at imidazole concentrations of 10 mm, while peak P1 and peak P2 are the monomeric and dimeric His6‐tagged RpPpsR2 eluting at 212 and 378 mm imidazole respectively. On illumination with 760 nm light the RpBphP1‐RpPpsR2 complex peak BP is observed eluting at 280 mm, the peak monitored at 400 nm (B) shows that this peak contains RpBphP1. (D) SDS/PAGE gels of RpPpsR2 without (‐DTT) and with (+DTT) 5 mm dithiothreitol. DTT breaks the disulfide bond between HTH domains. Linear scans of ‐DTT gels quantify RpPpsR2 with disulfide bonds and free cysteine in the ratio of ~ 1.3 : 1 and ~ 1 : 5.1 for +DTT gels. (E) An SDS/PAGE gel of peak BP shows the presence two proteins within the complex in the protein ratio ~ 2 : 1, RpBphP1 of molecular weight ~ 80 kDa and RpPpsR2 of molecular weight ~ 50 kDa. (F) A SEC plot of RpPpsR2 in 5 mm DTT indicating a dimer of mass ~ 117 kDa and a small tail which may indicate monomers at ~ 50 kDa.
Figure 6
Figure 6
HOS domain transition from Pfr to Pr state. The proposed HOS domain transition from Pfr (A and B) to Pr (E and F) via an intermediate Pr* (C and D) model (front and top views). Pfr‐HOS dimers form a four α‐helix bundle (hJ‐hK)A‐(hJ‐hK)B where A and B are the dimer protein chains. The intermediate model Pr* shows the beginning of α‐helix bundle separation and was generated from transformation matrices calculate by superimposition of PAS9 of Pfr onto Pr and applied to each Pfr PAS9‐HTH structure in turn. Transition from Pfr to Pr* can be described as a two angle motion of HTH motifs (hJ‐hK)A and (hJ‐hK)B; the first is a separation angle θ ~ 20° and the second a shearing angle ψ ~ 15°. We propose that this is facilitated by bending at the hinge. PAS9 domains (gray), helix hI (blue), short α‐helix hJ′(cyan), hJ (green) and hK (orange). The two subunits A and B are colored in darker and lighter shades respectively.
Figure 7
Figure 7
Space filling model showing a possible (RpBphP1)2 RpPpsR2 complex. (A) space filling model of the full length RpPpsR2 dimer synthesized in Modeller using a sequence modified PpsR homolog structure, 4HH2, from Rba. sphaeroides missing the C terminus HTH domain. The missing HTH domain was built in Modeller from PAS‐HTH and HTH homolog structures, 4GCZ, 3A0R, 4I5S, 1NTC and 3E7L. The PAS domain of PAS‐HTH overlaps with the PAS2 domain of 4HH2 facilitating alignment of the full‐length structure. Arrows in (A) indicate two‐fold axes relating N‐αQ‐PAS1 and PAS2‐HTH respectively the latter is approximately at right angles to the first. One monomer is colored (gray, purple, green) the other (cyan, pink, yellow). HTH domain disulfide bond is colored red. (B) Space filling model of RpBphP1‐Pr dimer, PAS9 (red) and HOS (yellow) are part of one monomer the rest of RpBphP1 is colored pale gray or pale blue for each subunit. (C) front view of hetero‐complex (RpBphP1)2RpPpsR2 in which contacts are made between HTH motif of HOS (yellow), HTH of an RpPpsR2 monomer (green), contacts are also made between PAS9 (red) and PAS2 (purple) domains. (D) is as in (C) but viewed from the bottom.

Similar articles

Cited by

References

    1. Rottwinkel G, Oberpichler I & Lamparter T (2010) Bathy phytochromes in rhizobial soil bacteria. J Bacteriol 192, 5124–5133. - PMC - PubMed
    1. Giraud E, Fardoux J, Fourrier N, Hannibal L, Genty B, Bouyer P, Dreyfus B & Vermeglio A (2002) Bacteriophytochrome controls photosystem synthesis in anoxygenic bacteria. Nature 417, 202–205. - PubMed
    1. Bellini D & Papiz MZ (2012) Structure of a bacteriophytochrome and light‐stimulated protomer swapping with a gene repressor. Structure 20, 1436–1446. - PubMed
    1. Braatsch S, Johnson JA, Noll K & Beatty JT (2007) The O2‐responsive repressor PpsR2 but not PpsR1 transduces a light signal sensed by the BphP1 phytochrome in Rhodopseudomonas palustris CGA009. FEMS Microbiol Lett 272, 60–64. - PubMed
    1. Bruscella P, Eraso JM, Roh JH & Kaplan S (2008) The use of chromatin immunoprecipitation to define PpsR binding activity in Rhodobacter sphaeroides 2.4.1. J Bacteriol 190, 6817–6828. - PMC - PubMed

Publication types

Supplementary concepts