. 2019 Jun 11:13:527.
doi: 10.3389/fnins.2019.00527. eCollection 2019.

Broad Lipidomic and Transcriptional Changes of Prophylactic PEA Administration in Adult Mice

Affiliations

Broad Lipidomic and Transcriptional Changes of Prophylactic PEA Administration in Adult Mice

Raissa Lerner et al. Front Neurosci. .

Abstract

Beside diverse therapeutic properties of palmitoylethanolamide (PEA) including: neuroprotection, inflammation and pain alleviation, prophylactic effects have also been reported in animal models of infections, inflammation, and neurological diseases. The availability of PEA as (ultra)micronized nutraceutical formulations with reportedly no side effects, renders it accordingly an appealing candidate in human preventive care, such as in population at high risk of disease development or for healthy aging. PEA's mode of action is multi-facetted. Consensus exists that PEA's effects are primarily modulated by the peroxisome proliferator-activated receptor alpha (PPARα) and that PEA-activated PPARα has a pleiotropic effect on lipid metabolism, inflammation gene networks, and host defense mechanisms. Yet, an exhaustive view of how the prophylactic PEA administration changes the lipid signaling in brain and periphery, thereby eliciting a beneficial response to various negative stimuli remains still elusive. We therefore, undertook a broad lipidomic and transcriptomic study in brain and spleen of adult mice to unravel the positive molecular phenotype rendered by prophylactic PEA. We applied a tissue lipidomic and transcriptomic approach based on simultaneous extraction and subsequent targeted liquid chromatography-multiple reaction monitoring (LC-MRM) and mRNA analysis by qPCR, respectively. We targeted lipids of COX-, LOX- and CYP450 pathways, respectively, membrane phospholipids, lipid products of cPLA2, and free fatty acids, along with various genes involved in their biosynthesis and function. Additionally, plasma lipidomics was applied to reveal circulatory consequences and/or reflection of PEA's action. We found broad, distinct, and several previously unknown tissue transcriptional regulations of inflammatory pathways. In hippocampus also a PEA-induced transcriptional regulation of neuronal activity and excitability was evidenced. A massive downregulation of membrane lipid levels in the splenic tissue of the immune system with a consequent shift towards pro-resolving lipid environment was also detected. Plasma lipid pattern reflected to a large extent the hippocampal and splenic lipidome changes, highlighting the value of plasma lipidomics to monitor effects of nutraceutical PEA administration. Altogether, these findings contribute new insights into PEA's molecular mechanism and helps answering the questions, how PEA prepares the body for insults and what are the "good lipids" that underlie this action.

Keywords: PEA; PUFAs; endocannabinoids; inflammation; mRNA; phospholipids; targeted lipidomics.


Figures

FIGURE 1
FIGURE 1
Experimental timeline of PEA/Sal treatment: in total 24 mice were ip injected either with saline (n = 12) or with a dose of 40 mg/kg PEA (n = 12) each in a total volume of 10 mL/kg (1st injection, at 7.8 h prior to sacrificing). After 7 h the same procedure was repeated (2nd injection, at 50 min prior to sacrificing). At time point 1 (50 min post – 2nd injection) 12 mice were sacrificed and plasma, brain, and spleen samples from PEA-treated (n = 6) and saline-treated (n = 6) mice were collected for further analysis. This procedure was repeated with remaining 12 mice, e.g., PEA-treated (n = 6) and saline-treated (n = 6) mice, at time point 2 (3.5 h post – 2nd injection).
FIGURE 2
FIGURE 2
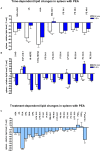
Lipid levels of spleen after PEA treatment: relative lipid concentrations [normalized to the tissue weight (spleen, approximately 20 mg)] after PEA treatment as percentage of saline treated mice are shown and presented as mean value ± SEM. (A) Time point 1: time-specific lipid plasticity after 50 min of PEA treatment. Relative lipid levels for the two different time points are shown for reference, but only lipids significantly changing after 50 min of PEA treatment are depicted. (B) Time point 2: time specific lipid plasticity after 3.5 h of sub chronic PEA treatment. Relative lipid level for two different time points are shown and only lipids significantly changing after 3.5 h of PEA treatment are depicted. Significant differences between the time points were also detected and as they underline time specificity for these lipids, they were marked on the figure with . (C) Merged time points: PEA treatment effect on lipid plasticity. Changes for AA, PI 38:4, SM d36:1, PE 40:6 and 11β-PGF2α are significant when pooling the time points. The remaining significantly changed lipids show significant changes for both time points, respectively. Data were considered significant at a p-value < 0.05, e.g., ∗∗∗p < 0.001, ∗∗p = 0.001 to 0.01; p = 0.01 to 0.05.
FIGURE 3
FIGURE 3
Lipid levels of plasma after PEA treatment. Relative lipid concentrations (normalized to ml plasma: 40 μl) after PEA treatment as percentage of saline treated mice are shown and presented as mean value ± SEM. (A) Time point 1: time-specific lipid plasticity after 50 min of PEA treatment. Relative lipid levels for two different time points are shown and only lipids significantly changing after 50 min of PEA treatment are depicted. (B) Time point 2: time specific lipid plasticity after 3.5 h of sub-chronic PEA treatment. Relative lipid level for two different time points are shown and only lipids significantly changing after 3.5 h of PEA treatment are depicted. Significant differences between the time points were also detected and as they underline time specificity for these lipids, they were marked on the figure with . (C) Merged time points: PEA treatment effect on lipid plasticity. Changes for AA, PI 38:4, SM d36:1 and PE 40:6 are significant when pooling the time points. The remaining significantly changed lipids show significant changes for both time points, respectively. Data were considered significant at a p-value < 0.05, e.g., ∗∗∗p < 0.001, ∗∗p = 0.001 to 0.01; p = 0.01 to 0.05.
FIGURE 4
FIGURE 4
LPC 20:4 levels of brain and periphery after PEA treatment. Relative LPC 20:4 concentrations (normalized to ml plasma/tissue weight) after PEA treatment as percentage of saline treated mice are shown and presented as mean value ± SEM. Relative lipid level for two different time points are depicted. Time specific changes in LPC 20:4 levels occur in spleen at 50 min while in plasma and hippocampus at 3.5 h after PEA treatment. Data were considered significant at a p-value < 0.05, e.g., ∗∗∗p < 0.001, ∗∗p = 0.001 to 0.01; p = 0.01 to 0.05.
FIGURE 5
FIGURE 5
HETE lipid levels in brain and periphery after PEA treatment: relative HETE concentrations (normalized to ml plasma/tissue weight) after PEA treatment as percentage of saline treated mice are shown and presented as mean value ± SEM. (A) Spleen: HETE alterations with sub-chronic PEA treatment and unchanged HETE levels in spleen. Only significant reductions of HETE levels can be found in spleen. (B) Plasma HETE alterations with sub-chronic PEA treatment and unchanged HETE levels in plasma. Only significant reductions of HETE levels can be found in plasma. (C) Hippocampus: HETE alterations with sub chronic PEA treatment and unchanged HETE levels in hippocampus. Only significant increments of HETE levels can be found in hippocampus. Data were considered significant at a p-value < 0.05, e.g., ∗∗∗p < 0.001, ∗∗p = 0.001 to 0.01; p = 0.01 to 0.05.
FIGURE 6
FIGURE 6
RvD1 concentration in spleen after different time points of PEA treatment: absolute concentrations of RvD1 [normalized to the tissue weight (spleen 20 mg)] after two time points of PEA treatment presented as mean value ± SEM. RvD1 is significantly increased after 3.5 h of PEA treatment as compared to 50 min. Of note, RvD1 was not detected in saline-treated control mice, likely because they are at basal level under limit of detection/quantification or not biosynthesized. Data were considered significant at a p-value < 0.05, e.g., ∗∗∗p < 0.001, ∗∗p = 0.001 to 0.01; p = 0.01 to 0.05.
FIGURE 7
FIGURE 7
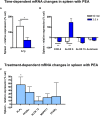
mRNA levels of spleen after PEA treatment: relative mRNA values after PEA treatment as percentage of saline-treated mice, presented as mean value ± SEM. (A) Time point 1: time specific mRNA changes after 50 min of sub-chronic PEA treatment. Relative mRNA levels for two different time points are shown and only genes significantly changing after 50 min of PEA treatment are depicted. (B) Time point 2: time-specific mRNA changes after 3.5 h of PEA treatment. Relative mRNA levels for two different time points are shown and only genes significantly changing after 3.5 h of PEA treatment are depicted. Significant differences between the time points underline time specificity for these mRNAs and are depicted on the graph when occurring. (C) Merged time points: relative mRNA levels for merged time points. Changes for cPLA2 are significant when pooling the time points. Data were considered significant at a p-value < 0.05, e.g., ∗∗∗p < 0.001, ∗∗p = 0.001 to 0.01; p = 0.01 to 0.05.
FIGURE 8
FIGURE 8
mRNA levels of hippocampus after PEA treatment: relative mRNA values after PEA treatment as percentage of saline treated mice, presented as mean value ± SEM. (A) Time point 1: time specific mRNA changes after 50 min of sub-chronic PEA treatment. Relative mRNA levels for two different time points are shown and only genes significantly changing after 50 min of PEA treatment are depicted. (B) Time point 2: time-specific mRNA changes after 3.5 h of PEA treatment. Relative mRNA levels for two different time points are shown and only genes significantly changing after 3.5 h of PEA treatment are depicted. Significant differences between the time points underline time specificity for these mRNAs and are depicted on the graph when occurring. (C) Merged time points: relative mRNA levels for merged time points. Changes for COX-2 and Bdnf are significant when pooling the time points. Data were considered significant at a p-value < 0.05, e.g., ∗∗∗p < 0.001, ∗∗p = 0.001 to 0.01; p = 0.01 to 0.05.
FIGURE 9
FIGURE 9
Simplified signaling pathway: this simplified signaling cartoon encompasses all significant molecular changes detected in this study in spleen, hippocampus, and plasma after PEA treatment (PEA/sal). Decreased molecular levels compared to Sal are displayed in red while increased ones in green, respectively. Where lipid level alteration where restricted to a time point, they were specified in red color. The proposed pathways are inferred from published studies that show correlations between the targeted molecules under defined physiological or pathophysiological contexts. This graphic gives also an idea how the PEA-derived splenic molecular phenotype leads to a general state of decreased acute inflammation and increased resolution of inflammation and cell survival/growth. Similarly, possible interrelation between the transcriptional changes (mRNA) by PEA is depicted.

Similar articles

Cited by

References

    1. Allison D. B., Bassaganya-Riera J., Burlingame B., Brown A. W., le Coutre J., Dickson S. L., et al. (2015). Goals in nutrition science 2015–2020. Front. Nutr. 2:26. 10.3389/fnut.2015.00026 - DOI - PMC - PubMed
    1. Aloe L., Leon A., Levi-Montalcini R. (1993). A proposed autacoid mechanism controlling mastocyte behaviour. Agents Actions 39 C145–C147. 10.1007/BF01972748 - DOI - PubMed
    1. Araki M., Nakagawa Y., Oishi A., Han S. I., Wang Y., Kumagai K., et al. (2018). The peroxisome proliferator-activated receptor α (PPARα) agonist pemafibrate protects against diet-induced obesity in mice. Int. J. Mol. Sci. 19:2148. 10.3390/ijms19072148 - DOI - PMC - PubMed
    1. Artukoglu B. B., Beyer C., Zuloff-Shani A., Brener E., Bloch M. (2017). Efficacy of palmitoylethanolamide for pain: a meta-analysis. Pain Physician 20 353–362. - PubMed
    1. Binder D. K., Croll S. D., Gall C. M., Scharfman H. E. (2001). BDNF and epilepsy: Too much of a good thing? Trends Neurosci. 24 47–53. 10.1016/S0166-2236(00)01682-9 - DOI - PubMed

LinkOut - more resources