Spatial Resolution and Imaging Encoding fMRI Settings for Optimal Cortical and Subcortical Motor Somatotopy in the Human Brain
- PMID: 31244595
- PMCID: PMC6579882
- DOI: 10.3389/fnins.2019.00571
Spatial Resolution and Imaging Encoding fMRI Settings for Optimal Cortical and Subcortical Motor Somatotopy in the Human Brain
Abstract
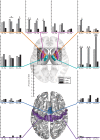
There is much controversy about the optimal trade-off between blood-oxygen-level-dependent (BOLD) sensitivity and spatial precision in experiments on brain's topology properties using functional magnetic resonance imaging (fMRI). The sparse empirical evidence and regional specificity of these interactions pose a practical burden for the choice of imaging protocol parameters. Here, we test in a motor somatotopy experiment the impact of fMRI spatial resolution on differentiation between body part representations in cortex and subcortical structures. Motor somatotopy patterns were obtained in a block-design paradigm and visually cued movements of face, upper and lower limbs at 1.5, 2, and 3 mm spatial resolution. The degree of segregation of the body parts' spatial representations was estimated using a pattern component model. In cortical areas, we observed the same level of segregation between somatotopy maps across all three resolutions. In subcortical areas the degree of effective similarity between spatial representations was significantly impacted by the image resolution. The 1.5 mm 3D EPI and 3 mm 2D EPI protocols led to higher segregation between motor representations compared to the 2 mm 3D EPI protocol. This finding could not be attributed to differential BOLD sensitivity or delineation of functional areas alone and suggests a crucial role of the image encoding scheme - i.e., 2D vs. 3D EPI. Our study contributes to the field by providing empirical evidence about the impact of acquisition protocols for the delineation of somatotopic areas in cortical and sub-cortical brain regions.
Keywords: BOLD sensitivity; functional magnetic resonance imaging; image resolution; segregation; subcortical areas.
Figures


Similar articles
-
Sensitivity and specificity considerations for fMRI encoding, decoding, and mapping of auditory cortex at ultra-high field.Neuroimage. 2018 Jan 1;164:18-31. doi: 10.1016/j.neuroimage.2017.03.063. Epub 2017 Mar 31. Neuroimage. 2018. PMID: 28373123 Free PMC article.
-
Somatotopy in the human motor cortex hand area. A high-resolution functional MRI study.Eur J Neurosci. 1997 Oct;9(10):2178-86. doi: 10.1111/j.1460-9568.1997.tb01384.x. Eur J Neurosci. 1997. PMID: 9421177
-
Within-limb somatotopy in primary motor cortex--revealed using fMRI.Cortex. 2010 Mar;46(3):310-21. doi: 10.1016/j.cortex.2009.02.024. Epub 2009 Apr 7. Cortex. 2010. PMID: 19446804
-
Integrated technology for evaluation of brain function and neural plasticity.Phys Med Rehabil Clin N Am. 2004 Feb;15(1):263-306. doi: 10.1016/s1047-9651(03)00124-4. Phys Med Rehabil Clin N Am. 2004. PMID: 15029909 Review.
-
Advances in High-Field BOLD fMRI.Materials (Basel). 2011 Nov 2;4(11):1941-1955. doi: 10.3390/ma4111941. Materials (Basel). 2011. PMID: 28824116 Free PMC article. Review.
Cited by
-
A review of multi-modal magnetic resonance imaging studies on perimenopausal brain: a hint towards neural heterogeneity.Eur Radiol. 2023 Aug;33(8):5282-5297. doi: 10.1007/s00330-023-09549-5. Epub 2023 Mar 28. Eur Radiol. 2023. PMID: 36977851 Review.
-
Subcortical contributions to the sense of body ownership.Brain. 2024 Feb 1;147(2):390-405. doi: 10.1093/brain/awad359. Brain. 2024. PMID: 37847057 Free PMC article.
-
Practical scan-length considerations for mapping upper limb movements to the somatosensory/motor cortex at 7T: A pilot study.Neuroimage Rep. 2025 Feb 18;5(1):100240. doi: 10.1016/j.ynirp.2025.100240. eCollection 2025 Mar. Neuroimage Rep. 2025. PMID: 40567886 Free PMC article.
-
Case Report: Multimodal Functional and Structural Evaluation Combining Pre-operative nTMS Mapping and Neuroimaging With Intraoperative CT-Scan and Brain Shift Correction for Brain Tumor Surgical Resection.Front Hum Neurosci. 2021 Feb 25;15:646268. doi: 10.3389/fnhum.2021.646268. eCollection 2021. Front Hum Neurosci. 2021. PMID: 33716700 Free PMC article.
-
Heritability and interindividual variability of regional structure-function coupling.Nat Commun. 2021 Aug 12;12(1):4894. doi: 10.1038/s41467-021-25184-4. Nat Commun. 2021. PMID: 34385454 Free PMC article.
References
LinkOut - more resources
Full Text Sources
Molecular Biology Databases

