. 2019 Jun 12:13:594.
doi: 10.3389/fnins.2019.00594. eCollection 2019.

Classification of Multiple Sclerosis Clinical Profiles via Graph Convolutional Neural Networks

Affiliations

Classification of Multiple Sclerosis Clinical Profiles via Graph Convolutional Neural Networks

Aldo Marzullo et al. Front Neurosci. .

Abstract

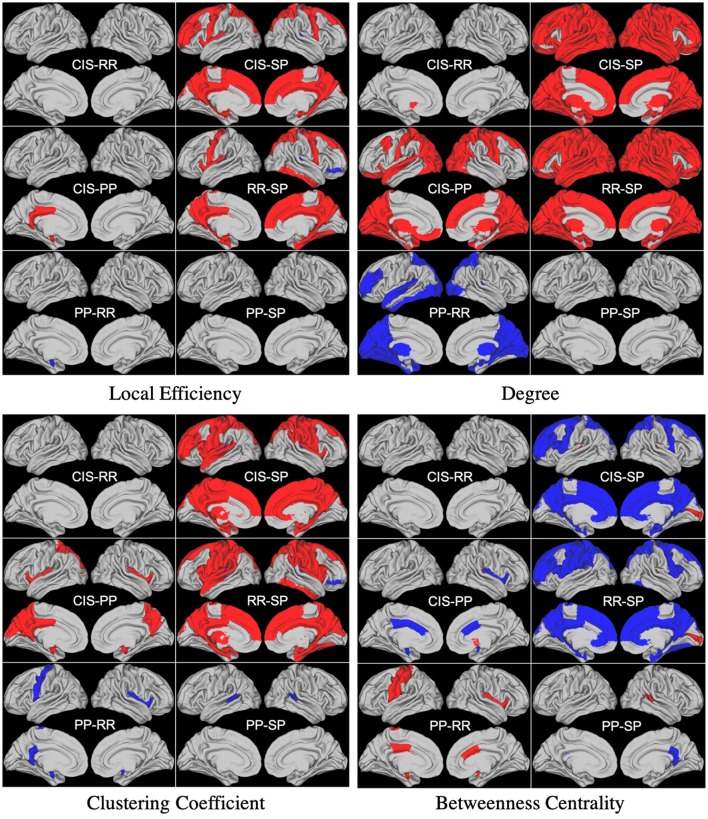
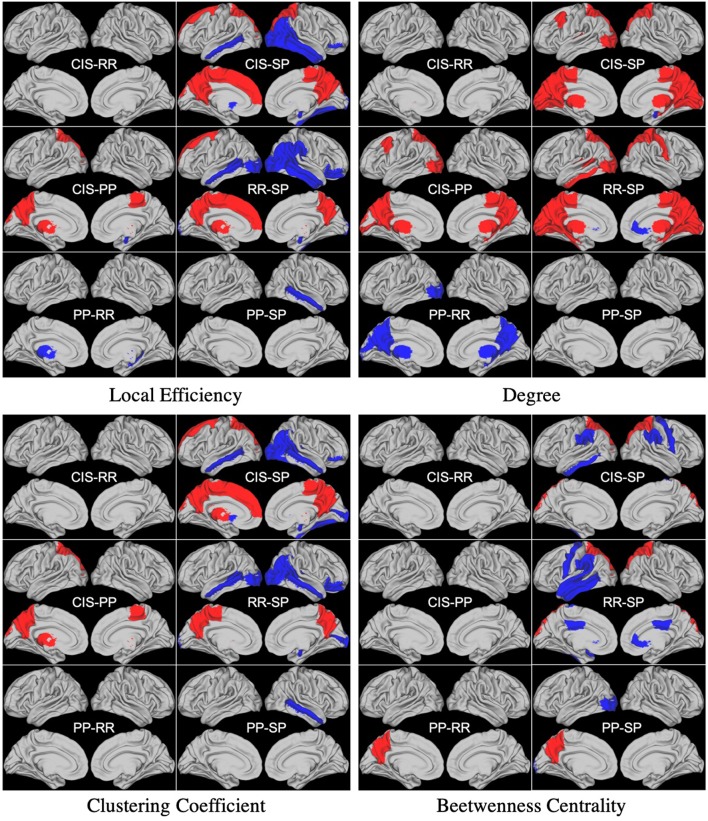
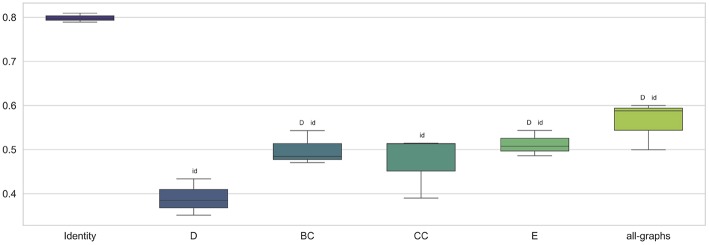
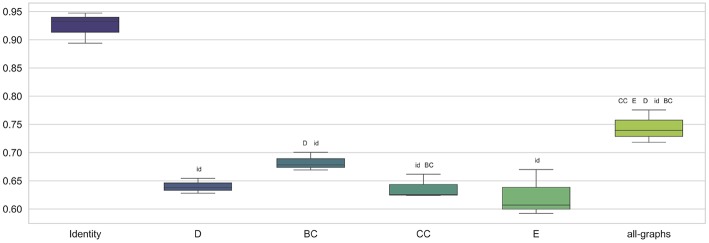
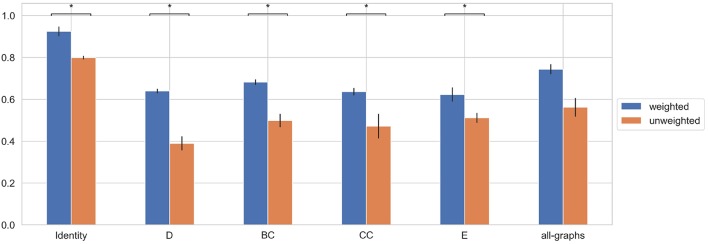
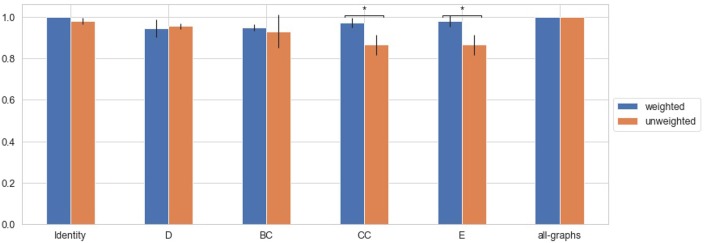
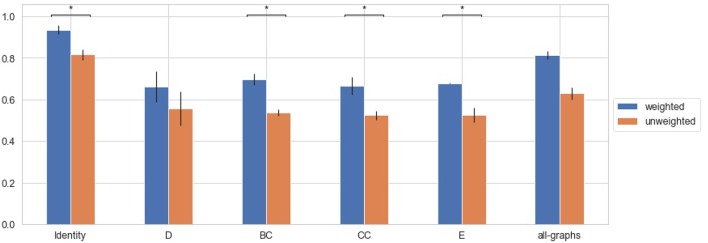
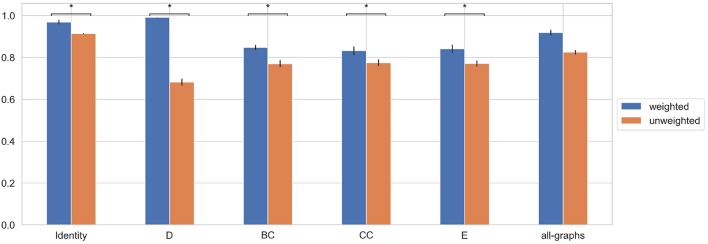
Recent advances in image acquisition and processing techniques, along with the success of novel deep learning architectures, have given the opportunity to develop innovative algorithms capable to provide a better characterization of neurological related diseases. In this work, we introduce a neural network based approach to classify Multiple Sclerosis (MS) patients into four clinical profiles. Starting from their structural connectivity information, obtained by diffusion tensor imaging and represented as a graph, we evaluate the classification performances using unweighted and weighted connectivity matrices. Furthermore, we investigate the role of graph-based features for a better characterization and classification of the pathology. Ninety MS patients (12 clinically isolated syndrome, 30 relapsing-remitting, 28 secondary-progressive, and 20 primary-progressive) along with 24 healthy controls, were considered in this study. This work shows the great performances achieved by neural networks methods in the classification of the clinical profiles. Furthermore, it shows local graph metrics do not improve the classification results suggesting that the latent features created by the neural network in its layers have a much important informative content. Finally, we observe that graph weights representation of brain connections preserve important information to discriminate between clinical forms.

Keywords: connectome; diffusion tensor imaging; graph neural networks; graph-derived metrics; multiple sclerosis.


Figures

Figure 1
Figure 1
Differences between groups found in statistical analysis performed using unweighted local graph metrics. Blue and Red regions represent negative and positive differences, respectively.
Figure 2
Figure 2
Differences between groups found in statistical analysis performed using weighted local graph metrics. Blue and Red regions represent negative and positive differences, respectively.
Figure 3
Figure 3
Box plot in term of F-Measure for each different unweighted feature [Degree (D), Betweenness Centrality (BC), Clustering Coefficient (CC), Local Efficiency (E), with all graph-metrics (all-graphs)] and without features (identity).
Figure 4
Figure 4
Box plot in term of F-Measure for each different weighted feature [Degree (D), Betweenness Centrality (BC), Clustering Coefficient (CC), Local Efficiency (E), with all graph-metrics (all-graphs)] and without features (identity).
Figure 5
Figure 5
Average F-Measure comparison for weighted and unweighted approach for each feature [Degree (D), Betweenness Centrality (BC), Clustering Coefficient (CC), Local Efficiency (E), with all graph-metrics (all-graphs)] and without features (identity). *Represents statistical significance between the two groups.
Figure 6
Figure 6
Average F-Measure comparison for weighted and unweighted approach [HC vs. (CIS+RR)] for each feature [Degree (D), Betweenness Centrality (BC), Clustering Coefficient (CC), Local Efficiency (E), with all graph-metrics (all-graphs)] and without features (identity). *Represents statistical significance between the two groups.
Figure 7
Figure 7
Average F-Measure comparison for weighted and unweighted approach [HC vs. (SP+PP)] for each feature [Degree (D), Betweenness Centrality (BC), Clustering Coefficient (CC), Local Efficiency (E), with all graph-metrics (all-graphs)] and without features (identity).
Figure 8
Figure 8
Average F-Measure comparison for weighted and unweighted approach [HC vs. SP vs. PP vs. RR vs. CIS] for each feature [Degree (D), Betweenness Centrality (BC), Clustering Coefficient (CC), Local Efficiency (E), with all graph-metrics (all-graphs)] and without features (identity). *Represents statistical significance between the two groups.
Figure 9
Figure 9
Average F-Measure comparison for weighted and unweighted approach [(CIS+RR) vs. (SP+PP)] for each feature [Degree (D), Betweenness Centrality (BC), Clustering Coefficient (CC), Local Efficiency (E), with all graph-metrics (all-graphs)] and without features (identity). *Represents statistical significance between the two groups.

References

    1. Azevedo C. J., Cen S. Y., Khadka S., Liu S., Kornak J., Shi Y., et al. (2018). Thalamic atrophy in multiple sclerosis: a magnetic resonance imaging marker of neurodegeneration throughout disease. Ann. Neurol. 83, 223–234. 10.1002/ana.25150 - DOI - PMC - PubMed
    1. Barkhof F. (2002). The clinico-radiological paradox in multiple sclerosis revisited. Curr. Opin. Neurol. 15, 239–245. 10.1097/00019052-200206000-00003 - DOI - PubMed
    1. Bates D., Mächler M., Bolker B., Walker S. (2015). Fitting linear mixed-effects models using lme4. J. Stat. Softw. 67, 1–51. 10.18637/jss.v067.i01 - DOI
    1. Brosch T., Yoo Y., Tang L. Y. W., Li D. K. B., Traboulsee A., Tam R. C. (2015). “Deep convolutional encoder networks for multiple sclerosis lesion segmentation,” in Medical Image Computing and Computer-Assisted Intervention - MICCAI 2015 - 18th International Conference Munich, Germany, October 5 - 9, 2015, Proceedings, Part III (Munich: ), 3–11.
    1. Charalambous T., Tur C., Prados F., Kanber B., Chard D. T., Ourselin S., et al. (2019). Structural network disruption markers explain disability in multiple sclerosis. J. Neurol. Neurosurg. Psychiatry 90, 219–226. 10.1136/jnnp-2018-318440 - DOI - PMC - PubMed

LinkOut - more resources