. 2019 Jun 11:13:250.
doi: 10.3389/fncel.2019.00250. eCollection 2019.

MEA6 Deficiency Impairs Cerebellar Development and Motor Performance by Tethering Protein Trafficking

Affiliations

MEA6 Deficiency Impairs Cerebellar Development and Motor Performance by Tethering Protein Trafficking

Xin-Tai Wang et al. Front Cell Neurosci. .

Abstract

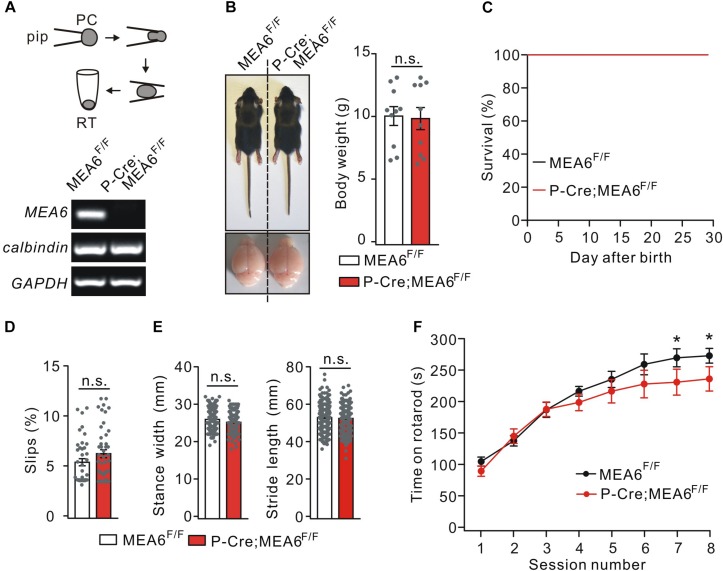
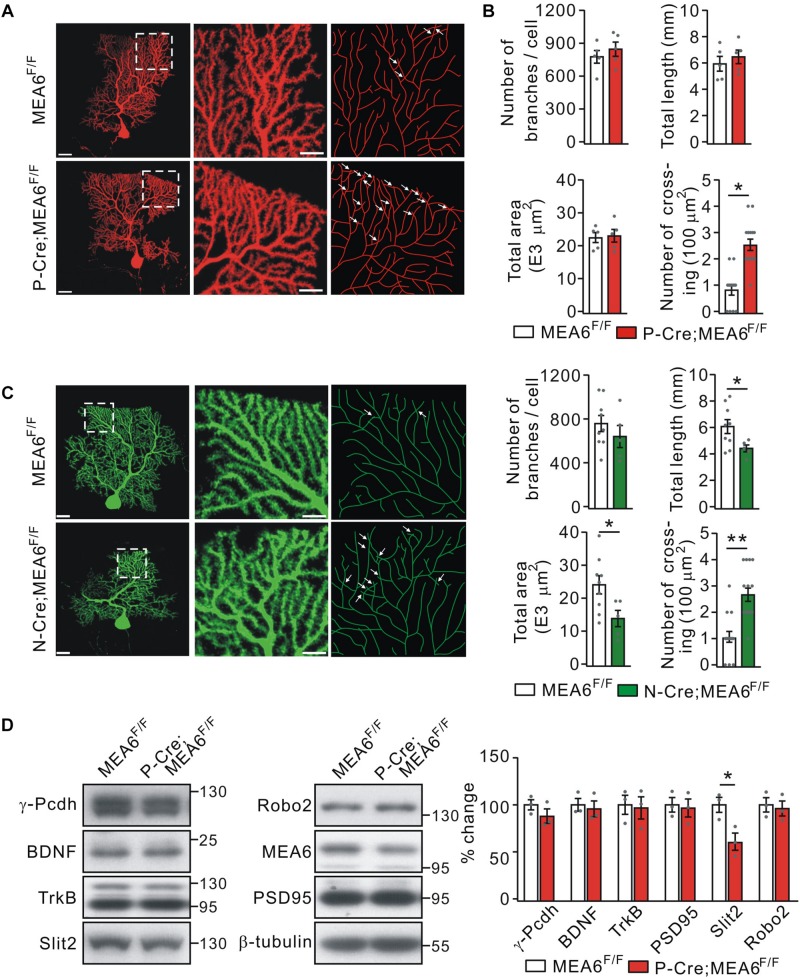
Meningioma expressed antigen 6 (MEA6), also called cutaneous T cell lymphoma-associated antigen 5 (cTAGE5), was initially found in tumor tissues. MEA6 is located in endoplasmic reticulum (ER) exit sites and regulates the transport of collagen, very low density lipoprotein, and insulin. It is also reported that MEA6 might be related to Fahr's syndrome, which comprises neurological, movement, and neuropsychiatric disorders. Here, we show that MEA6 is critical to cerebellar development and motor performance. Mice with conditional knockout of MEA6 (Nestin-Cre;MEA6F/F) display smaller sizes of body and brain compared to control animals, and survive maximal 28 days after birth. Immunohistochemical and behavioral studies demonstrate that these mutant mice have defects in cerebellar development and motor performance. In contrast, PC deletion of MEA6 (pCP2-Cre;MEA6F/F) causes milder phenotypes in cerebellar morphology and motor behaviors. While pCP2-Cre;MEA6F/F mice have normal lobular formation and gait, they present the extensive self-crossing of PC dendrites and damaged motor learning. Interestingly, the expression of key molecules that participates in cerebellar development, including Slit2 and brain derived neurotrophic factor (BDNF), is significantly increased in ER, suggesting that MEA6 ablation impairs ER function and thus these proteins are arrested in ER. Our study provides insight into the roles of MEA6 in the brain and the pathogenesis of Fahr's syndrome.

Keywords: Fahr’s syndrome; MEA6; Slit2; dendrite self-crossing; motor learning.


Figures

FIGURE 1
FIGURE 1
Nestin-Cre;MEA6F/F mice display defects in motor performance. (A) MEA6 expression in the mouse cerebellum at different stages. Equal amounts of protein from cerebellar tissues were loaded onto SDS–PAGE and analyzed by Western blots using antibodies against MEA6 and GAPDH. The black triangle shows the bands of MEA6 protein. The experiment was performed three times. (B) Immunohistochemical staining for MEA6 (green), calbindin (Calb, red), and NeuN (red) in the cerebella from control mice. Scale bars: 20 μm. (C) The pictures of bodies and brains of MEA6F/F and N-Cre;MEA6F/F at P21. Average body weights were 10.4 ± 0.8 g (MEA6F/F; n = 10 mice) and 4.8 ± 1.1 g (N-Cre;MEA6F/F; n = 10 mice). Gray dots indicate individual data points. Unpaired t-test, ∗∗p < 0.01. (D) Western blot detection of MEA6 expression in MEA6F/F and N-Cre;MEA6F/F mice (P21). The black triangle shows the band of MEA6 protein. (E) The cerebella (CB) of MEA6F/F and N-Cre;MEA6F/F mice (P21) were extracted in centrifuge tubes and subjected to RT-PCR. The electrophoresis of MEA6 (157 bp) and GAPDH (233 bp) is show in the right (n = 5 trials from one pair of mice). (F) Footprints of hind paws of MEA6F/F and N-Cre;MEA6F/F mice. The statistics shows abnormal gait with a shorter stride width (SW) and stance length (SL) in N-Cre;MEA6F/F (SW: 16.8 ± 0.8 mm, unpaired t-test, *p < 0.05. SL: 32.7 ± 1.3 mm, unpaired t-test, *p < 0.05. n = 32 trials from 5 mice), compared to MEA6F/F mice (SW: 21.6 ± 0.2 mm. SL: 39.1 ± 0.9 mm. n = 68 trials from 6 mice). Gray dots indicate individual data points. (G) Kaplan-Meier survival curves of MEA6F/F (n = 45 mice) and N-Cre;MEA6F/F mice (n = 49 mice). (H) The percentages of hindpaw slips during runs on an elevated horizontal beam. MEA6F/F: 4.3 ± 1.0% (n = 24 trials from 6 mice). N-Cre;MEA6F/F: 64.9 ± 4.8% (n = 24 trials from 6 mice). Gray dots indicate individual data points. Unpaired t-test, ∗∗p < 0.001. (I) The time spent on the rotarod with a fixed speed for MEA6F/F and N-Cre;MEA6F/F mice at P19-21. MEA6F/F: 359 ± 62 s (n = 24 trials from 6 mice); N-Cre;MEA6F/F: 41 ± 8 s (n = 24 trials from 6 mice). Gray dots indicate individual data points. Unpaired t-test, ∗∗p < 0.001.
FIGURE 2
FIGURE 2
Shrunken lobules in N-Cre;MEA6F/F mice. (A) The H&E staining of sagittal cerebellar sections from MEA6F/F and N-Cre;MEA6F/F mice at P25. The middle panel (Scale bars: 100 μm) is the higher magnification of left panel (Scale bars: 200 μm) and the right panel (Scale bars: 10 μm) is the higher magnification of middle panel, as indicated by black dashed boxes. Cerebellar area: 6.3 ± 0.4 E6 μm2 (MEA6F/F; n = 7 mice) and 4.5 ± 0.7 E6 μm2 (N-Cre;MEA6F/F; n = 6 mice), unpaired t-test, *p < 0.05. Lobule III thickness: 758 ± 58 μm (MEA6F/F; n = 7 mice) and 518 ± 71 μm (N-Cre;MEA6F/F; n = 7 mice), unpaired t-test, *p < 0.05. Thickness of granule cell layer (GL; lobule III): 110 ± 5 μm (MEA6F/F; n = 7 mice) and 90 ± 4 μm (N-Cre;MEA6F/F; n = 7 mice), unpaired t-test, *p < 0.05. Thickness of molecular layer (ML; lobule III): 141 ± 4 μm (MEA6F/F; n = 7 mice) and 101 ± 4 μm (N-Cre;MEA6F/F; n = 7 mice), unpaired t-test, *p < 0.05. Gray dots indicate individual data points. (B) The calbindin staining in MEA6F/F and N-Cre;MEA6F/F mice (P25), indicating that the number and arrangement of PCs are not changed by the deletion of MEA6. Average numbers of PCs per 800 μm were 26.8 ± 0.5 (MEA6F/F; n = 11 mice) or 27.7 ± 0.5 (N-Cre;MEA6F/F; n = 11 mice). Gray dots indicate individual data points. Unpaired t-test, p > 0.05 (n.s.).
FIGURE 3
FIGURE 3
The deletion of MEA6 in PCs does not affect gait but impairs motor learning. (A) PC contents of MEA6F/F and N-Cre;MEA6F/F mice (P21) were harvested using glass micropipettes (pip, OD 2 μm) and placed in centrifuge tubes. The contents collected from 10 cells were then subjected to RT-PCR. The electrophoresis of MEA6 (157 bp), calbindin (184 bp), and GAPDH (233 bp) is show in the lower panel (n = 5 trials). (B) Pictures of bodies and brains of MEA6F/F and P-Cre;MEA6F/F at P21. Average body weights were 10.4 ± 0.8 g (MEA6F/F; n = 10 mice) and 10.2 ± 1.0 g (P-Cre;MEA6F/F; n = 10 mice). Gray dots indicate individual data points. Unpaired t-test. (C) Kaplan-Meier survival curves of MEA6F/F (n = 15 mice) and P-Cre;MEA6F/F mice (n = 15 mice). (D) The percentages of hindpaw slips during runs on an elevated horizontal beam. MEA6F/F: 5.3 ± 0.3% (n = 40 trials from 6 mice). P-Cre;MEA6F/F: 6.2 ± 0.5% (n = 45 trials from 6 mice). Gray dots indicate individual data points. Unpaired t-test, p > 0.05. (E) The statistics of footprints of MEA6F/F and P-Cre;MEA6F/F mice shows normal gait with unchanged stride width (SW) and stance length (SL) in P-Cre;MEA6F/F (SW: 25.9 ± 0.4 mm, unpaired t-test, p = 0.69; SL: 45.4 ± 1.0 mm, unpaired t-test, p = 0.41; n = 172 trials from 16 mice), compared to MEA6F/F mice (SW: 25.2 ± 0.2 mm; SL: 44.7 ± 0.8 mm; n = 197 trials from 16 mice). Gray dots indicate individual data points. (F) Time spent on the accelerating rotarod for MEA6F/F (n = 8 mice) and P-Cre;MEA6F/F mice (n = 8 mice) at P60. Unpaired t-test, *p < 0.05.
FIGURE 4
FIGURE 4
Lobular formation is normal in P-Cre;MEA6F/F mice. (A) Nissl staining of cerebellar sections from MEA6F/F and P-Cre;MEA6F/F mice at P25. The middle panel (Scale bars: 100 μm) is the higher magnification of left panel (Scale bars: 200 μm) and the right panel (Scale bars: 10 μm) is the higher magnification of middle panel, as indicated by dashed boxes and lines. Cerebellar area: 6.4 ± 0.4 E6 μm2 (MEA6F/F; n = 6 mice) and 6.3 ± 0.3 E6 μm2 (P-Cre;MEA6F/F; n = 6 mice), unpaired t-test, p > 0.05. Lobule IV thickness: 774 ± 52 μm (MEA6F/F; n = 6 mice) and 729 ± 48 μm (P-Cre;MEA6F/F; n = 6 mice), unpaired t-test, p > 0.05. Thickness of granule cell layer (GL; lobule IV): 111 ± 5 μm (MEA6F/F; n = 7 mice) and 112 ± 5 μm (P-Cre;MEA6F/F; n = 7 mice), unpaired t-test, p > 0.05. Thickness of molecular layer (ML; lobule IV): 152 ± 5 μm (MEA6F/F; n = 7 mice) and 149 ± 5 μm (P-Cre;MEA6F/F; n = 7 mice), unpaired t-test, p > 0.05. Gray dots indicate individual data points. (B) The calbindin staining in MEA6F/F and P-Cre;MEA6F/F mice (P21 and P60), indicating that the number PCs is not changed by the deletion of MEA6. The average numbers of PCs per 800 μm were 27.1 ± 1.0 (MEA6F/F; n = 6 mice), 27.4 ± 0.9 (P-Cre;MEA6F/F; n = 6 mice), unpaired t-test, p > 0.05 at P21, and 24.8 ± 0.9 (MEA6F/F; n = 6 mice), 24.7 ± 0.9 (P-Cre;MEA6F/F; n = 6 mice), unpaired t-test, p > 0.05. Gray dots indicate individual data points. Scale bars: 200 μm.
FIGURE 5
FIGURE 5
Purkinje cell deletion of MEA6 impairs dendrite self-avoidance. (A) PCs from MEA6F/F and P-Cre;MEA6F/F mice (P21) are shown by z-projections of confocal images (left and middle panels) or skeletonized reconstructions (right panel). High magnification images shown in the middle panel correspond to the respective boxed regions in the left panel. White arrows indicate self-crossings. Scale bars: 50 μm (left panel) and 10 μm (middle panel). (B) Quantification of number of branches, total dendrite length, total area of dendritic arbor, and number of self-crossing per 100 μm2 of dendrite area of labeled mCherry-expressing MEA6F/F (n = 5 from 5 mice) and P-Cre;MEA6F/F (n = 5 from 5 mice) PCs. Number of branches: 776 ± 63 per cell (MEA6F/F) and 845 ± 70 per cell (P-Cre;MEA6F/F), unpaired t-test, p > 0.05. Total dendrite length: 6.0 ± 0.6 mm (MEA6F/F) and 6.5 ± 0.5 mm (P-Cre;MEA6F/F), unpaired t-test, p > 0.05. Total area: 2.2 ± 0.2 E4 μm2 (MEA6F/F) and 2.4 ± 0.2 E4 μm2 (P-Cre;MEA6F/F), unpaired t-test, p > 0.05. Number of crossing: 0.9 ± 0.2 per 100 μm2 (MEA6F/F) and 2.5 ± 0.3 per 100 μm2 (P-Cre;MEA6F/F), unpaired t-test, *p < 0.05. Gray dots indicate individual data points. (C) PCs from MEA6F/F and N-Cre;MEA6F/F mice (P21) are shown by z-projections of confocal images (left and middle panels) or skeletonized reconstructions (right panel). High magnification images shown in the middle correspond to the respective boxed regions in the left. White arrows indicate self-crossings. Scale bars: 50 μm (left panel) and 10 μm (middle panel). Bar graphs show the quantification of number of branches, total dendrite length, total area of dendritic arbor, and number of self-crossing per 100 μm2 of dendrite area of MEA6F/F (n = 9 from 9 mice) and N-Cre;MEA6F/F (n = 5 from 9 mice) PCs. Number of branches: 752 ± 77 per cell (MEA6F/F) and 639 ± 112 per cell (N-Cre;MEA6F/F), unpaired t-test, p > 0.05. Total dendrite length: 6.0 ± 0.5 mm (MEA6F/F) and 4.4 ± 0.3 mm (N-Cre;MEA6F/F), unpaired t-test, *p < 0.05. Total area: 2.4 ± 0.3 E4 μm2 (MEA6F/F) and 1.4 ± 0.3 E4 μm2 (N-Cre;MEA6F/F), unpaired t-test, *p < 0.05. Number of crossing: 1.0 ± 0.2 per 100 μm2 (MEA6F/F) and 2.6 ± 0.3 per 100 μm2 (N-Cre;MEA6F/F), unpaired t-test, ∗∗p < 0.01. Gray dots indicate individual data points. (D) Protein levels of γ-Pcdh, BDNF, TrkB, Slit2, Robo2, MEA6, and PSD95 in the MEA6F/F and P-Cre;MEA6F/F cerebellum at P20 were analyzed by Western blotting. The results were obtained from 3 pairs of mice. β-tubulin was used as the loading control. Gray dots indicate individual data points. *p < 0.05.
FIGURE 6
FIGURE 6
MEA6 deficiency affects the transport of Slit2 from ER to Golgi apparatus. (A) A cartoon illustrating the procedures for the purification of subcellular organelles. More details are given in Experimental Procedures. (B) The purification of ER was confirmed by the Western blotting assay of marker proteins, including PDI, γ-adaptin, YY1, PSD95, VDAC, and Rab11. H, P1, P2, S3 and P4 refer to homogenate, pellet 1, pellet 2, supernatant 3, and pellet 4, respectively. The experiment was performed using 3 WT mice. (C) The protein levels of PDI and Bip were not changed in both N-Cre;MEA6F/F and P-Cre;MEA6F/F mice compared with corresponding control MEA6F/F mice. GAPDH was used as the loading control. The results were obtained from 4 pairs of mice. Gray dots indicate individual data points. (D) Western blotting assay of Slit2, BDNF, and Sema3A in ER purified from MEA6F/F and N-Cre;MEA6F/F mice cerebellum at P21. Bip was used as the internal control. Slit2: 100 ± 4% (MEA6F/F) and 140 ± 11% (N-Cre;MEA6F/F). BDNF: 100 ± 2% (MEA6F/F) and 130 ± 10% (N-Cre;MEA6F/F). Semaphorin 3A (Sema3A): 100 ± 2% (MEA6F/F) and 121 ± 8% (N-Cre;MEA6F/F). The results were obtained from 6 pairs of mice. Gray dots indicate individual data points. Unpaired t-test, *p < 0.05. (E) Western assay of Slit2 and Sema3A in ER purified from MEA6F/F and P-Cre;MEA6F/F mice cerebellum at P21. Bip was used as internal control. Slit2: 100 ± 1% (MEA6F/F) and 122 ± 4% (P-Cre;MEA6F/F). Sema3A: 100 ± 1% (MEA6F/F) and 120 ± 2% (P-Cre;MEA6F/F). The results were obtained from 6 pairs of mice. Gray dots indicate individual data points. Unpaired t-test, *p < 0.05.

Comment in

Similar articles

Cited by

References

    1. Antonny B., Schekman R. (2001). ER export: public transportation by the COPII coach. Curr. Opin. Cell Biol. 13 438–443. 10.1016/s0955-0674(00)00234-9 - DOI - PubMed
    1. Becker E. B., Oliver P. L., Glitsch M. D., Banks G. T., Achilli F., Hardy A., et al. (2009). A point mutation in TRPC3 causes abnormal Purkinje cell development and cerebellar ataxia in moonwalker mice. Proc. Natl. Acad. Sci. U.S.A. 106 6706–6711. 10.1073/pnas.0810599106 - DOI - PMC - PubMed
    1. Choo M., Miyazaki T., Yamazaki M., Kawamura M., Nakazawa T., Zhang J., et al. (2017). Retrograde BDNF to TrkB signaling promotes synapse elimination in the developing cerebellum. Nat. Commun. 8:195. 10.1038/s41467-017-00260-w - DOI - PMC - PubMed
    1. Comtesse N., Niedermayer I., Glass B., Heckel D., Maldener E., Nastainczyk W., et al. (2002). MGEA6 is tumor-specific overexpressed and frequently recognized by patient-serum antibodies. Oncogene 21 239–247. 10.1038/sj.onc.1205005 - DOI - PubMed
    1. Donald S., Humby T., Fyfe I., Segonds-Pichon A., Walker S. A., Andrews S. R., et al. (2008). P-Rex2 regulates Purkinje cell dendrite morphology and motor coordination. Proc. Natl. Acad. Sci. U.S.A. 105 4483–4488. 10.1073/pnas.0712324105 - DOI - PMC - PubMed

LinkOut - more resources