

Early-Onset Molecular Derangements in the Olfactory Bulb of Tg2576 Mice: Novel Insights Into the Stress-Responsive Olfactory Kinase Dynamics in Alzheimer's Disease
- PMID: 31244650
- PMCID: PMC6579864
- DOI: 10.3389/fnagi.2019.00141
Early-Onset Molecular Derangements in the Olfactory Bulb of Tg2576 Mice: Novel Insights Into the Stress-Responsive Olfactory Kinase Dynamics in Alzheimer's Disease
Abstract
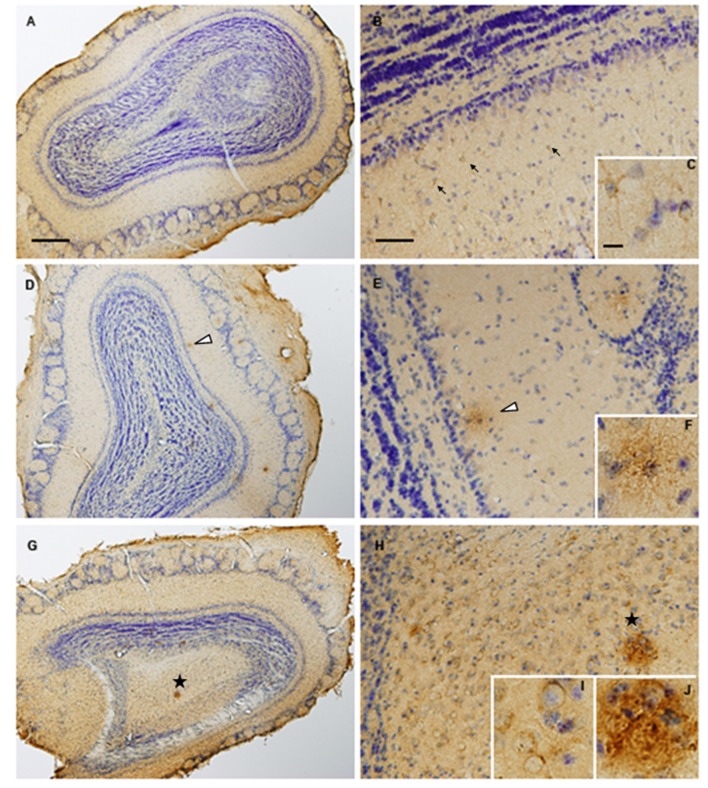
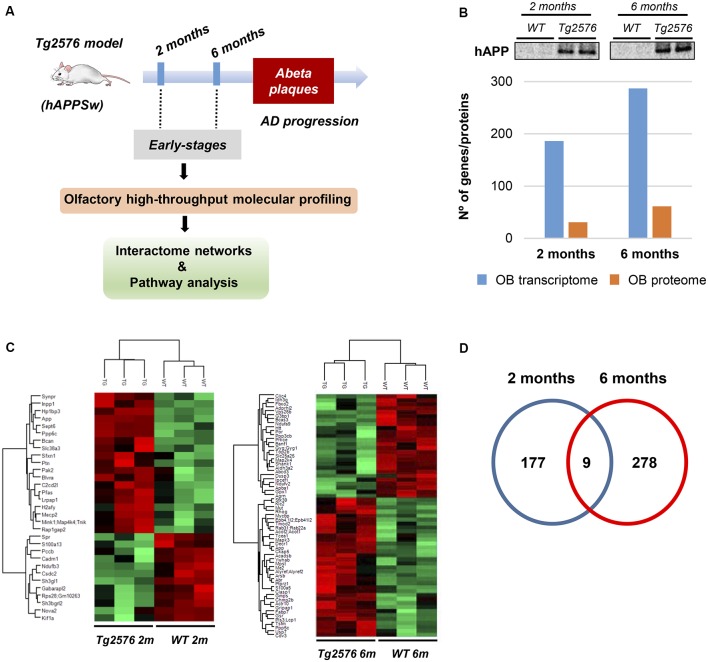
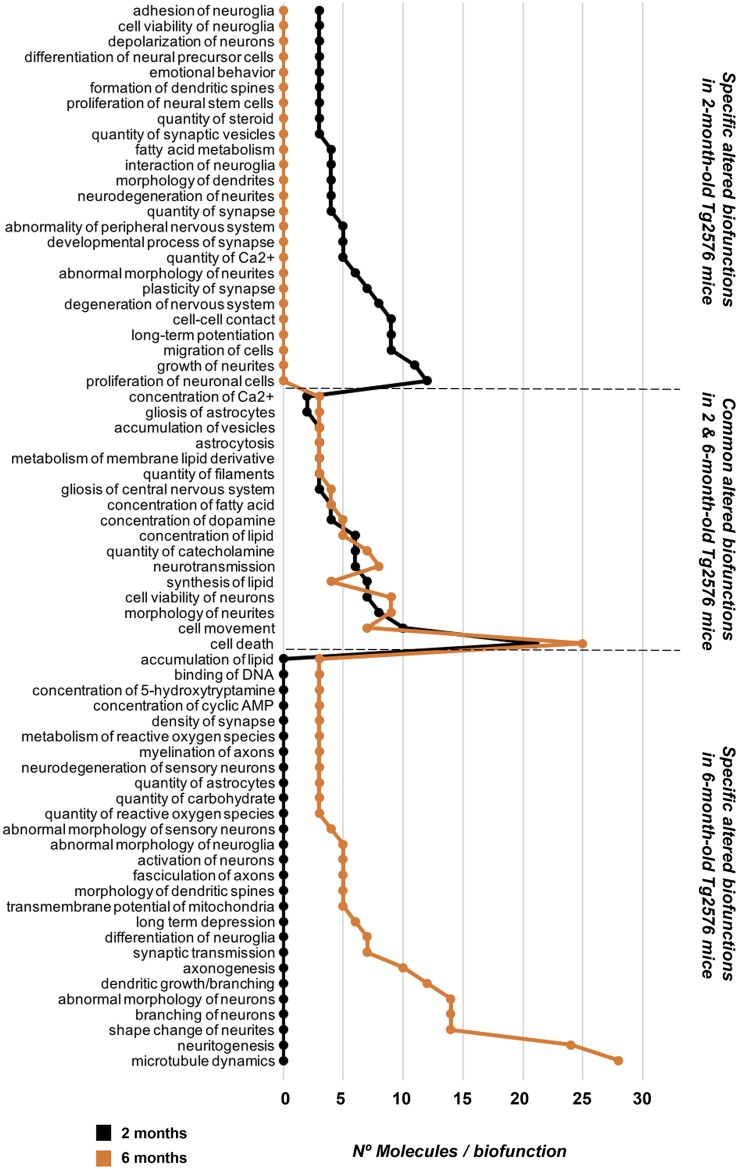
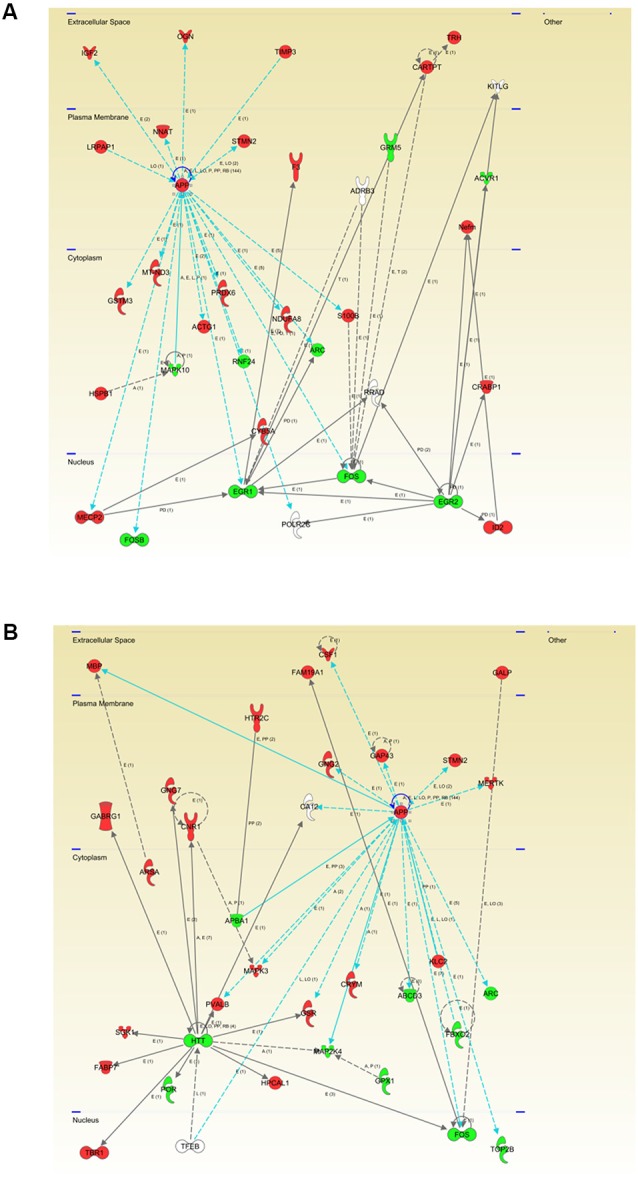
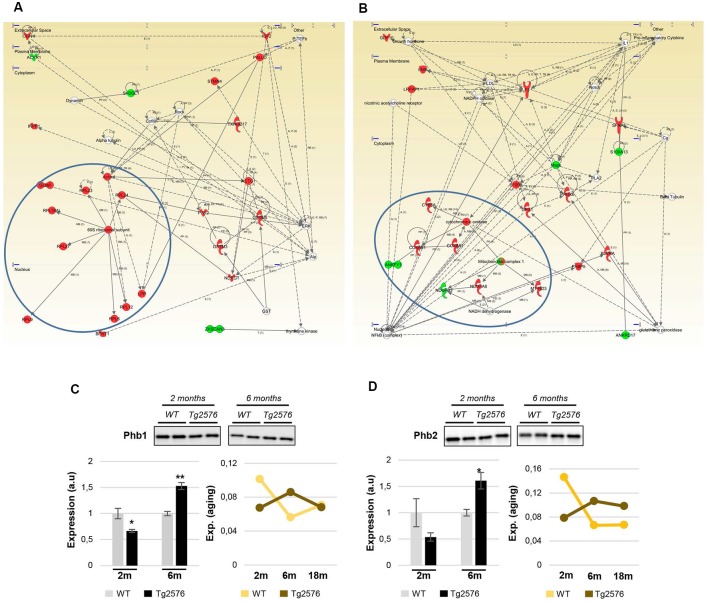
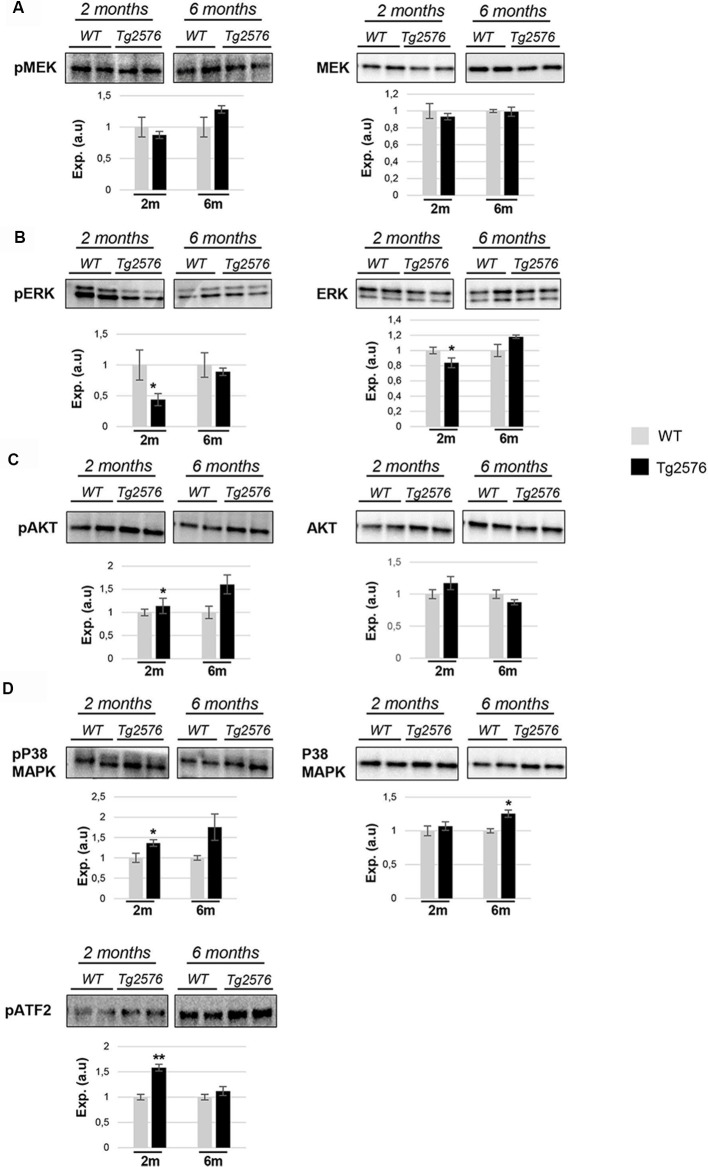
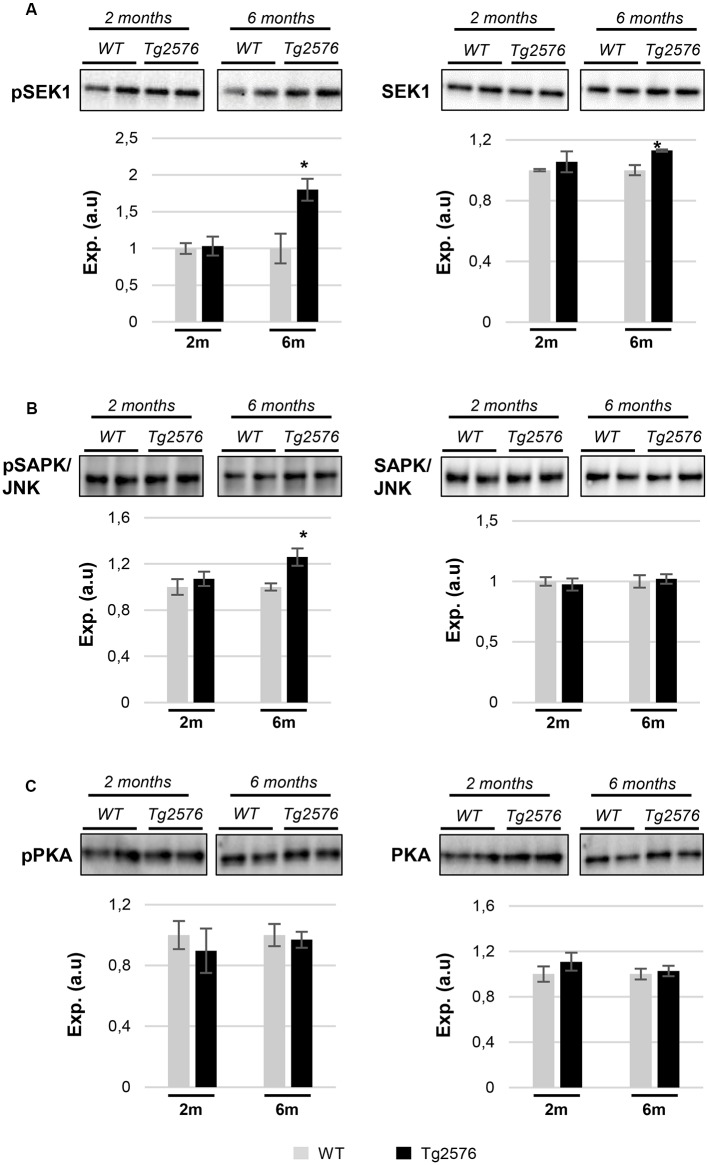
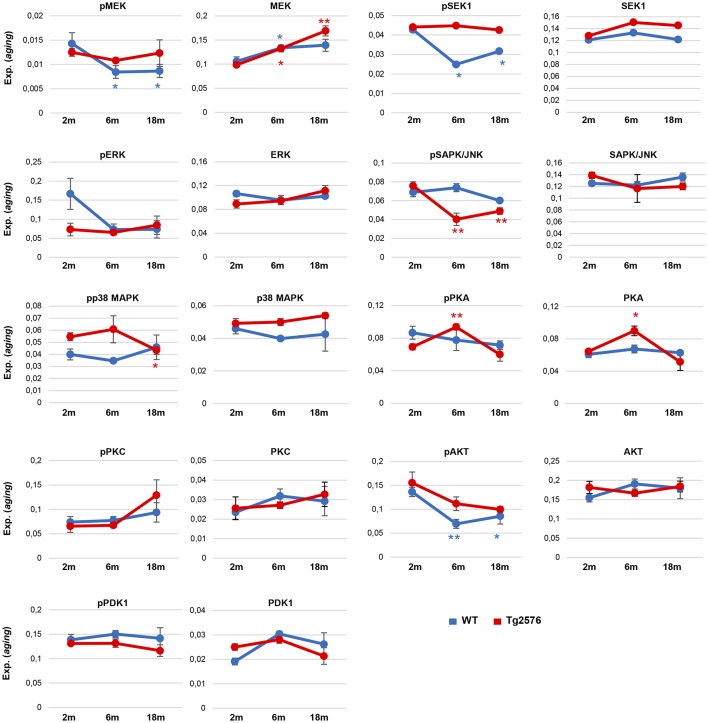
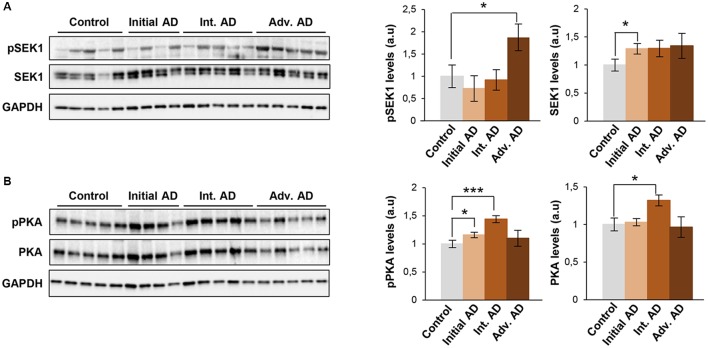
The olfactory bulb (OB) is the first processing station in the olfactory pathway. Despite smell impairment, which is considered an early event in Alzheimer's disease (AD), little is known about the initial molecular disturbances that accompany the AD development at olfactory level. We have interrogated the time-dependent OB molecular landscape in Tg2576 AD mice prior to the appearance of neuropathological amyloid plaques (2-, and 6-month-old), using combinatorial omics analysis. The metabolic modulation induced by overproduction of human mutated amyloid precursor protein (APP) clearly differs between both time points. Besides the progressive perturbation of the APP interactome, functional network analysis unveiled an inverse regulation of downstream extracellular signal-regulated kinase (ERK1/2), and p38 mitogen-activated protein kinase (MAPK) routes in 2-month-old Tg2576 mice with respect to wild-type (WT) mice. In contrast, Akt and MAPK kinase 4 (SEK1)/ stress-activated protein kinase (SAPK) axis were parallel activated in the OB of 6-months-old-Tg2576 mice. Furthermore, a survival kinome profiling performed during the aging process (2-, 6-, and 18-month-old) revealed that olfactory APP overexpression leads to changes in the activation dynamics of protein kinase A (PKA), and SEK1/MKK4-SAPK/JNK between 6 and 18 months of age, when memory deficits appear and AD pathology is well established in transgenic mice. Interestingly, both olfactory pathways were differentially activated in a stage-dependent manner in human sporadic AD subjects with different neuropathological grading. Taken together, our data reflect the early impact of mutated APP on the OB molecular homeostasis, highlighting the progressive modulation of specific signaling pathways during the olfactory amyloidogenic pathology.
Keywords: Alzheimer’s disease; Tg2576 mice; network biology; olfactory bulb; proteomics; transcriptomics.
Figures
Similar articles
-
An early dysregulation of FAK and MEK/ERK signaling pathways precedes the β-amyloid deposition in the olfactory bulb of APP/PS1 mouse model of Alzheimer's disease.J Proteomics. 2016 Oct 4;148:149-58. doi: 10.1016/j.jprot.2016.07.032. Epub 2016 Aug 3. J Proteomics. 2016. PMID: 27498392
-
Network-Driven Proteogenomics Unveils an Aging-Related Imbalance in the Olfactory IκBα-NFκB p65 Complex Functionality in Tg2576 Alzheimer's Disease Mouse Model.Int J Mol Sci. 2017 Oct 27;18(11):2260. doi: 10.3390/ijms18112260. Int J Mol Sci. 2017. PMID: 29077059 Free PMC article.
-
Olfactory bulb neuroproteomics reveals a chronological perturbation of survival routes and a disruption of prohibitin complex during Alzheimer's disease progression.Sci Rep. 2017 Aug 22;7(1):9115. doi: 10.1038/s41598-017-09481-x. Sci Rep. 2017. PMID: 28831118 Free PMC article.
-
Current advances on different kinases involved in tau phosphorylation, and implications in Alzheimer's disease and tauopathies.Curr Alzheimer Res. 2005 Jan;2(1):3-18. doi: 10.2174/1567205052772713. Curr Alzheimer Res. 2005. PMID: 15977985 Review.
-
Impaired autophagy and APP processing in Alzheimer's disease: The potential role of Beclin 1 interactome.Prog Neurobiol. 2013 Jul-Aug;106-107:33-54. doi: 10.1016/j.pneurobio.2013.06.002. Epub 2013 Jul 1. Prog Neurobiol. 2013. PMID: 23827971 Review.
Cited by
-
Pathway-based integration of multi-omics data reveals lipidomics alterations validated in an Alzheimer's disease mouse model and risk loci carriers.J Neurochem. 2023 Jan;164(1):57-76. doi: 10.1111/jnc.15719. Epub 2022 Dec 12. J Neurochem. 2023. PMID: 36326588 Free PMC article.
-
Diagnostic value of olfactory function testing for Alzheimer's disease and mild cognitive impairment: a systematic review and meta-analysis.Front Aging Neurosci. 2025 May 15;17:1551939. doi: 10.3389/fnagi.2025.1551939. eCollection 2025. Front Aging Neurosci. 2025. PMID: 40443794 Free PMC article.
-
Metabolic dyshomeostasis induced by SARS-CoV-2 structural proteins reveals immunological insights into viral olfactory interactions.Front Immunol. 2022 Sep 8;13:866564. doi: 10.3389/fimmu.2022.866564. eCollection 2022. Front Immunol. 2022. PMID: 36159830 Free PMC article.
-
Proteomic Characterization of the Olfactory Molecular Imbalance in Dementia with Lewy Bodies.Int J Mol Sci. 2020 Sep 2;21(17):6371. doi: 10.3390/ijms21176371. Int J Mol Sci. 2020. PMID: 32887355 Free PMC article.
-
Alzheimer's Disease: What Can We Learn From the Peripheral Olfactory System?Front Neurosci. 2020 May 19;14:440. doi: 10.3389/fnins.2020.00440. eCollection 2020. Front Neurosci. 2020. PMID: 32508565 Free PMC article. Review.
References
-
- Bachstetter A. D., Xing B., de Almeida L., Dimayuga E. R., Watterson D. M., Van Eldik L. J. (2011). Microglial p38α MAPK is a key regulator of proinflammatory cytokine up-regulation induced by toll-like receptor (TLR) ligands or β-amyloid (Aβ). J. Neuroinflammation 8:79. 10.1186/1742-2094-8-79 - DOI - PMC - PubMed
LinkOut - more resources
Full Text Sources
Molecular Biology Databases
Research Materials
Miscellaneous