. 2019 Jun 11:10:605.
doi: 10.3389/fphar.2019.00605. eCollection 2019.

A Receptor Model With Binding Affinity, Activation Efficacy, and Signal Amplification Parameters for Complex Fractional Response Versus Occupancy Data

Affiliations

A Receptor Model With Binding Affinity, Activation Efficacy, and Signal Amplification Parameters for Complex Fractional Response Versus Occupancy Data

Peter Buchwald. Front Pharmacol. .

Abstract

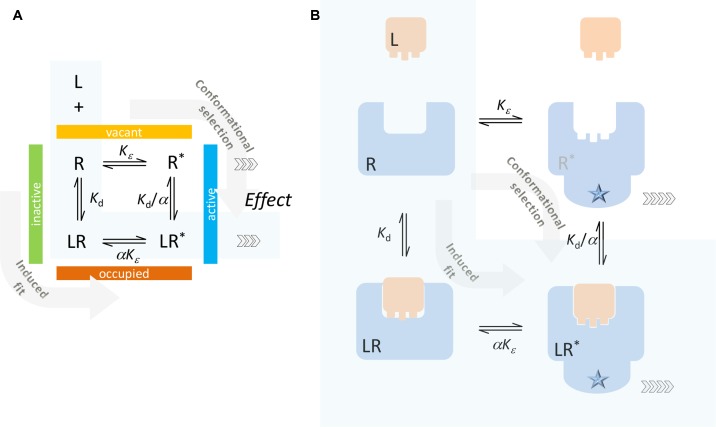
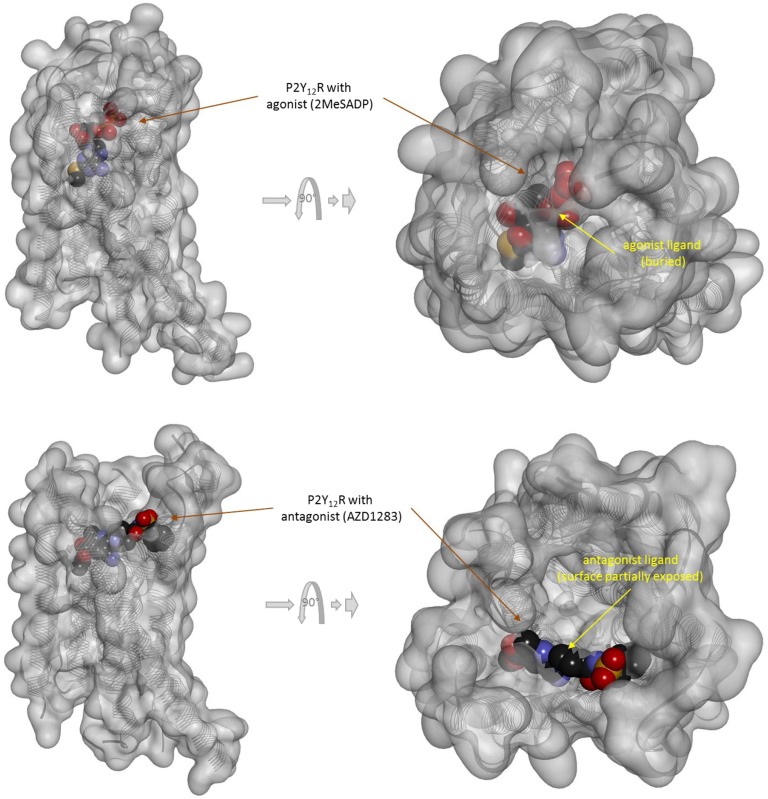
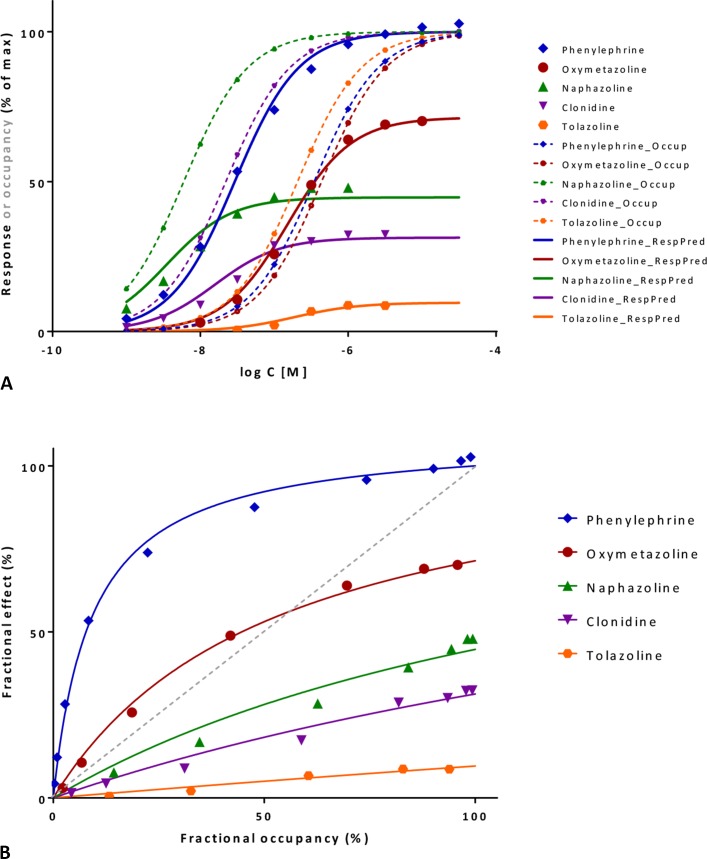
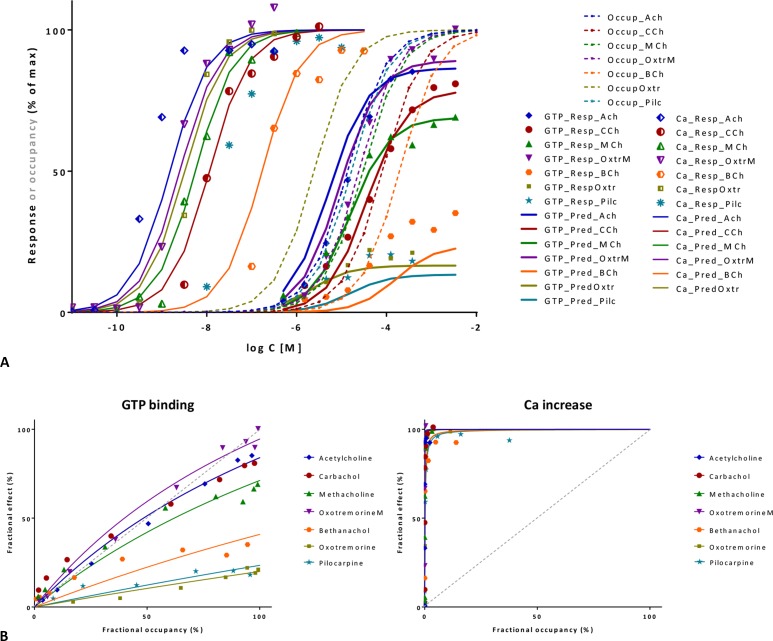
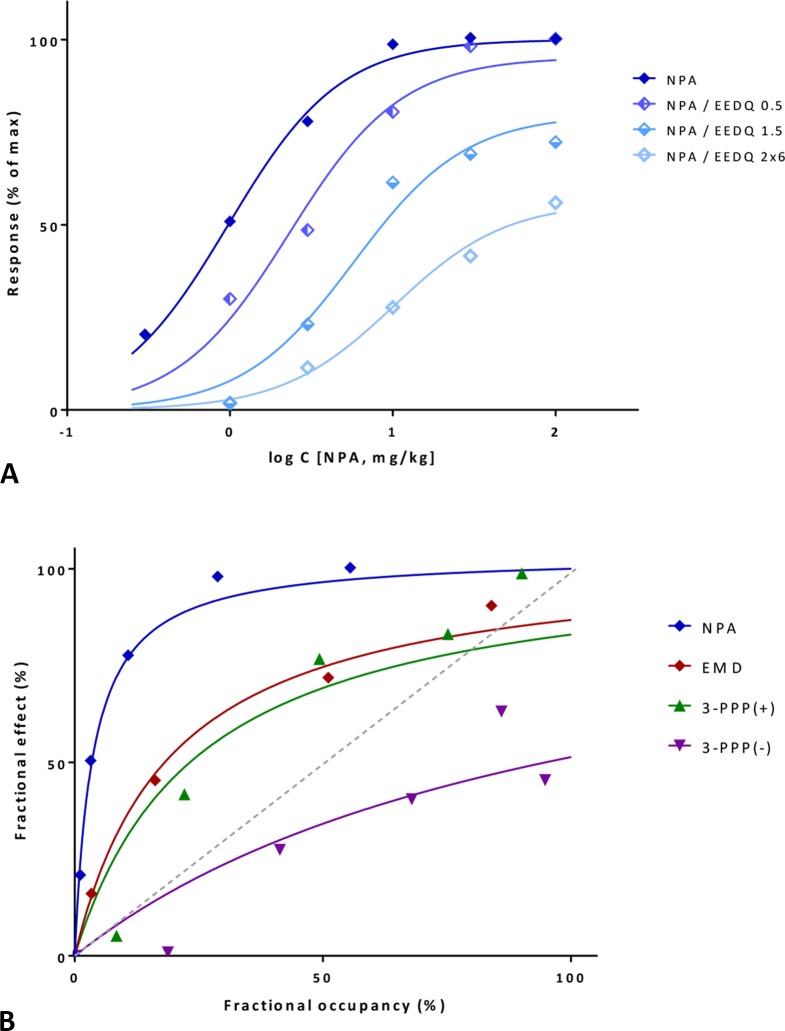
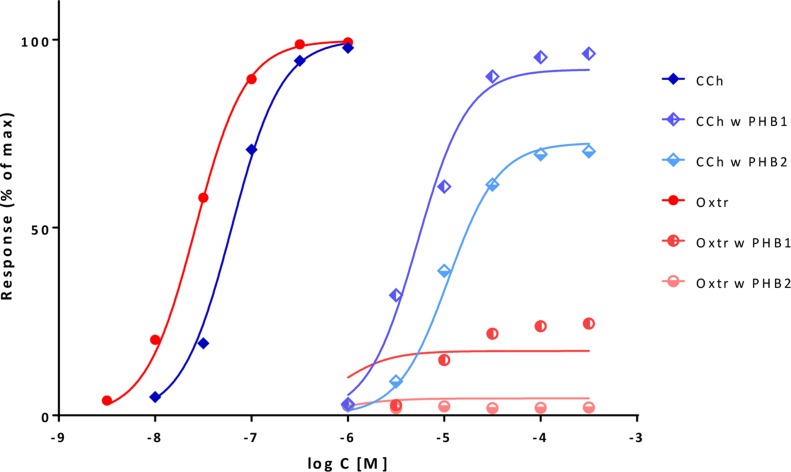
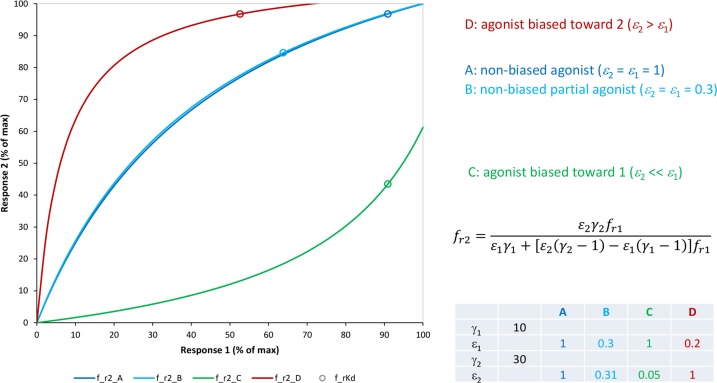
In quantitative pharmacology, multi-parameter receptor models are needed to account for the complex nonlinear relationship between fractional occupancy and response that can occur due to the intermixing of the effects of partial receptor activation and post-receptor signal amplification. Here, a general two-state receptor model and corresponding quantitative forms are proposed that unify three distinct processes, each characterized with its own parameter: 1) receptor binding, characterized by K d, the equilibrium dissociation constant used for binding affinity; 2) receptor activation, characterized by an (intrinsic) efficacy parameter ε; and 3) post-activation signal transduction (amplification), characterized by a gain parameter γ. Constitutive activity is accommodated via an additional ε R0 parameter quantifying the activation of the ligand-free receptor. Receptors can be active or inactive in both their ligand-free and ligand-bound states (two-state receptor theory), but ligand binding alters the likelihood of activation (induced fit). Because structural data now confirm that for most receptors in their active conformation, the small-molecule ligand-binding site is buried inside, straightforward binding to the active form (direct conformational selection) is unlikely. The proposed general equation has parameters that are more intuitive and better suited for optimization by nonlinear regression than those of the operational (Black and Leff) or del Castillo-Katz model. The model provides a unified framework for fitting complex data including a) fractional responses that do not match independently measured fractional occupancies, b) responses measured after partial irreversible inactivation of the "receptor reserve" (Furchgott method), c) fractional responses that are different along distinct downstream pathways (biased agonism), and d) responses with constitutive receptor activity. Furthermore, unlike previous models, the present one can be reduced back for special cases of its parameters to consecutively nested simplified forms that can be used on their own when adequate (e.g., ε R0 = 0, no constitutive activity; γ = 1: E max model for partial agonism; ε = 1: Clark equation).

Keywords: G-protein–coupled receptors; affinity; biased agonism; constitutive activity; efficacy; free energy; ligand binding; partial agonism.


Figures

Figure 1
Figure 1
The present general two-state SABRE receptor model (A) and its consecutively nested simplifications down to the Clark equation (B to F). For each model, a schematic illustration of its basic assumption on ligand binding and receptor activation is shown together with the corresponding quantitative form relating the fractional effect (E/E max) to the ligand concentration [L].
Figure 2
Figure 2
Typical two-state receptor model with assumption of different binding affinities for the inactive and active forms of the receptor (R and R*, respectively). Schematics (A) and a simplified illustration of the corresponding processes (B) are shown. The ligand can bind to the inactive form of the receptor (R) and contribute to its activation (induced fit, conformational induction) or bind to the active form (R*) and lock it preferentially in that conformation (conformational selection). The case corresponding to the minimal two-state theory (no constitutive activity, i.e., ligand-free receptor has no active form) is highlighted with a light blue background.
Figure 3
Figure 3
Present two-state model: schematics (A) and a possible simplified illustration (B). A single binding affinity (K d) is assumed that represents an ensemble average of the binding to the active and inactive conformations. In most cases, direct binding of small-molecule ligand to the active R* form is unlikely (as indicated by the red X mark) since the ligand-binding domain (LBD) sites are buried deep inside the receptor and are not directly accessible from the surrounding environment. Again, the case corresponding to the minimal two-state theory (no constitutive activity, i.e., ligand-free receptor has no active form) is highlighted with a light blue background.
Figure 4
Figure 4
(A) Semilog concentration–response curves with the present model for a receptor without constitutive activity (Equation 4, Figure 1C ) and ligands with 100 nM affinity (K d = 10–7 M). Response curves shown are for a full and a weak partial agonist (ε=1, blue lines and ε=0.25, red lines, respectively) at different amplifications (γ=1, 3, and 100; denoted with full and dashed lines, respectively). Another partial agonist without amplification is also included (ε=0.70, γ=1 orange line) for comparison. Note that with the present model, the basic parametrization (ε=1, γ=1) fully reproduces the Clark model (blue and double green lines completely overlap), which could not be done with previous models such as the operational model. (B) Illustrative response curves with the present model for a case with constitutive activity (ε R0=0.3) and no amplification ( Figure 1B ). Response curves for full, partial, and inverse agonists as well as a neutral antagonist with the same affinity as in A (K d = 10–7 M) are shown as obtained with the efficacy parametrization of the present model.
Figure 5
Figure 5
Three-dimensional structure of the agonist (adrenalin, epinephrine) bound active form of the β2-adrenergic receptor (a type Aα GPCR). The structure [PDB ID 4LDO (Ring et al., 2013)] is shown from two different perspectives (the one on the right being a 90° rotated and somewhat enlarged view from the top). The receptor is covered with a semi-transparent gray surface and the secondary protein structure indicated; the ligand is highlighted as a darker solid CPK structure. The ligand is somewhat faded as it is buried inside the receptor and obscured by the covering semitransparent surface; this is intended to illustrate that this position is not accessible for direct binding from outside.
Figure 6
Figure 6
Three-dimensional structure of the agonist (2MeSADP; top) and antagonist (AZD1283; bottom) bound forms of the purinergic P2Y12 receptor (a type Aδ GPCR). Structures [PDB IDs 4PXZ and 4NTJ (Zhang et al., ; Zhang et al., 2014b)] are shown covered with a semi-transparent gray surface and the secondary protein structure indicated; ligands are highlighted as darker solid CPK structures. Both are shown from two different perspectives with the one on the right being a 90° rotated and somewhat enlarged view from the top. The ligands are faded as they buried inside the receptor and are obscured by the covering surfaces; however, the antagonist (bottom) is less buried than the agonist (top) so that part of its surface is not covered and accessible from outside as indicated by its more vivid colors where directly visible.
Figure 7
Figure 7
Three-dimensional structure of the agonist- (dexamethasone; left) and antagonist- (mifepristone; right) bound forms of the glucocorticoid receptor (a nuclear receptor). Structures [PDB IDs 1P93 and 1NHZ (Kauppi et al., 2003)] are shown from two different perspectives (the bottom one being a 90° rotated view as indicated by the arrows). Receptors are shown covered with a semi-transparent gray surface and the secondary protein structure indicated; the ligands are highlighted as darker solid CPK structures. The ligands are faded as they buried inside the receptors and are obscured by the covering surfaces; however, the antagonist (right) is less buried than the agonist (left) so that part of its surface is not covered and accessible from outside as indicated by its more vivid colors where directly visible.
Figure 8
Figure 8
Three-dimensional structure of the agonist (glutamate) bound form of the AMPA receptor (a ligand-gate ion channel or ionotropic receptor). Structure [PDB ID 1P93 (Twomey et al., 2017)] is shown with the receptor shown covered with a semi-transparent gray surface and the secondary protein structure indicated; ligands are highlighted as darker solid CPK structures (inset shows a section around the bound ligand as an enlargement). As before, the ligands are faded as they buried inside the receptors and are obscured by the covering surfaces.
Figure 9
Figure 9
Fit of complex concentration-response data with the present model, Case I: Activity and binding data for a series of imidazoline-type α-adrenoceptor agonists (data after Ruffolo et al., 1979). (A) Fractional response as a function of log concentration for five compounds (symbols) fitted by the present model (Equation 4) using independently derived K d values for binding affinity. Fitting of the response data is done by adjusting only one common γ (gain) and five individual ε (efficacy) parameters (Table S1.C). Fractional receptor occupancy data [calculated from the average K d determined by two different methods (Ruffolo et al., 1979)] are also shown as dashed lines to highlight the ability of the model to account for the ligand-dependent mismatch between fractional response and occupancy. (B) Fractional response vs. occupancy data for these five compounds (symbols) and their corresponding fit with the present model fitted directly via the newly derived Equation 27. Note that the functional response can either exceed or lag behind the fractional occupancy data; for one compound (oxymetazoline), both occur depending on the ligand concentration.
Figure 10
Figure 10
Fit of complex concentration-response data with the present model, Case II: Activity and binding data for a series of muscarinic agonists (data after Sykes et al., 2009). Responses were measured at two different points after M3 receptor activation: stimulation of GTP binding to Gα subunits and subsequent increase in intracellular Ca levels, respectively. (A) Fractional GTP and Ca responses (closed and semi-open symbols, respectively) as a function of log concentration for seven compounds fitted by the present model using independently derived K d values for binding affinity (Sykes et al., 2009) (Equation 4; thicker and thinner lines, respectively). Fitting of the response data is done by adjusting only two common γ (gain) and seven individual ε (efficacy) parameters (Table S2). Fractional receptor occupancy data [calculated from the K d determined for the receptor binding by competition assays (Sykes et al., 2009)] are also shown as dashed lines to highlight the ability of the model to account for the ligand-dependent mismatch between the two different fractional responses and occupancy. (B) Fractional response vs. occupancy data in the GTP (left) and Ca (right) assays for these seven compounds (symbols) and their corresponding fit with the present model fitted directly via Equation 27. The very different amplification of these two responses assessed here at two different vantage points along the pathway is quite evident from these graphs.
Figure 11
Figure 11
Fit of complex concentration-response data with the present model, Case III: Activity and binding data for the dopamine agonist reversal of γ-butyrolactone-induced striatal L-DOPA accumulation in rats (after Meller et al., 1987). (A) Percent of maximal response for N-propylnorapomorphine (NPA) and following inhibition by increasing doses of the irreversible antagonist EEDQ (0.5, 1.5, and 2×6 mg/kg). Experimental data (symbols) were fitted with the present model (lines) using Equation 33 with a single K d and γ parameter and different ε values to account for the effect of inactivation via q. (B) Fractional response vs. occupancy data obtained in the same system (without inhibition) for four different compounds (NPA, EMD 23,448, (+)3-PPP, and (–)3-PPP). Occupancy data as calculated from K d estimates in Meller et al. (1987). Data (symbols) were fitted with the present model (lines) using Equation 22 with a single γ parameter. Note that the gain parameters obtained from the same signaling pathway, but with different data sets derived from different methods are in good agreement (Table S3).
Figure 12
Figure 12
Fit of complex concentration-response data with the present model, Case IV: Fractional response curves of guinea-pig ileum contraction mediated by muscarinic receptor activation with carbachol (CCh; blue diamonds) and oxotremorine (Oxtr; red circles) in normal tissue and following inactivation through alkylation with phenoxybenzamine (PHB) at two different strengths (data after Kenakin, ; Kenakin and Christopoulos, 2011). Unified fit of all data with the present model is shown (lines) using a single γ amplification parameter for this pathway, single K d affinity parameters for carbachol and oxotremorine, and the same q values for the PBA inactivation for both compounds (Table S4).
Figure 13
Figure 13
Simulated relative response (“bias”) plots with the present model (Equation 38) for two pathways with different amplifications (γ 1=10 and γ 2=30) and for agonists A–D with efficacies ε 1 and ε 2 as indicated. Small circles along the lines indicate the responses corresponding to 50% occupancy (i.e., at ligand concentrations of K d) to illustrate the mismatch between fractional responses and fractional occupancies along each pathway.
Figure 14
Figure 14
Fit of complex concentration-response data with the present model, Case V: Activity and binding data for different opioids in cells expressing wildtype μ-opioid receptor in the cAMP (A) and β-arrestin2 (B) assays, respectively (after Hothersall et al., 2017) and fitted with the present model (Equation 4). Corresponding fractional response vs. occupancy plots generated using pK i values derived from [3H]diprenorphine competition assays and fitted with the model (Equation 27) are shown for cAMP (C) and β-arrestin2 (D). A relative response plot (“bias plot”) showing the fractional responses plotted against each other is included in (E).
Figure 15
Figure 15
Fit of complex concentration-response data with the present model, Case VI: Activity data for fractional receptor-G protein coupling obtained with different opioids that share a peptidomimetic scaffold in δ- and μ-opioid receptors (top and bottom, respectively; after Vezzi et al., 2013) and fitted with the present model (Equation 19).

References

    1. Adams J. U., Paronis C. A., Holtzman S. G. (1990). Assessment of relative intrinsic activity of mu-opioid analgesics in vivo by using beta-funaltrexamine. J. Pharmacol. Exp. Ther. 255 (3), 1027–1032. - PubMed
    1. Adham N., Ellerbrock B., Hartig P., Weinshank R. L., Branchek T. (1993). Receptor reserve masks partial agonist activity of drugs in a cloned rat 5-hydroxytryptamine1B receptor expression system. Mol. Pharmacol. 43 (3), 427–433. - PubMed
    1. Alexander S. P., Kelly E., Marrion N. V., Peters J. A., Faccenda E., Harding S. D., et al. (2017). The concise guide to Pharmacology 2017/18: Overview. Br. J. Pharmacol. 174 Suppl 1, S1–S16. 10.1111/bph.13882 - DOI - PMC - PubMed
    1. Ariëns E. J. (1954). Affinity and intrinsic activity in the theory of competitive inhibition. Arch. Int. Pharmacodyn. Ther. 99 (1), 32–49. - PubMed
    1. Arkin M. R., Wells J. A. (2004). Small-molecule inhibitors of protein–protein interactions: progressing towards the dream. Nat. Rev. Drug Discov. 3 (4), 301–317. 10.1038/nrd1343 - DOI - PubMed

LinkOut - more resources