

Spatial Lymphocyte Dynamics in Lymph Nodes Predicts the Cytotoxic T Cell Frequency Needed for HIV Infection Control
- PMID: 31244829
- PMCID: PMC6579925
- DOI: 10.3389/fimmu.2019.01213
Spatial Lymphocyte Dynamics in Lymph Nodes Predicts the Cytotoxic T Cell Frequency Needed for HIV Infection Control
Erratum in
-
Corrigendum: Spatial Lymphocyte Dynamics in Lymph Nodes Predicts the Cytotoxic T Cell Frequency Needed for HIV Infection Control.Front Immunol. 2019 Jul 3;10:1538. doi: 10.3389/fimmu.2019.01538. eCollection 2019. Front Immunol. 2019. PMID: 31333669 Free PMC article.
Abstract
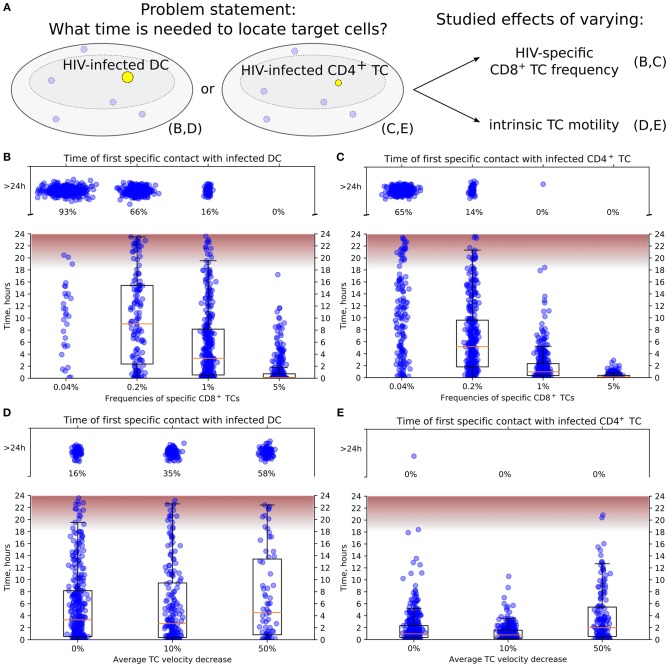
The surveillance of host body tissues by immune cells is central for mediating their defense function. In vivo imaging technologies have been used to quantitatively characterize target cell scanning and migration of lymphocytes within lymph nodes (LNs). The translation of these quantitative insights into a predictive understanding of immune system functioning in response to various perturbations critically depends on computational tools linking the individual immune cell properties with the emergent behavior of the immune system. By choosing the Newtonian second law for the governing equations, we developed a broadly applicable mathematical model linking individual and coordinated T-cell behaviors. The spatial cell dynamics is described by a superposition of autonomous locomotion, intercellular interaction, and viscous damping processes. The model is calibrated using in vivo data on T-cell motility metrics in LNs such as the translational speeds, turning angle speeds, and meandering indices. The model is applied to predict the impact of T-cell motility on protection against HIV infection, i.e., to estimate the threshold frequency of HIV-specific cytotoxic T cells (CTLs) that is required to detect productively infected cells before the release of viral particles starts. With this, it provides guidance for HIV vaccine studies allowing for the migration of cells in fibrotic LNs.
Keywords: HIV infection; cell motility; cytotoxic T cell scanning; dissipative particle dynamics; lymphoid tissue; multicellular dynamics; stochastic differential equation.
Figures


Similar articles
-
Decreased CXCR3+ CD8 T cells in advanced human immunodeficiency virus infection suggest that a homing defect contributes to cytotoxic T-lymphocyte dysfunction.J Virol. 2007 Aug;81(16):8439-50. doi: 10.1128/JVI.00199-07. Epub 2007 Jun 6. J Virol. 2007. PMID: 17553894 Free PMC article.
-
CD4 lymphocytes in the blood of HIV(+) individuals migrate rapidly to lymph nodes and bone marrow: support for homing theory of CD4 cell depletion.J Leukoc Biol. 2002 Aug;72(2):271-8. J Leukoc Biol. 2002. PMID: 12149417
-
Mapping the Lineage Relationship between CXCR5+ and CXCR5- CD4+ T Cells in HIV-Infected Human Lymph Nodes.Cell Rep. 2019 Sep 17;28(12):3047-3060.e7. doi: 10.1016/j.celrep.2019.08.037. Cell Rep. 2019. PMID: 31533030 Free PMC article.
-
How does HIV cause depletion of CD4 lymphocytes? A mechanism involving virus signaling through its cellular receptors.Curr Mol Med. 2001 Nov;1(5):545-50. doi: 10.2174/1566524013363320. Curr Mol Med. 2001. PMID: 11899230 Review.
-
Model of HIV-1 disease progression based on virus-induced lymph node homing and homing-induced apoptosis of CD4+ lymphocytes.J Acquir Immune Defic Syndr. 2000 Aug 1;24(4):352-62. doi: 10.1097/00126334-200008010-00010. J Acquir Immune Defic Syndr. 2000. PMID: 11015152 Review.
Cited by
-
Functional cure of a chronic virus infection by shifting the virus - host equilibrium state.Front Immunol. 2022 Aug 30;13:904342. doi: 10.3389/fimmu.2022.904342. eCollection 2022. Front Immunol. 2022. PMID: 36110838 Free PMC article.
-
The Critical Importance of Spatial and Temporal Scales in Designing and Interpreting Immune Cell Migration Assays.Cells. 2021 Dec 7;10(12):3439. doi: 10.3390/cells10123439. Cells. 2021. PMID: 34943947 Free PMC article. Review.
-
Modeling of the HIV-1 Life Cycle in Productively Infected Cells to Predict Novel Therapeutic Targets.Pathogens. 2020 Mar 31;9(4):255. doi: 10.3390/pathogens9040255. Pathogens. 2020. PMID: 32244421 Free PMC article.
References
-
- Worbs T, Förster R. T cell migration dynamics within lymph nodes during steady state: an overview of extracellular and intracellular factors influencing the basal intranodal T cell motility. In: Dustin M, McGavern D. editors. Visualizing Immunity Current Topics in Microbiology and Immunology. Berlin; Heidelberg: Springer; (2009). p. 71–105. 10.1007/978-3-540-93864-4_4 - DOI - PubMed
Publication types
MeSH terms
LinkOut - more resources
Full Text Sources
Medical