

New directions in incidence and prevalence of diagnosed diabetes in the USA
- PMID: 31245008
- PMCID: PMC6557467
- DOI: 10.1136/bmjdrc-2019-000657
New directions in incidence and prevalence of diagnosed diabetes in the USA
Abstract
Objective: To determine whether diabetes prevalence and incidence has remained flat or changed direction during the past 5 years.
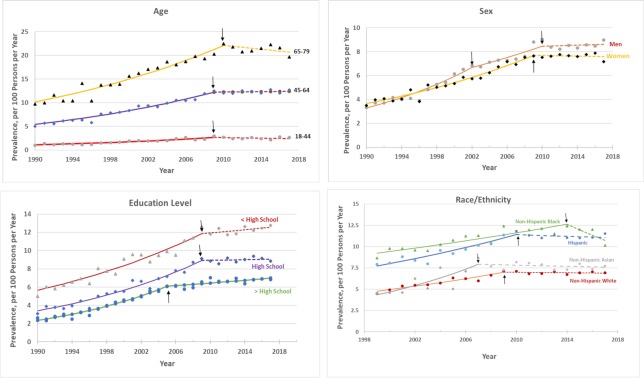
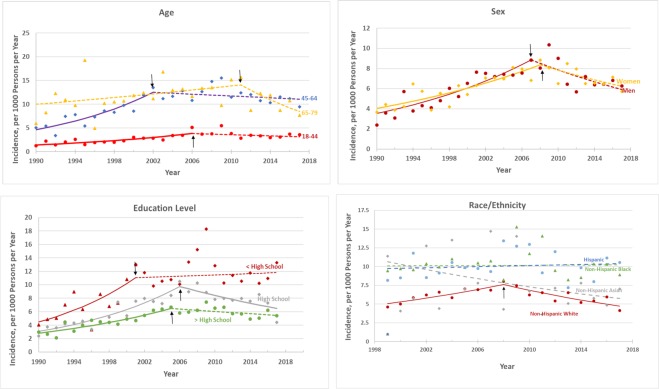
Research design and methods: We calculated annual prevalence and incidence of diagnosed diabetes (type 1 and type 2 combined) for civilian, non-institutionalized adults aged 18-79 years using annual, nationally representative cross-sectional survey data from the National Health Interview Survey from 1980 to 2017. Trends in rates by age group, sex, race/ethnicity, and education were calculated using annual percentage change (APC).
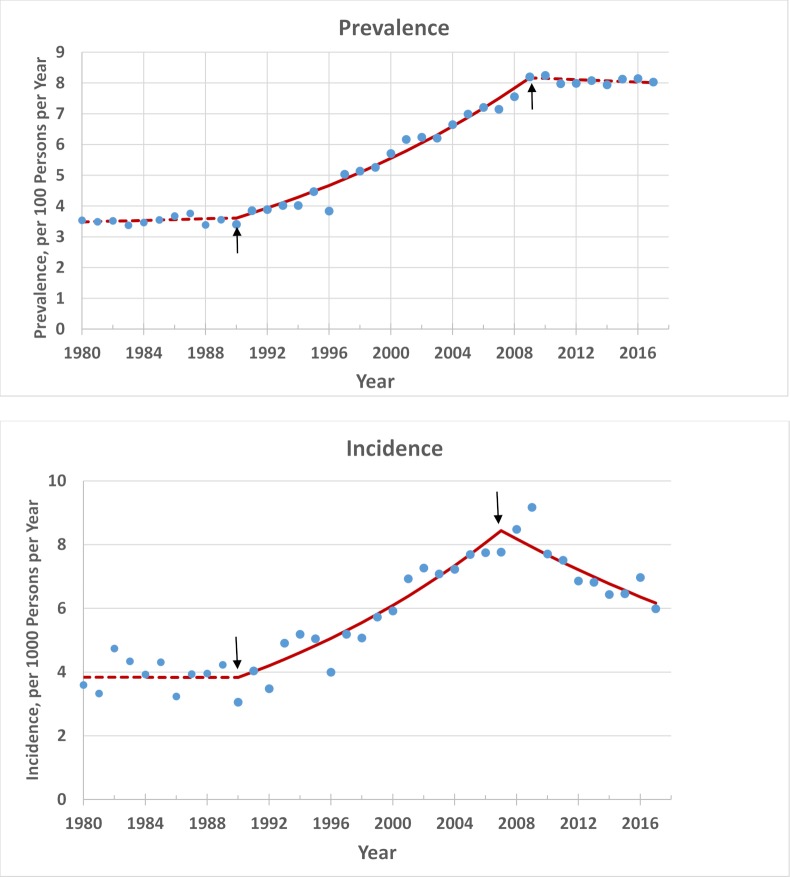
Results: Overall, the prevalence of age-adjusted, diagnosed diabetes did not change significantly from 1980 to 1990, but increased significantly (APC 4.4%) from 1990 to 2009 to a peak of 8.2 per 100 adults (95% CI 7.8 to 8.6), and then plateaued through 2017. The incidence of age-adjusted, diagnosed diabetes did not change significantly from 1980 to 1990, but increased significantly (APC 4.8%) from 1990 to 2007 to 7.8 per 1000 adults (95% CI 6.7 to 9.0), and then decreased significantly (APC -3.1%) to 6.0 (95% CI 4.9 to 7.3) in 2017. The decrease in incidence appears to be driven by non-Hispanic whites with an APC of -5.1% (p=0.002) after 2008.
Conclusions: After an almost 20-year increase in the national prevalence and incidence of diagnosed diabetes, an 8-year period of stable prevalence and a decrease in incidence has occurred. Causes of the plateauing and decrease are unclear but the overall burden of diabetes remains high and deserves continued monitoring and intervention.
Keywords: adult diabetes; incidence; public health/surveillance.
Conflict of interest statement
Competing interests: None declared.
Figures
References
-
- Centers for Disease Control and Prevention United States diabetes surveillance system. Available: https://www.cdc.gov/diabetes/data [Accessed 16 Aug 2018].
-
- Centers for Disease Control and Prevention National Health Interview survey: methods. Available: http://www.cdc.gov/nchs/nhis/methods.htm [Accessed 30 Jul 2018].
MeSH terms
Substances
LinkOut - more resources
Full Text Sources
Medical
Miscellaneous