. 2019 Jun 6:7:95.
doi: 10.3389/fcell.2019.00095. eCollection 2019.

Rewiring the Regenerated Zebrafish Retina: Reemergence of Bipolar Neurons and Cone-Bipolar Circuitry Following an Inner Retinal Lesion

Affiliations

Rewiring the Regenerated Zebrafish Retina: Reemergence of Bipolar Neurons and Cone-Bipolar Circuitry Following an Inner Retinal Lesion

Timothy E McGinn et al. Front Cell Dev Biol. .

Abstract

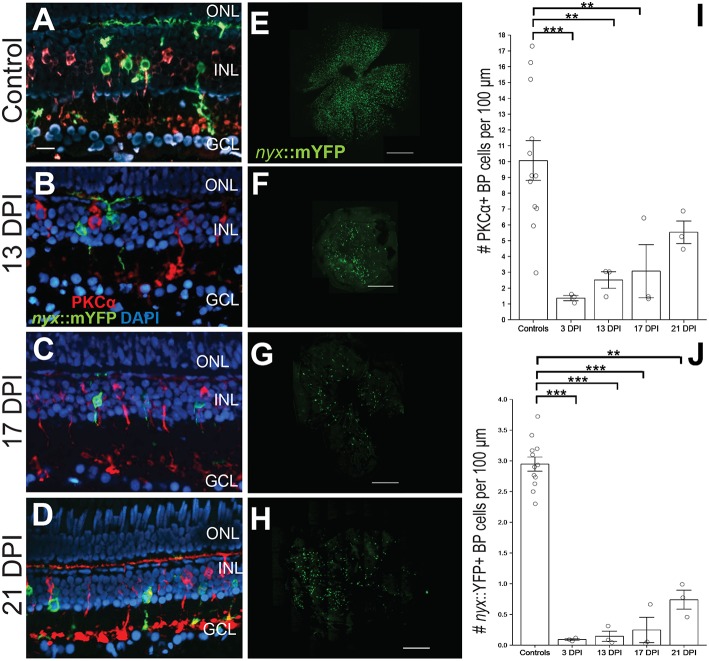
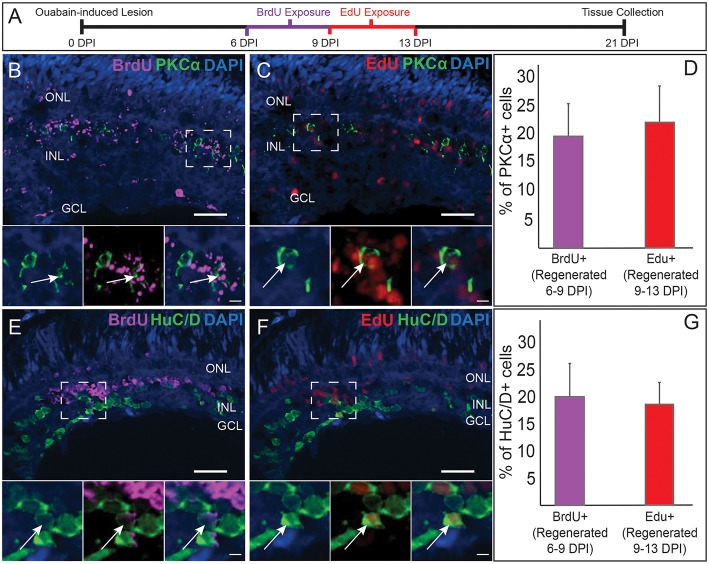
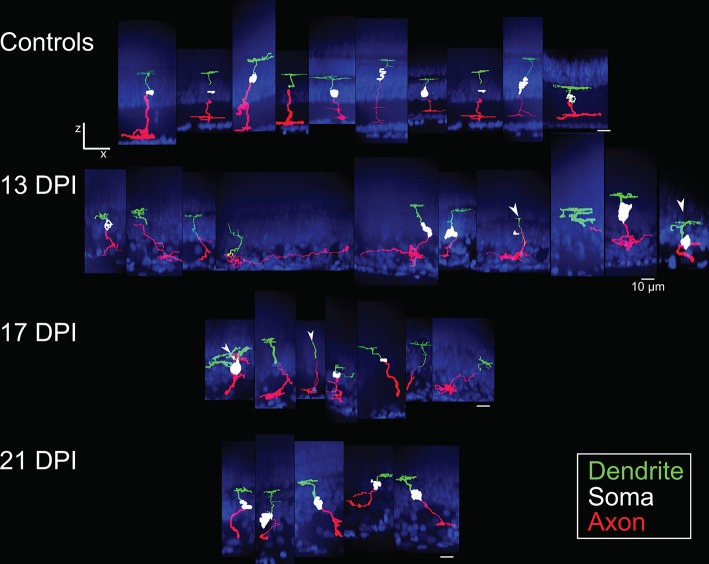
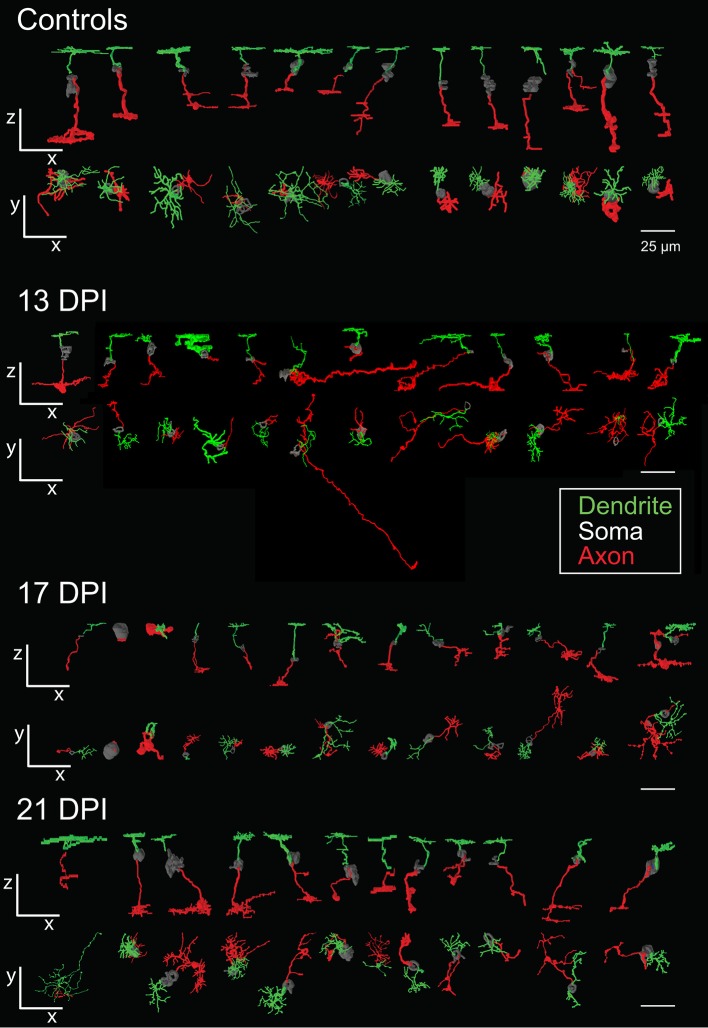
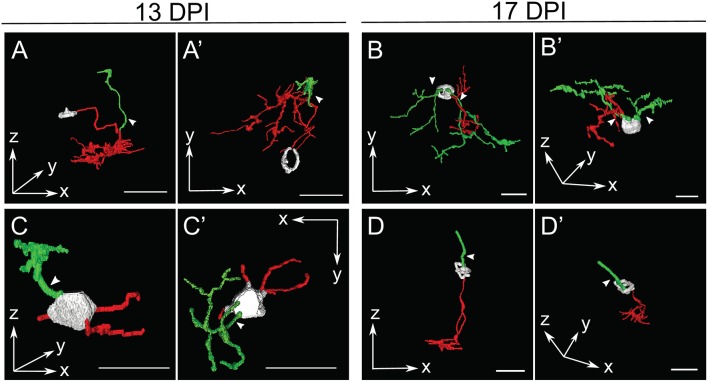
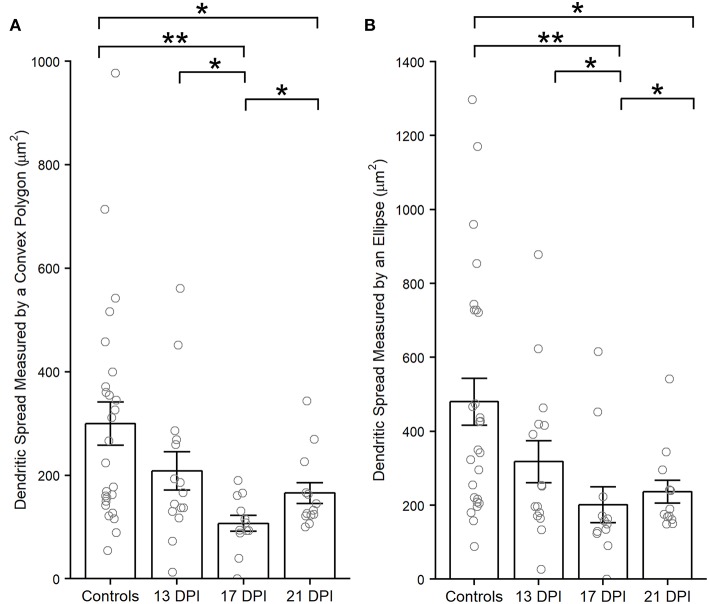
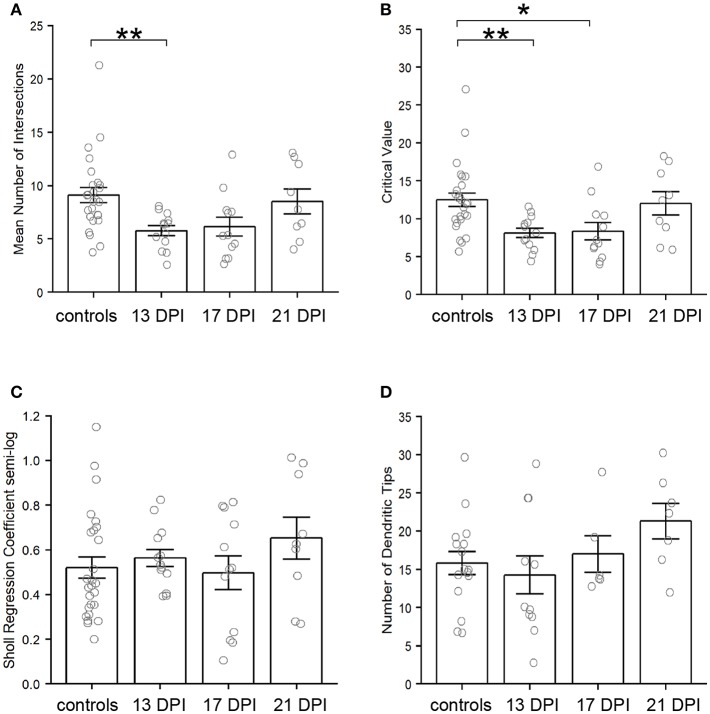
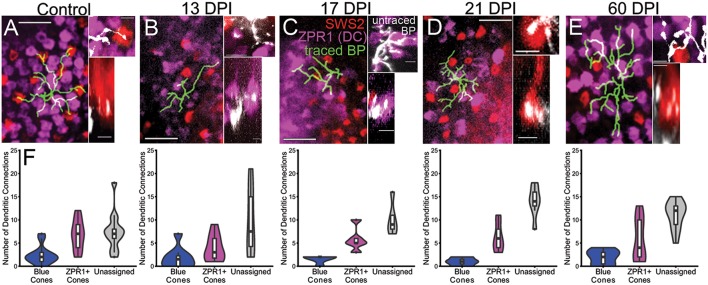
We previously reported strikingly normal morphologies and functional connectivities of regenerated retinal bipolar neurons (BPs) in zebrafish retinas sampled 60 days after a ouabain-mediated lesion of inner retinal neurons (60 DPI) (McGinn et al., 2018). Here we report early steps in the birth of BPs and formation of their dendritic trees and axonal arbors during regeneration. Adult zebrafish were subjected to ouabain-mediated lesion that destroys inner retinal neurons but spares photoreceptors and Müller glia, and were sampled at 13, 17, and 21 DPI, a timeframe over which plexiform layers reemerge. We show that this timeframe corresponds to reemergence of two populations of BPs (PKCα+ and nyx::mYFP+). Sequential BrdU, EdU incorporation reveals that similar fractions of PKCα+ BPs and HuC/D+ amacrine/ganglion cells are regenerated concurrently, suggesting that the sequence of neuronal production during retinal regeneration does not strictly match that observed during embryonic development. Further, accumulation of regenerated BPs appears protracted, at least through 21 DPI. The existence of isolated, nyx::mYFP+ BPs allowed examination of cytological detail through confocal microscopy, image tracing, morphometric analyses, identification of cone synaptic contacts, and rendering/visualization. Apically-projecting neurites (=dendrites) of regenerated BPs sampled at 13, 17, and 21 DPI are either truncated, or display smaller dendritic trees when compared to controls. In cases where BP dendrites reach the outer plexiform layer (OPL), numbers of dendritic tips are similar to those of controls at all sampling times. Further, by 13-17 DPI, BPs with dendritic tips reaching the outer nuclear layer (ONL) show patterns of photoreceptor connections that are statistically indistinguishable from controls, while those sampled at 21 DPI slightly favor contacts with double cone synaptic terminals over those of blue-sensitive cones. These findings suggest that once regenerated BP dendrites reach the OPL, normal photoreceptor connectomes are established, albeit with some plasticity. Through 17 DPI, some basally-projecting neurites (=axons) of regenerated nyx::mYFP+ BPs traverse long distances, branch into inappropriate layers, or appear to abruptly terminate. These findings suggest that, after a tissue-disrupting lesion, regeneration of inner retinal neurons is a dynamic process that includes ongoing genesis of new neurons and changes in BP morphology.

Keywords: birthdating; circuitry; connectome; photoreceptor; regeneration; retina; retinal bipolar cell; zebrafish.


Figures

Figure 1
Figure 1
Emergence of identifiable retinal bipolar (BP) neurons following a chemical lesion selective to the inner retina. (A) PKCα+ and nyx::mYFP+ BP cell bodies occupy the inner nuclear layer (INL), with dendritic trees in the OPL and axon terminals in the inner plexiform layer of control retinas. (B–D) New PKCα+ and nyx::mYFP+ BPs reappear over the time frame of 13 days post-injury (DPI) (B), 17 DPI (C), and 21 DPI (D), and have recognizable apical processes (dendrites) and basal processes (axons). (E–H) Retinal flat mounts of control (E), and regenerated, nyx::mYFP retinas at 13 DPI (F), 17 DPI (G), and 21 DPI (H) showing distributions of regenerated nyx::mYFP+ BP neurons (n = 11) controls, six 13 DPIs, five 17 DPIs, and five 21 DPIs prepared as whole mounts (Supplementary Table 1) and visually inspected for overall distribution of nyx::mYFP BPs. Three controls, two 13 DPIs, three 17 DPIs, and three 21 DPIs were imaged as in (E-H). High resolution images of these retinas are provided in Supplementary Figure 1. (I) Numbers of PKCα+ BPs at 3 (McGinn et al., 2018), 13, and 17 DPI were significantly different from controls (**p < 0.01; ***p < 0.001), while there was no statistically significant difference between controls and 21 DPI (p = 0.246), or for any other post-hoc pairwise analysis (Kruskall-Wallis, Conover's post-hoc analysis; graph shows means ± SEM). (J) Numbers of nyx::mYFP+ BPs remained significantly reduced at 3, 13, 17, and 21 DPI (**p < 0.01; ***p < 0.001), but there was no statistically significant difference for any other post-hoc pairwise analysis (Kruskall-Wallis, Conover's post-hoc analysis; graph shows means ± SEM). Scale bar in A (applies to A–D) = 20 μm. Scale bars in E-H each = 200 μm.
Figure 2
Figure 2
Comparative birthdating of regenerated PKCα+ bipolar (BP) neurons and HuC/D+ amacrine and ganglion cells following a chemical lesion selective to the inner retina. (A) Timeline and experimental design; DPI, days post-injury. (B) Some regenerated PKCα+ (green) BPs incorporated BrdU (magenta) (6–9 DPI). Higher magnification insets of boxed region show PKCα and DAPI, PKCα, and BrdU, and all channels merged. Arrows indicate BrdU+ PKCα+ BP cell. (C) Some regenerated PKCα+ BPs incorporated EdU (red) (9–13 DPI). Higher magnification insets corresponding to boxed region show PKCα and DAPI, PKCα and EdU, and all channels merged. Arrow indicates EdU+ PKCα+ BP cell. (D) Percentage of PKCα+ cells that incorporate BrdU and EdU at the indicated timeframes (means ± s.d.; n = 3). (E) Some regenerated HuC/D+ (green) neurons incorporated BrdU (magenta) (6–9 DPI). Higher magnification insets corresponding to boxed region show HuC/D and DAPI, HuC/D and BrdU, and all channels merged. Arrow indicates BrdU+ HuC/D+ cell. (F) Some regenerated HuC/D+ BPs incorporated EdU (red) (9–13 DPI). Higher magnification insets corresponding to boxed region show HuC/D and DAPI, HuC/D and EdU, and all channels merged. Arrow indicates EdU+ HuC/D+ cell. (G) Percentage of HuC/D+ neurons that incorporate BrdU and EdU at the indicated timeframes (means ± s.d.) are similar to the percentages of PKCα+ BPs that incorporated these labels. Scale bar in B (applies to B,C,E,F) = 50 μm. Scale bar in insets (applies to all insets) = 10 μm.
Figure 3
Figure 3
Galleries of traced nyx::mYFP+ retinal bipolar (BP) neurons. Neurons were traced in Simple Neurite Tracer (SNT), dendrites (green), cell bodies (white), axons (red) were pseudocolored, and then merged with images of the DAPI-stained (blue) nuclei to visualize retinal layers; merged images were then resliced to show the orthogonal views, with preservation of alignment of the traced cells and DAPI stained nuclei. For some BPs the cell body was not traced or only minimally traced due to limitations of SNT. Top row: BPs sampled from control retinas included some that were also shown in McGinn et al. (2018). Second row: BPs sampled at 13 days post-injury (13 DPI) vary in appearance, with some displaying long, wandering axons, and others displaying simple apical processes but no dendritic trees, and others presenting an apparently normal morphology. Third row: BPs sampled at 17 DPI also vary in appearance, with unusual dendritic tree structures or only simple apical processes, and others appearing normal. Bottom row: BPs sampled at 21 DPI show morphologies that more closely resembled those of control retinas. Scale bar = 10 μm.
Figure 4
Figure 4
Galleries of surface rendered nyx::mYFP+ retinal bipolar (BP) neurons. Neurons were traced in Simple Neurite Tracer (SNT), colorized, filled, created into three-dimensional surface models, imported into 3ds Max 2016, and then entered into a single image to display overall similarities and differences of BPs. For some BPs the cell body was not traced or only minimally traced due to limitations of SNT. Each timepoint shows the rendered neurons in the x-z radial “side” views (top row) and the x-y tangential “top-down” views (bottom row) relative to the imaging plane. BPs shown from control retinas included some that were also shown in McGinn et al. (2018). Dendritic tree alignment of the seventh 13 DPI neurons is offset vertically in order to fit all into the display without overlap. Scale bars = 25 μm. DPI, days post-injury.
Figure 5
Figure 5
Selected retinal bipolar (BP) neurons that demonstrate the unusual range of morphologies observed at 13 and 17 days post-injury (DPI). Neurons were traced in Simple Neurite Tracer and then rendered in ImageJ's 3D viewer. (A,A') Neuron showing an apparently displaced soma and multiple neurites, shown from two different orientations (A = radial “side” view, A' = tangential “top-down” view). The cell body was only minimally traced due to limitations of SNT. (B,B') Neuron that has two distinct apparent dendritic trees connected to the same cell body. (C,C',D,D') Neurons with apparently simple morphologies sampled at 13 DPI and 17 DPI, respectively, each shown from two different orientations. In contrast to A and B, these BPs have a bipolar shape, but have smaller dendritic trees with fewer branches than most other neurons sampled at 13 and 17 DPI. The neuron in (C,C') appears to have more than one basal outgrowth (possibly multiple axons), all of them truncated, while the neuron in D has an axon with a normal appearance, but a single apical process rather than a dendritic tree. The cell body in (D,D') was only minimally traced due to limitations of SNT. Arrows designate investigator assignment of primary dendrites (green). Axons, red; incompletely traced cell bodies, grayscale. Scale bar(s) in all panels = 10 μm.
Figure 6
Figure 6
Dendritic spreads measured using the convex polygon method (A) and the ellipse method (B), of regenerated nyx::mYFP+ bipolar (BP) neurons, are reduced at 17 and 21 days post-injury (DPI) compared to controls. Column graphs show the mean of each group, open circles represent each individual, measured dendritic tree, and the error bars show the SEM. *p < 0.05, **p < 0.01 using Wilcoxon–Mann–Whitney tests. Control measurements are those shown in McGinn et al. (2018).
Figure 7
Figure 7
Characteristics of nyx::mYFP+ bipolar (BP) neuron dendritic trees. (A–C) Outputs of Sholl analysis. (A) Average number of intersections is reduced at 13 days post-injury (DPI) but not at 17 and 21 DPI in comparison with controls. B. Sholl critical values are reduced at 13 and 17 DPI but not at 21 DPI in comparison with controls. C. Sholl regression coefficients are not significantly different across samples. (D) Numbers of dendritic tips (presumed photoreceptor connections) are not significantly different across samples. Bar graphs show the mean of each group, open circles represent each individual dendritic tree, and the error bars show the SEM. *p < 0.05, **p < 0.01 using Wilcoxon–Mann–Whitney tests. Control measurements are those shown in McGinn et al. (2018).
Figure 8
Figure 8
Reestablishment of nyx::mYFP+ bipolar (BP) neuron dendritic connections with cone photoreceptor terminals. (A–E) Dendritic fields showing traced nyx::mYFP+ BPs (green) overlayed onto partial projections of blue-sensitive (red color) cone terminals and ZPR1+ (magenta color) red- and green-sensitive double cone terminals, from control (A), 13 days post-injury (DPI) (B), 17 DPI (C), 21 DPI (D), and 60 DPI (E) retinas. Control and 60 DPI images also appear in McGinn et al. (2018). Higher magnification views on right of each panel show untraced BP dendrites (white) forming connections with blue-sensitive (red color) and/or ZPR1+ (magenta color) red- and green-sensitive double cone terminals (Top images are z-projections; bottom images are partial projections from image stacks, showing resliced radial views; control and 60 DPI images also appear in McGinn et al. (2018), but with different pseudocoloring). (F) Distributions of dendritic connections to identified and unassigned photoreceptor subtypes for nyx::mYFP+ BPs in control, 13 DPI, 17 DPI, 21 DPI, and 60 DPI retinas. Shapes of violin plots were obtained by using a kernel density estimator to generate a smoothened histogram, mirrored along the x-axis, and then rotated. The width of each plot is determined by the proportion of bipolar cells making a given number of connections to that photoreceptor subtype at that point. In the boxplots within, the horizontal line inside each box represents the median, the top and bottom of the box represent the 25th and 75th percentiles, the whiskers represent the 1.5 interquartile range, and the filled circles represent outliers. Control vs. 13 DPI p = 0.3844, control vs. 17 DPI p = 0.2758, control vs. 21 DPI p = 0.031, control vs. 60 DPI p = 0.4534 (Generalized linear model). Scale bars in (A–E) = 10 μm for left panels, and 2.5 μm for right panels.
Figure 9
Figure 9
Characteristics of nyx::mYFP+ bipolar (BP) neuron axonal arbors, using outputs of Sholl analysis. Average number of intersections (A), Sholl critical values (B), and Sholl regression coefficients (C) are not significantly different across samples. Column graphs show the mean of each group, open circles represent each individual dendritic tree, and the error bars show the SEM. Wilcoxon-Mann-Whitney tests did not reveal any significant differences for any of these measures. Controls are those shown in McGinn et al. (2018). DPI, days post-injury.

Similar articles

Cited by

References

    1. Ahmad I., Del Debbio C. B., Das A. V., Parameswaran S. (2011). Muller glia: a promising target for therapeutic regeneration. Invest. Ophthalmol. Vis. Sci. 52, 5758–5764. 10.1167/iovs.11-7308 - DOI - PubMed
    1. Ail D., Perron M. (2017). Retinal degeneration and regeneration-lessons from fishes and amphibians. Curr. Pathobiol. Rep. 5, 67–78. 10.1007/s40139-017-0127-9 - DOI - PMC - PubMed
    1. Allison W. T., Barthel L. K., Skebo K. M., Takechi M., Kawamura S., Raymond P. A. (2010). Ontogeny of cone photoreceptor mosaics in zebrafish. J. Comp. Neurol. 518, 4182–4195. 10.1002/cne.22447 - DOI - PMC - PubMed
    1. Angueyra J. M., Kindt K.S. (2018). Leveraging zebrafish to study retinal degenerations. Front. Cell Dev. Biol. 6:110. 10.3389/fcell.2018.00110 - DOI - PMC - PubMed
    1. Arroba A. I., Campos-Caro A., Aguilar-Diosdado M., Valverde A. M. (2018). IGF-1, Inflammation and retinal degeneration. A close network. Front. Aging Neurosci. 10:203. 10.3389/fnagi.2018.00203 - DOI - PMC - PubMed

LinkOut - more resources