

β2-Microglobulin is an appropriate reference gene for RT-PCR-based gene expression analysis of hematopoietic stem cells
- PMID: 31245448
- PMCID: PMC6581808
- DOI: 10.1016/j.reth.2015.04.003
β2-Microglobulin is an appropriate reference gene for RT-PCR-based gene expression analysis of hematopoietic stem cells
Abstract
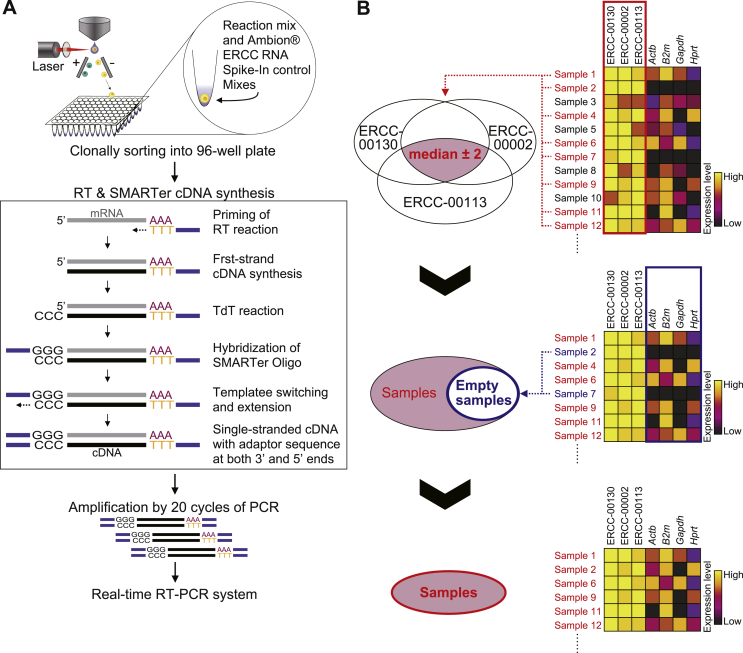
Real-time reverse transcription polymerase chain reaction (RT-PCR) is regarded as one of the most useful and powerful tools for characterizing hematopoietic stem cells (HSCs), because samples of extremely small cell numbers can be analyzed. The expression levels determined by RT-PCR are based on relative quantification; therefore, the selection of an appropriate reference gene with a relatively stable expression level under most conditions is crucial. Here, we determined that beta2-microglobulin (B2m) is an appropriate reference gene for analyzing mouse HSCs by a novel method using single-cell RT-PCR. Clonally sorted HSCs were subjected to RT reactions with exogenous RNA fragments and then to real-time PCR. Next, the relative gene expression levels of 4 well-known housekeeping genes were quantified in each single cell sample based on the threshold cycle of exogenous RNA. The analysis revealed that B2m expression was reproducibly detected in almost all HSCs and that B2m had the most stable expression level among the compared genes, even after the cells had been cultured under various conditions. Thus, our results indicate that B2m can reliably be used as a reference gene for the relative quantification of expression levels in HSCs across various conditions. Furthermore, our work proposes a novel method for the selection of appropriate reference genes.
Keywords: Actb, beta-actin; B2m, beta2-microglobulin; Beta2-microglobulin; Ct, threshold cycles; ERCC, External RNA Controls Consortium; Gapdh, glyceraldehyde-3-phosphate dehydrogenase; HKGs, housekeeping genes; HSCs, hematopoietic stem cells; Hematopoietic stem cells; Hprt, hypoxanthine phosphoribosyl transferase; MHC, major histocompatibility complex; MPPs, multi-potential progenitors; RT-PCR, reverse-transcription polymerase chain reaction; Reference gene; SCF, stem cell factor; Single-cell RT-PCR; TPO, Thrombopoietin.
Figures


Similar articles
-
Determination of internal controls for quantitative real time RT-PCR analysis of the effect of Edwardsiella tarda infection on gene expression in turbot (Scophthalmus maximus).Fish Shellfish Immunol. 2011 Feb;30(2):720-8. doi: 10.1016/j.fsi.2010.12.028. Epub 2011 Jan 8. Fish Shellfish Immunol. 2011. PMID: 21220029
-
Determination of stable reference genes for RT-qPCR expression data in mechanistic pain studies on pig dorsal root ganglia and spinal cord.Res Vet Sci. 2017 Oct;114:493-501. doi: 10.1016/j.rvsc.2017.09.025. Epub 2017 Sep 28. Res Vet Sci. 2017. PMID: 28987956 Free PMC article.
-
GAPDH, β-actin and β2-microglobulin, as three common reference genes, are not reliable for gene expression studies in equine adipose- and marrow-derived mesenchymal stem cells.J Anim Sci Technol. 2015 May 7;57:18. doi: 10.1186/s40781-015-0050-8. eCollection 2015. J Anim Sci Technol. 2015. PMID: 26290738 Free PMC article.
-
Influence of Age on Cerebral Housekeeping Gene Expression for Normalization of Quantitative Polymerase Chain Reaction after Acute Brain Injury in Mice.J Neurotrauma. 2015 Nov 15;32(22):1777-88. doi: 10.1089/neu.2014.3784. Epub 2015 Sep 18. J Neurotrauma. 2015. PMID: 26102571
-
Identification of valid reference housekeeping genes for gene expression analysis in tumor neovascularization studies.Clin Transl Oncol. 2013 Mar;15(3):211-8. doi: 10.1007/s12094-012-0904-1. Epub 2012 Jul 25. Clin Transl Oncol. 2013. PMID: 22855186
Cited by
-
Suitable reference gene for quantitative real-time PCR analysis of gene expression in gonadal tissues of minnow Puntius sophore under high-temperature stress.BMC Genomics. 2017 Aug 15;18(1):617. doi: 10.1186/s12864-017-3974-1. BMC Genomics. 2017. PMID: 28810828 Free PMC article.
-
Leveraging the predictive power of a 3D in vitro vascularization screening assay for hydrogel-based tissue-engineered periosteum allograft healing.Biomater Adv. 2025 Apr;169:214187. doi: 10.1016/j.bioadv.2025.214187. Epub 2025 Jan 15. Biomater Adv. 2025. PMID: 39827700
-
Stimulating Mitochondrial Biogenesis with Deoxyribonucleosides Increases Functional Capacity in ECHS1-Deficient Cells.Int J Mol Sci. 2022 Oct 20;23(20):12610. doi: 10.3390/ijms232012610. Int J Mol Sci. 2022. PMID: 36293464 Free PMC article.
-
Single-Cell RNA Sequencing of Human Pluripotent Stem Cell-Derived Macrophages for Quality Control of The Cell Therapy Product.Front Genet. 2022 Jan 31;12:658862. doi: 10.3389/fgene.2021.658862. eCollection 2021. Front Genet. 2022. PMID: 35173760 Free PMC article.
-
Matrix metalloproteinase (MMP)-degradable tissue engineered periosteum coordinates allograft healing via early stage recruitment and support of host neurovasculature.Biomaterials. 2021 Jan;268:120535. doi: 10.1016/j.biomaterials.2020.120535. Epub 2020 Nov 19. Biomaterials. 2021. PMID: 33271450 Free PMC article.
References
-
- Arai F., Hirao A., Ohmura M., Sato H., Matsuoka S., Takubo K. Tie2/angiopoietin-1 signaling regulates hematopoietic stem cell quiescence in the bone marrow niche. Cell. 2004;118:149–161. - PubMed
-
- Yoshihara H., Arai F., Hosokawa K., Hagiwara T., Takubo K., Nakamura Y. Thrombopoietin/MPL signaling regulates hematopoietic stem cell quiescence and interaction with the osteoblastic niche. Cell Stem Cell. 2007;1:685–697. - PubMed
LinkOut - more resources
Full Text Sources
Other Literature Sources
Research Materials
Miscellaneous
