. 2019 Jan 31;3(1):e00115.
doi: 10.1002/pld3.115. eCollection 2019 Jan.

Comparison of alfalfa plants overexpressing glutamine synthetase with those overexpressing sucrose phosphate synthase demonstrates a signaling mechanism integrating carbon and nitrogen metabolism between the leaves and nodules

Affiliations

Comparison of alfalfa plants overexpressing glutamine synthetase with those overexpressing sucrose phosphate synthase demonstrates a signaling mechanism integrating carbon and nitrogen metabolism between the leaves and nodules

Harmanpreet Kaur et al. Plant Direct. .

Abstract

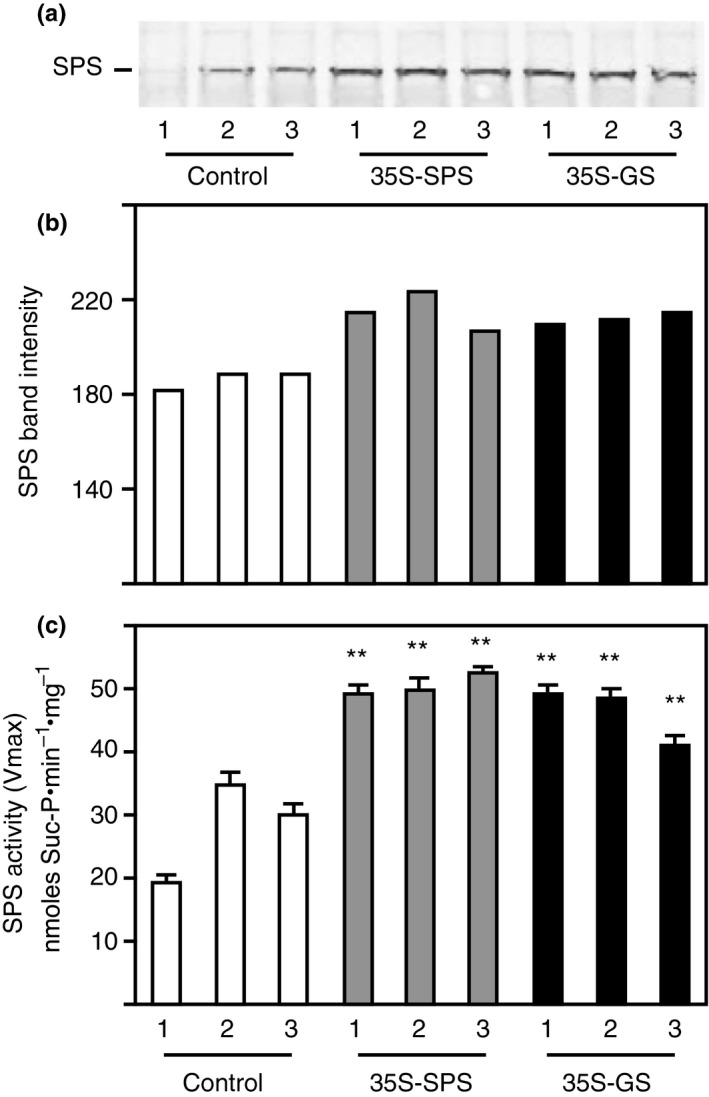
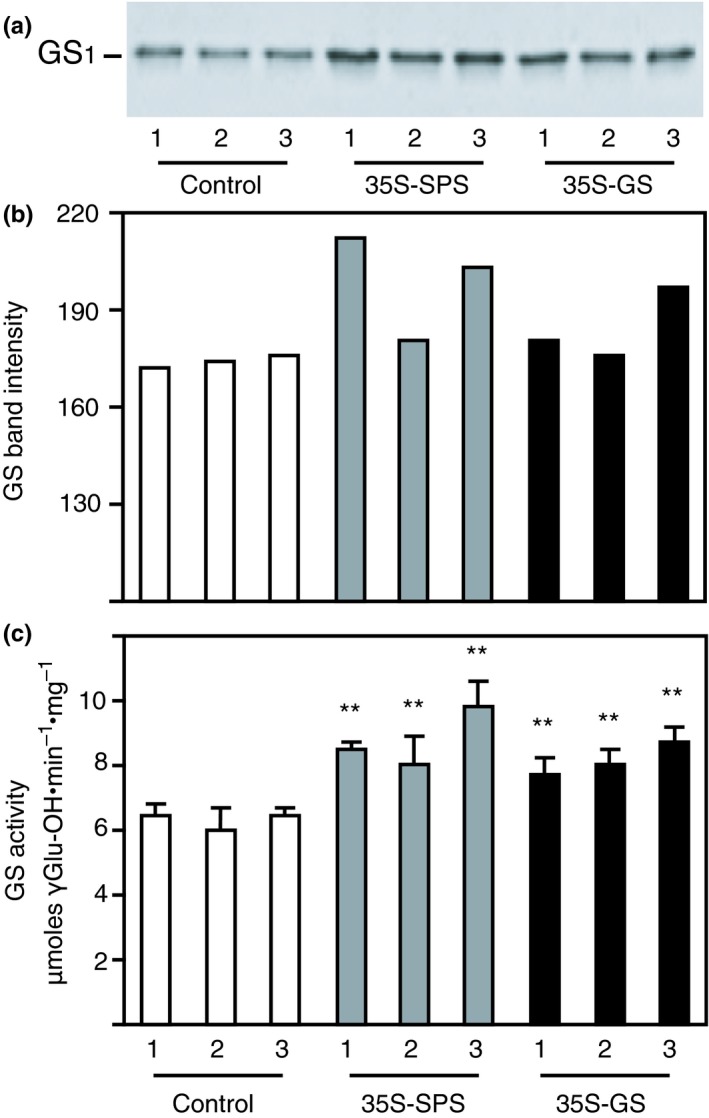
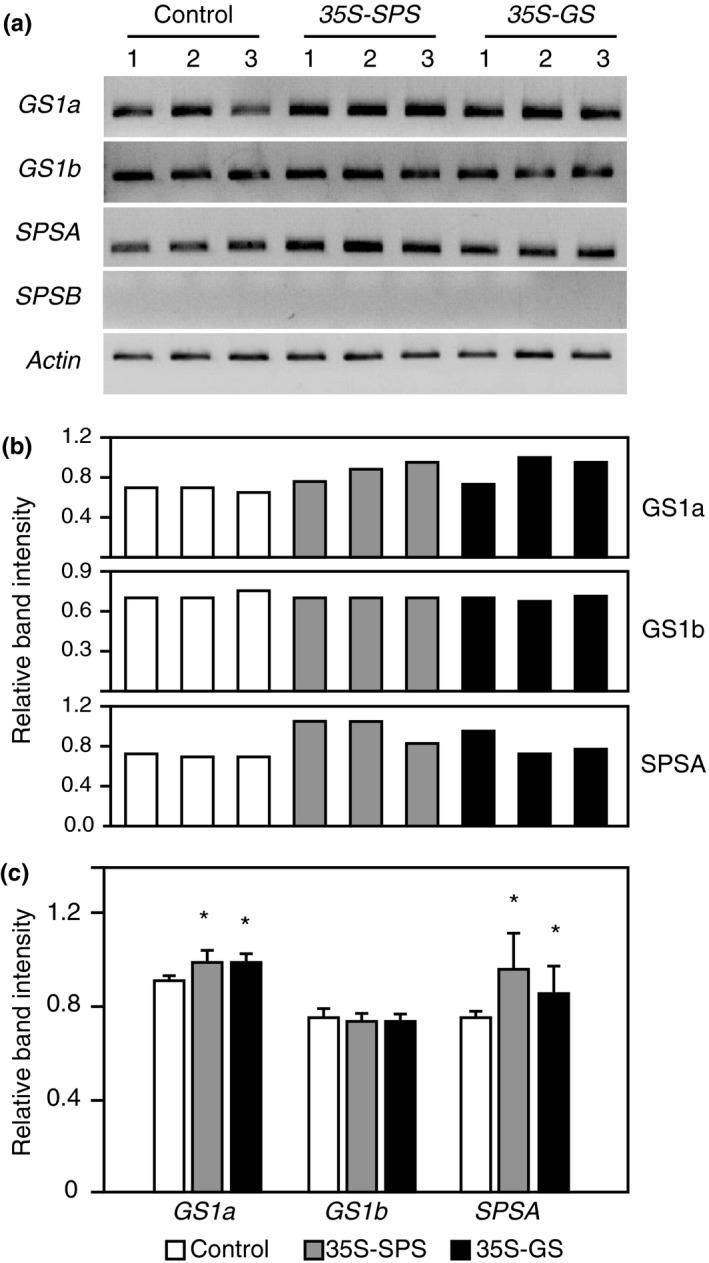
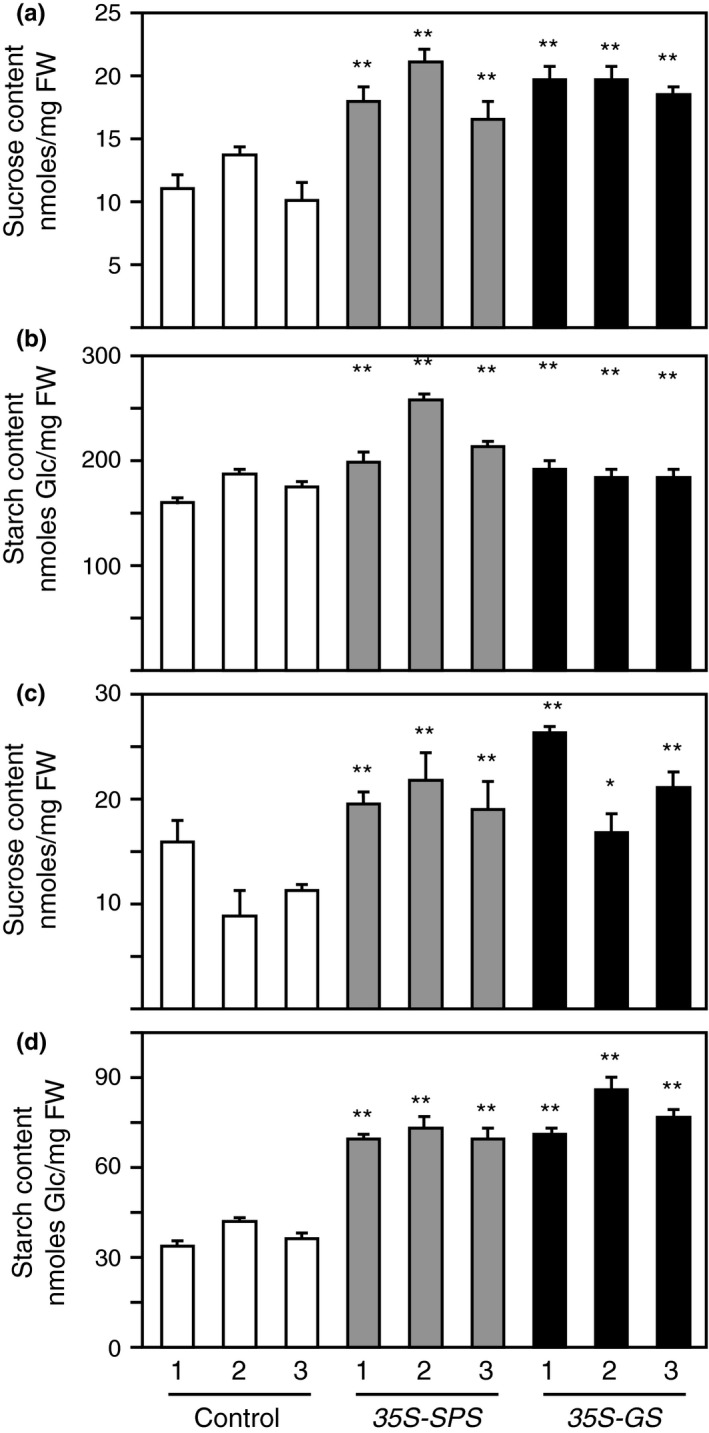
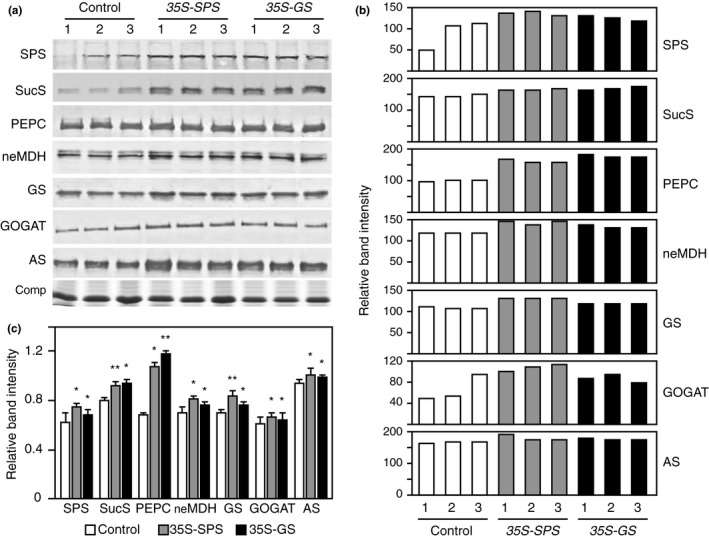
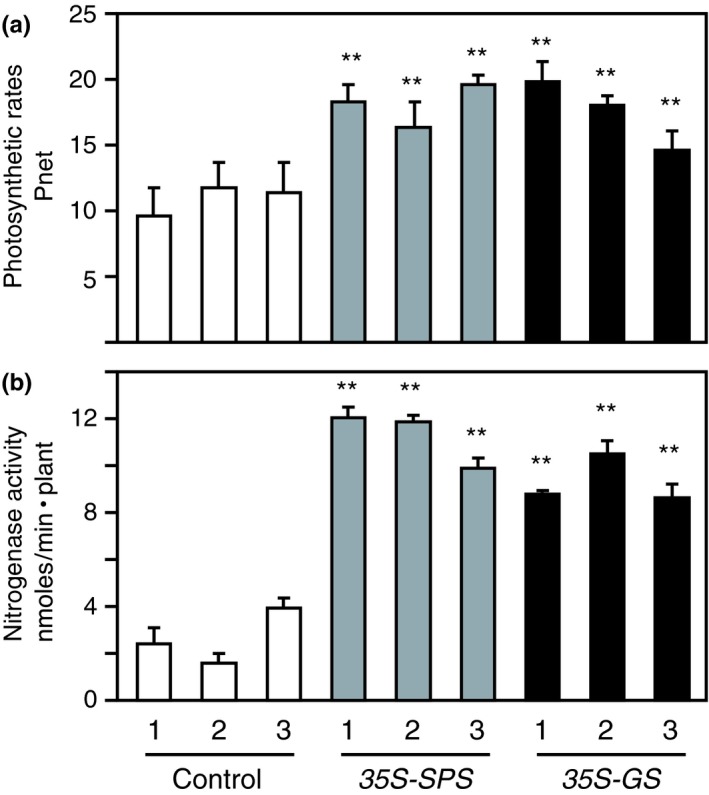
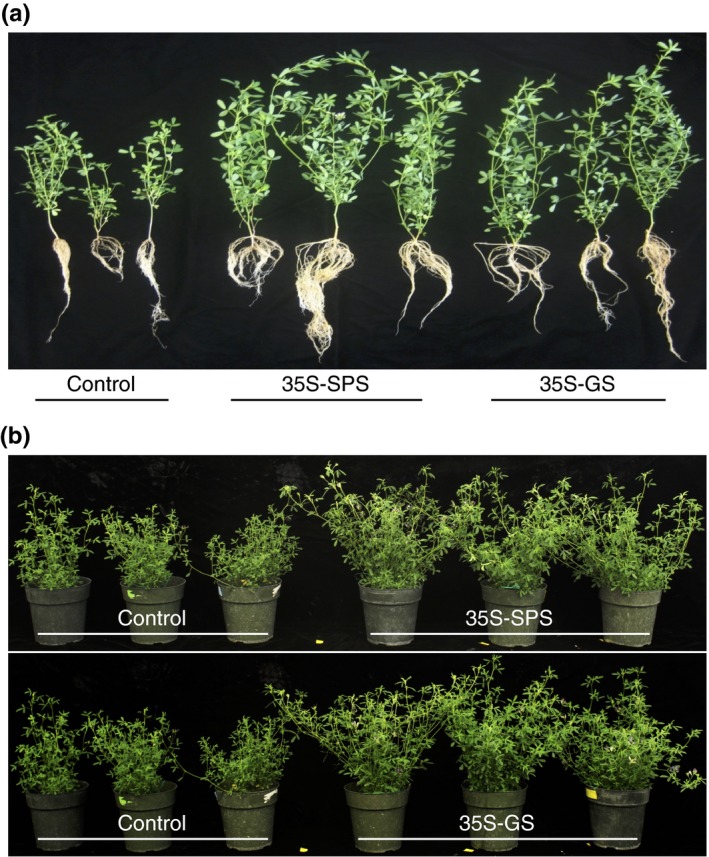
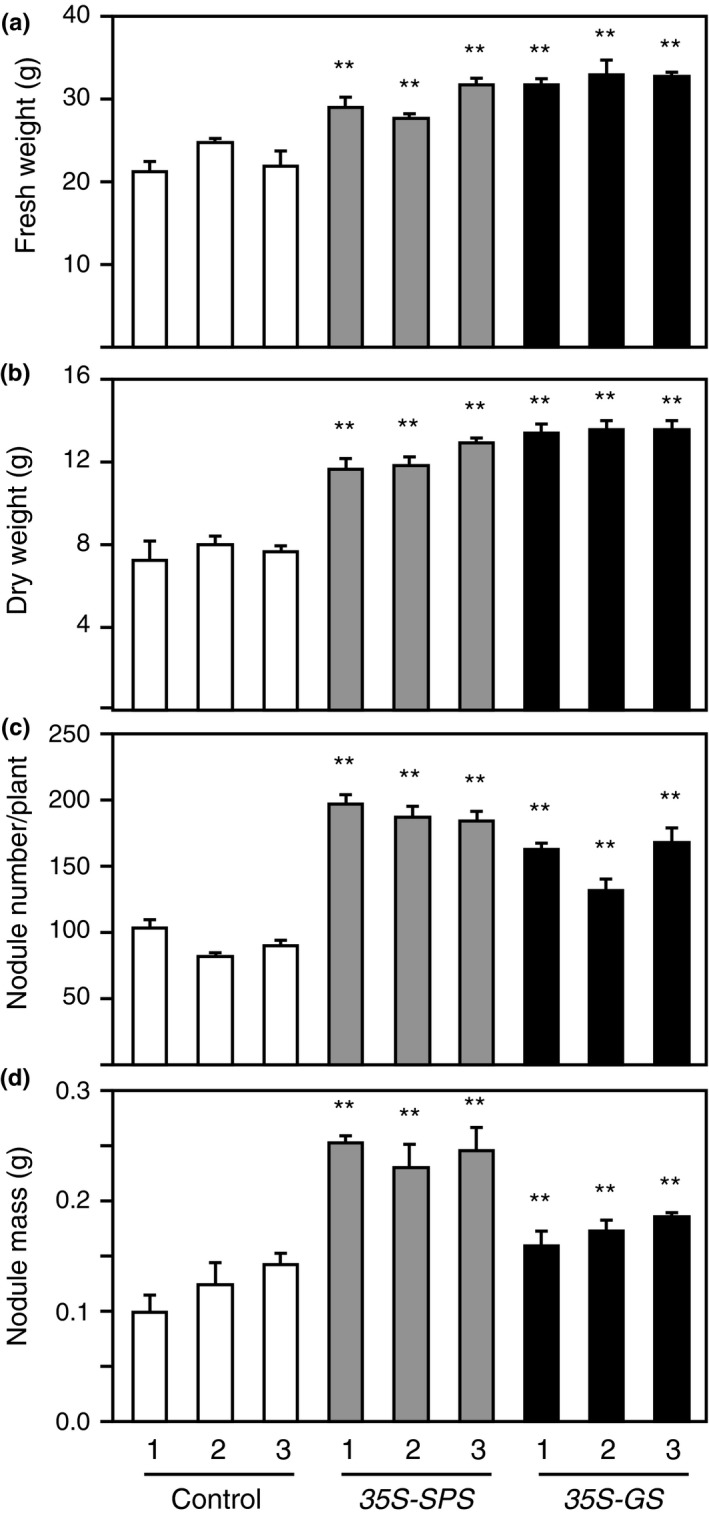
Alfalfa, like other legumes, establishes a symbiotic relationship with the soil bacteria, Sinorhizobium meliloti, which results in the formation of the root nodules. Nodules contain the bacteria enclosed in a membrane-bound vesicle, the symbiosome where it fixes atmospheric N2 and converts it into ammonia using the bacterial enzyme, nitrogenase. The ammonia released into the cytoplasm from the symbiosome is assimilated into glutamine (Gln) using carbon skeletons produced by the metabolism of sucrose (Suc), which is imported into the nodules from the leaves. The key enzyme involved in the synthesis of Suc in the leaves is sucrose phosphate synthase (SPS) and glutamine synthetase (GS) is the enzyme with a role in ammonia assimilation in the root nodules. Alfalfa plants, overexpressing SPS or GS, or both showed increased growth and an increase in nodule function. The endogenous genes for the key enzymes in C/N metabolism showed increased expression in the nodules of both sets of transformants. Furthermore, the endogenous SPS and GS genes were also induced in the leaves and nodules of the transformants, irrespective of the transgene, suggesting that the two classes of plants share a common signaling pathway regulating C/N metabolism in the nodules. This study reaffirms the utility of the nodulated legume plant to study C/N interaction and the cross talk between the source and sink for C and N.

Keywords: SPS and GS activity; forage quality; malate dehydrogenase; nitrogenase activity; phosphoenolpyruvate carboxylase; sucrose synthase.


Conflict of interest statement

The authors declare no conflict of interest associated with the work described in this manuscript.

Figures

Figure 1
Figure 1
Analysis of the three classes of transformants: control (Cambia 2300), 35S‐SPS, and 35S‐GS plants for the integration and functionality of the gene constructs. (a) DNA isolated from three independent transformants for each class was isolated and subjected to genomic PCR using a NPTII specific primer set. The products were then fractionated on agarose gels. (b) RNA isolated from the leaves of the same plants used in panel A were subjected to RTPCR using primer sets specific for the SPS transgene, the GS transgene, and Actin and the products were electrophoresed. (c) RNA isolated from the nodules of the same set of plants used in panels A and B were subjected to RTPCR using primer sets specific for SPS transgene, GS transgene, and Actin and the products were subjected to electrophoresis
Figure 2
Figure 2
Analysis of SPS protein and SPS enzyme activity in the leaves of control, 35S‐SPS, and 35S‐GS transformants. (a) A quantity of 70 μg of total protein extracted from the leaves of three clonally propagated plants for each independent transformant was subjected to SDSPAGE (7.5% acrylamide) followed by western blot analysis using SPS antibodies. A representative blot is shown here. The size of the immunoreactive band was determined based on the migration of proteins of known molecular weight. (b) The immunoreactive bands from the western blot were quantified using the KODAK image analysis software and plotted as band intensity. (c) The same leaf extracts used for western blot analysis were used for enzyme activity measurement by quantifying the synthesis of Suc‐6P from UDP‐Glc and Fru‐6P. SPS enzyme activity values are plotted as nmol Sucrose‐P mg−1 protein min−1. Values are the means ± SD of samples from three different replicates for each independent transformant. Significant differences from the average value obtained for the control plants were evaluated by ANOVA contrast test and shown by asterisks (*< 0.05 or **<0.01)
Figure 3
Figure 3
Analysis of GS protein and GS enzyme activity in the leaves of control, 35S‐SPS, and 35S‐GS transformants. (a) A quantity of 10 μg of total protein extracted from the leaves of three clonally propagated plants for each independent transformant was subjected to SDSPAGE (10% acrylamide) followed by western blot analysis using GS antibodies. A representative blot is shown here. The size of the immunoreactive band was determined based on the migration of proteins of known molecular weight. (b) The immunoreactive bands from the western blot were quantified using the KODAK image analysis software and plotted as band intensity. (c) GS transferase activity was measured in the leaf extracts used for GS western blot analysis and GS activity values were plotted as μmol γ‐glutamyl hydroxamate produced per minute per mg of protein at 30°C. Values are the means ± SD of samples from three different replicates for each independent transformant. Significant differences from the average value obtained for the control plants were evaluated by ANOVA contrast test and shown by asterisks (*< 0.05 or **<0.01)
Figure 4
Figure 4
Analysis of transcript accumulation for the endogenous SPS genes in the leaves of control, 35S‐SPS, and 35S‐GS transformants. (a) A quantity of 2 μg of total RNA isolated from the leaves of the same set of plants used for protein analysis was subjected to semiquantitive RTPCR using primer sets specific for SPSA,SPSB, and Actin (internal control for RNA concentration). Following amplification, the products were subjected to electrophoresis. Data from a representative experiment is shown here. (b) The band intensities were measured using the KODAK image software. The ratio of the band intensity obtained for SPSA and SPSB genes relative to the band intensity obtained with the Actin primer set was calculated for each transformant. The values obtained for the three independent transformants representing the 35S‐SPS and 35S‐GS classes were then compared with the average value obtained for the three control plants and plotted as bar graphs. Significant differences from the control plants were evaluated by ANOVA contrast test and shown by asterisks (*< 0.05 or **<0.01)
Figure 5
Figure 5
Analysis of SPS protein and SPS enzyme activity in the nodules of control, 35S‐SPS and 35S‐GS transformants. (a) A quantity of 50 μg of total protein extracted from the nodules of three clonally propagated plants for each independent transformant was subjected to SDSPAGE (7.5% acrylamide) followed by western blot analysis using SPS antibodies. A representative blot is shown here. The size of the immunoreactive band was determined based on the migration of proteins of known molecular weight. (b) The immunoreactive bands from the western blot were quantified using the KODAK image analysis software and plotted as band intensity. (c) The same nodule extracts used for western blot analysis were used for enzyme activity measurement by quantifying the synthesis of Suc‐6P from UDP‐Glc and Fru‐6P. SPS enzyme activity values are plotted as nmol Suc‐P mg−1 protein min−1. Values are the means ± SD of samples from three different replicates for each independent transformant. Significant differences from the average value obtained for the control plants were evaluated by ANOVA contrast test and shown by asterisks (*< 0.05 or **<0.01)
Figure 6
Figure 6
Analysis of GS protein and GS enzyme activity in the nodules of control, 35S‐SPS, and 35S‐GS transformants. (a) A quantity of 1 μg of total protein extracted from the leaves of three clonally propagated plants for each independent transformant was subjected to SDSPAGE (10% acrylamide) followed by western blot analysis using GS antibodies. A representative blot is shown here. The size of the immunoreactive band was determined based on the migration of proteins of known molecular weight. (b) The immunoreactive bands from the western blot were quantified using the KODAK image analysis software and plotted as band intensity. (c) GS transferase activity was measured in the nodule extracts used for GS western blot analysis and GS activity values were plotted as μmol γ‐glutamyl hydroxamate produced per minute per mg of protein at 30°C. Values are the means ± SD of samples from three different replicates for each independent transformant. Significant differences from the average value obtained for the control plants were evaluated by ANOVA contrast test and shown by asterisks (*< 0.05 or **<0.01)
Figure 7
Figure 7
Analysis of transcript accumulation for the endogenous SPS genes in the nodules of Control, 35S‐SPS, and 35S‐GS transformants. (a) A quantity of 2 μg of total RNA isolated from the nodules of the same set of plants used for protein analysis was subjected to semiquantitive RTPCR using primer sets specific for GS1a,GS1b,SPSA,SPSB, and Actin (internal control for RNA concentration). Following amplification, the products were subjected to electrophoresis. Data from a representative experiment are shown here. (b) The band intensities were measured using the KODAK image software. (c) The ratio of the band intensity obtained for GS1a,GS1b,SPSA,SPSB genes relative to the band intensity obtained with the Actin primer set was calculated for each transformant. The values obtained for the three independent transformants representing the 35S‐SPS and 35S‐GS classes were then compared with the average value obtained for the three control plants and plotted as bar graphs. Significant differences from the control plants were evaluated by ANOVA contrast test and shown by asterisks (*< 0.05 or **<0.01)
Figure 8
Figure 8
Sucrose and starch content in the leaves and nodules of control, 35S‐SPS, and 35S‐GS transformants. Sucrose and starch content were measured in the leaves (a, b) and nodules (c, d) as described in Section 2. Sucrose content was plotted as nmoles Suc mg−1 fresh weight (fwt) and starch content was plotted as nmoles Gluc mg−1 fresh weight (fwt). Values for three replicates for each of the three independent transformants representing each class were measured, and the mean value ± SD was calculated for each transformant. Significant differences between the 35S‐SPS and 35S‐GS transformants from the average value obtained from the three control plants were evaluated by ANOVA contrast test and shown by asterisks (*< 0.05 or **<0.01)
Figure 9
Figure 9
Examination of the steady‐state levels of key enzymes in C and N metabolic pathways in the nodules of control, 35S‐SPS, and 35S‐GS transformants. (a) Protein extracts from the nodules were subjected to SDSPAGE followed by western blot analysis using the different antibodies (as indicated). A Coomassie blue stained (Comp) region of the protein gel is shown here as a reference for protein loads. The MW in kD indicated for each panel were based on the migration of known molecular weight markers. (b) The immunoreactive bands were quantified using the KODAK image analysis software, and the band intensity was normalized to the Coomassie stained endogenous protein band (Comp). The normalized band intensity was the plotted for each individual transformant representing the three classes. (c) The average of the values obtained for the three independent transformants representing the 35S‐SPS and 35S‐GS classes were then compared with the average value obtained for the three control plants and plotted as bar graphs. The values are the means ± SE of samples from three different independent transformants (Panel A) (n = 3) for each class of transformants. Significant differences from the control plants were evaluated by ANOVA contrast test and shown by asterisks (*< 0.05 or **<0.01)
Figure 10
Figure 10
Analysis of (a) photosynthetic rates in the leaves and (b) nitrogenase activity in the nodules of control, 35S‐SPS and 35S‐GS transformants. (a) Clonally propagated plants were inoculated with Sinorhizobium meliloti and 30 days post‐inoculation, the photosynthetic rates were measured in mature trifoliate leaves from three replicates for each independent transformant. Photosynthetic rates (P net), measured as mmole CO 2 m−2 s−1, were determined using a conifer chamber attached to a Li‐Cor 6400 photosynthesis system. Values for three different replicates for each independent transformants were calculated as mean value ± SD. Significant differences between each independent transformant belonging to the 35S‐SPS and 35S‐GS classes, and the average value obtained for the three control plants were evaluated by ANOVA contrast test and shown by asterisks (*< 0.05 or **<0.01). (b) Established cuttings were inoculated with S. meliloti and allowed to grow for a period of 30 days. The plants were then uprooted, and the roots of the plants were placed individually in mason jars and nitrogenase activity was measured as nmol ethylene per plant using the acetylene reduction assay as described in Section 2. Values for three to five different replicates for each independent transformants representing each class were measured, and the mean value ± SD was calculated for each individual transformant. Significant differences between the 35S‐SPS and 35S‐GS transformants from the average value obtained for the control plants were evaluated by ANOVA contrast test and shown by asterisks (*< 0.05 or **<0.01)
Figure 11
Figure 11
Visualization of growth in the control, 35S‐SPS, and 35S‐GS transformants at different stages. (a) Established transformants were used to obtain shoots for propagation. The cut shoots were planted on vermiculite and once established (~10 days) after the start day, the cuttings were inoculated with Sinorhizobium meliloti, and allowed to grow for a period of 30 days. The plants were uprooted and visualized. A plant representing each of the three independent transformant for each class were photographed. (b) Clonal replicates (2 per pot) were used for each individual transformant for each of the three classes of plants. The plants were grown till the onset of flowering and then cut down to the base. This process was repeated, and then, the plants were grown till the onset of flowering in the 35S‐SPS and 35S‐GS transformants, at which time they were photographed. The plants were arranged as: control and 35S‐SPS (top panel), and control and 35S‐GS transformants (bottom panel)
Figure 12
Figure 12
Analysis of fresh weight and dry weight of shoots and nodule number and mass of control, 35S‐SPS, and 35S‐GS transformants. (a, b) The plants from Figure 11, after being photographed, were cut down and allowed to grow back to just before the onset of flowering and were then cut at the base and weighed for fresh weight. For dry weight, the tissue was kept in paper bags for 2 weeks and then weighed. The control plants were cut ~2 weeks later since they flowered late compared to the other two classes of transformants. Values in grams for three different replicates for each independent transformants representing each class were measured, and the mean value ± SD was calculated for each individual transformant. Significant differences between the 35S‐SPS and 35S‐GS transformants from the average value obtained for the control plants were evaluated by ANOVA contrast test and shown by asterisks (*< 0.05 or **<0.01). (c, d) Established cuttings were inoculated with Sinorhizobium meliloti and allowed to grow for a period of 30 days. The plants were uprooted and the nodules were harvested. The nodules per plant were counted and weighed. Values in numbers/grams for three different replicates for each independent transformant representing each class were measured, and the mean value ± SD was calculated for each individual transformant. Significant differences between the 35S‐SPS and 35S‐GS transformants from the average value obtained for the control plants were evaluated by ANOVA contrast test and shown by asterisks (*< 0.05 or **<0.01)

Similar articles

Cited by

References

    1. Abadie, C. , Lothier, J. , Boex‐Fontvieille, E. , Carroll, A. , & Tcherkez, G. (2017). Direct assessment of the metabolic origin of carbon atoms in glutamate from illuminated leaves using 13C‐NMR. New Phytologist, 216, 1079–1089. 10.1111/nph.14719 - DOI - PubMed
    1. Aleman, L. , Ortega, J. L. , Martinez‐Grimes, M. , Seger, M. , Holguin, F. O. , Uribe, D. J. , & Sengupta‐Gopalan, C. (2010). Nodule‐enhanced expression of a sucrose phosphate synthase gene member (MsSPSA) has a role in carbon and nitrogen metabolism in the nodules of alfalfa (Medicago sativa L.). Planta, 231, 233–244. 10.1007/s00425-009-1043-y - DOI - PMC - PubMed
    1. Amiour, N. , Imbaud, S. , Clément, G. , Agier, N. , Zivy, M. , Valot, B. , & Tercet‐Laforgue, T. (2012). The use of metabolomics integrated with transcriptomic and proteomic studies for identifying key steps involved in the control of nitrogen metabolism in crops such as maize. Journal of Experimental Botany, 63, 5017–5033. 10.1093/jxb/ers186 - DOI - PubMed
    1. Anderson, G. H. , & Hanson, M. R. (2005). The Arabidopsis Mei2 homologue AML1 binds AtRaptor1B, the plant homologue of a major regulator of eukaryotic cell growth. BMC Plant Biology, 5, 2 10.1186/1471-2229-5-2 - DOI - PMC - PubMed
    1. Araújo, W. L. , Martins, A. O. , Fernie, A. R. , & Tohge, T. (2014). 2‐Oxoglutarate: Linking TCA cycle function with amino acid, glucosinolate, flavonoid, alkaloid, and gibberellin biosynthesis. Frontiers in Plant Science, 5, 552. - PMC - PubMed