. 2019 Mar 14;3(3):e00122.
doi: 10.1002/pld3.122. eCollection 2019 Mar.

Metabolomics of sorghum roots during nitrogen stress reveals compromised metabolic capacity for salicylic acid biosynthesis

Affiliations

Metabolomics of sorghum roots during nitrogen stress reveals compromised metabolic capacity for salicylic acid biosynthesis

Amy M Sheflin et al. Plant Direct. .

Abstract

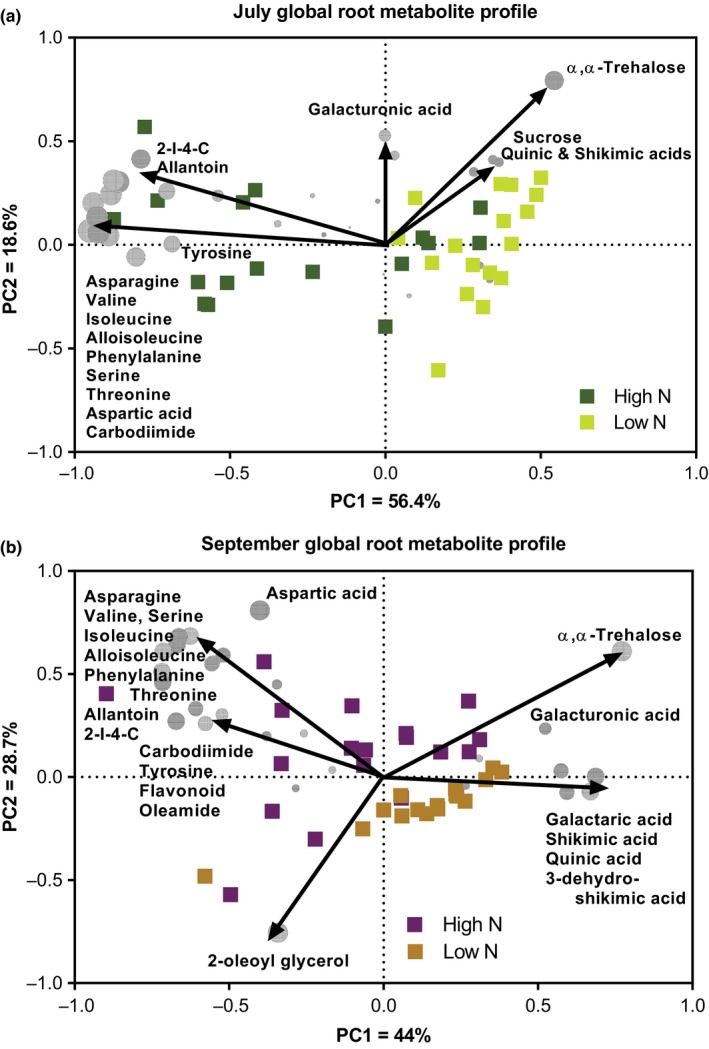
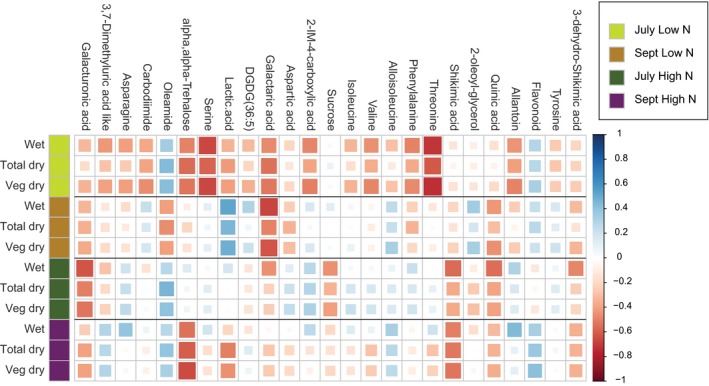
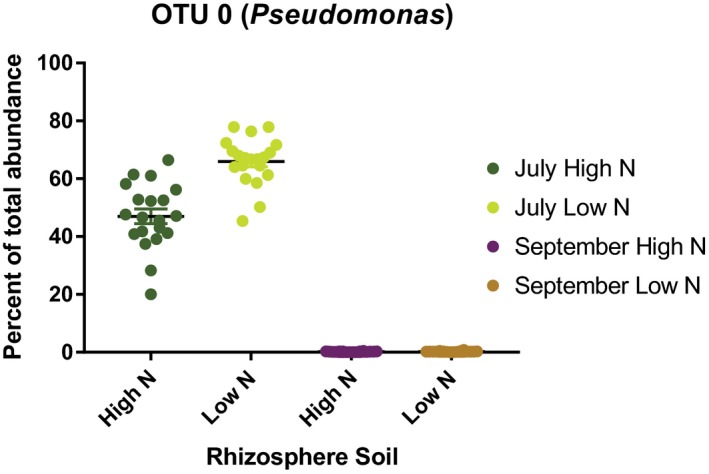
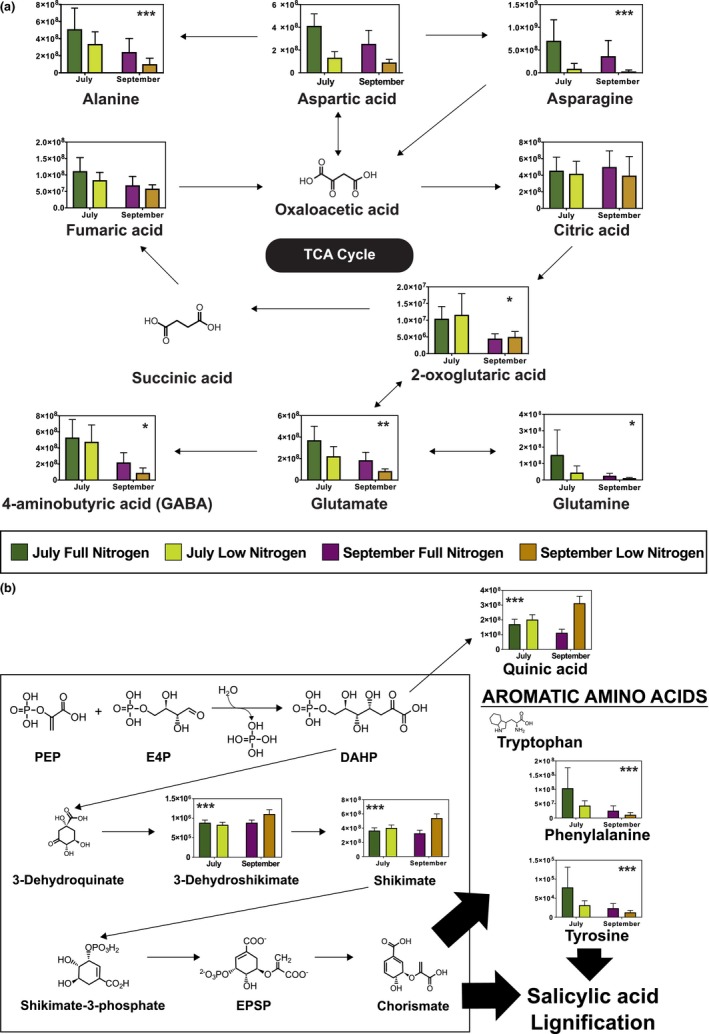
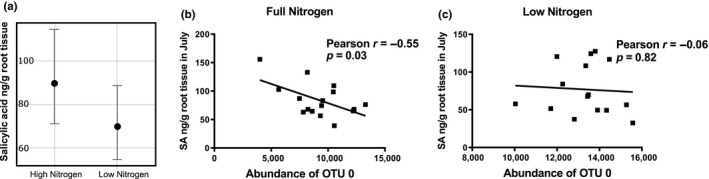
Sorghum (Sorghum bicolor [L.] Moench) is the fifth most productive cereal crop worldwide with some hybrids having high biomass yield traits making it promising for sustainable, economical biofuel production. To maximize biofuel feedstock yields, a more complete understanding of metabolic responses to low nitrogen (N) will be useful for incorporation in crop improvement efforts. In this study, 10 diverse sorghum entries (including inbreds and hybrids) were field-grown under low and full N conditions and roots were sampled at two time points for metabolomics and 16S amplicon sequencing. Roots of plants grown under low N showed altered metabolic profiles at both sampling dates including metabolites important in N storage and synthesis of aromatic amino acids. Complementary investigation of the rhizosphere microbiome revealed dominance by a single operational taxonomic unit (OTU) in an early sampling that was taxonomically assigned to the genus Pseudomonas. Abundance of this Pseudomonas OTU was significantly greater under low N in July and was decreased dramatically in September. Correlation of Pseudomonas abundance with root metabolites revealed a strong negative association with the defense hormone salicylic acid (SA) under full N but not under low N, suggesting reduced defense response. Roots from plants with N stress also contained reduced phenylalanine, a precursor for SA, providing further evidence for compromised metabolic capacity for defense response under low N conditions. Our findings suggest that interactions between biotic and abiotic stresses may affect metabolic capacity for plant defense and need to be concurrently prioritized as breeding programs become established for biofuels production on marginal soils.

Keywords: metabolism; metabolomics; microbiome; nitrogen; rhizosphere; roots; salicylic acid; sorghum; stress.


Conflict of interest statement

The authors have no conflict of interest to declare for this research.

Figures

Figure 1
Figure 1
PCA biplots include scores (squares) and metabolite loadings (gray circles) of the root metabolomics analysis in (a) July and (b) September. Data from GC‐ and LCMS analyses were combined. Arrows indicate the direction of influence for a specific metabolite on N treatment group separation. Circles representing metabolites are sized according to loading scores determined by the PCA analysis
Figure 2
Figure 2
Heatmap showing spearman rank correlations of agronomic traits (rows) and root metabolites (columns). Color scale for correlation value is dark blue: R 2 = 1; dark red (strong positive association): R 2 = −1 (strong negative association). Squares are also sized according to R 2 values with larger squares indicating values close to 1 (blue) or −1 (red). Rows are grouped by collection date (July or September) and treatment (low or full N) with a colored key along the left edge as shown in the legend. Agronomic traits are abbreviated as: wet = total plant (includes stems, leaves, and panicle) fresh weight, total dry = total plant (includes stems, leaves, and panicle) dry matter weight, veg dry = vegetative portion of plant (stems and leaves) dry weight measured in kilograms per hectare
Figure 3
Figure 3
OTU 0 (Pseudomonas) dominated the rhizosphere under both high and low N conditions, but was significantly more abundant under low N conditions (p < 0.05, ANOVA). Boxplot of OTU 0 (Pseudomonas) shown as percent abundance of total normalized reads in rhizosphere soil from the July sampling and demonstrates the dominance of the rhizosphere community by OTU 0
Figure 4
Figure 4
Pathway analysis (a) alanine, aspartate, and glutamate metabolism and (b) phenylalanine, tyrosine, and tryptophan biosynthesis (shikimate pathway). Metabolites detected during metabolomics analysis have peak intensities presented as bar graphs overlaid on the pathway map. Peak intensity reflects the semiquantitative nature of the nontargeted approach used for this global metabolite analysis. Statistical significance when using a nonparametric factorial ANOVA test (Supporting Information Table S2) is denoted as follows: *significant by date, **significant by treatment and date but not the interaction, ***significant by date treatment interaction (< 0.05). Dark green = July high N; Dark purple = September high N; Light green = July low N; Light purple = September low N
Figure 5
Figure 5
Salicylic acid and OTU 0 abundance. The main effect of nitrogen treatment showed significantly reduced root salicylic acid content under low N compared to high N when averaged over the two sampling dates and treating genotype as a random effect. Panel (a) shows the effects plot with 95% confidence interval for the linear mixed model, (b) OTU 0 is negatively correlated with salicylic acid with full N and (c) not with low N

Similar articles

Cited by

References

    1. AbuQamar, S. , Chen, X. , Dhawan, R. , Bluhm, B. , Salmeron, J. , Lam, S. , … Mengiste, T. (2006). Expression profiling and mutant analysis reveals complex regulatory networks involved in Arabidopsis response to Botrytis infection. The Plant Journal, 48, 28–44. 10.1111/j.1365-313X.2006.02849.x - DOI - PubMed
    1. Anderson, M. J. (2001). A new method for non‐parametric multivariate analysis of variance. Austral Ecology, 26, 32–46.
    1. Bates, D. , Mächler, M. , Bolker, B. , & Walker, S. (2014). Fitting linear mixed‐effects models using lme4. arXiv preprint arXiv:1406.5823.
    1. Beals, E. W. (1984). Bray‐Curtis ordination: An effective strategy for analysis of multivariate ecological data. Advances in Ecological Research, 14, 1–55.
    1. Bolyen, E. , Rideout, J. R. , Dillon, M. R. , Bokulich, N. A. , Abnet, C. , Al‐Ghalith, G. A. , … Asnicar, F. (2018). QIIME 2: Reproducible, interactive, scalable, and extensible microbiome data science. PeerJ Preprints. - PMC - PubMed

LinkOut - more resources