. 2019 Mar 20;3(3):e00127.
doi: 10.1002/pld3.127. eCollection 2019 Mar.

Chlorophyll catabolism precedes changes in chloroplast structure and proteome during leaf senescence

Affiliations

Chlorophyll catabolism precedes changes in chloroplast structure and proteome during leaf senescence

Eyal Tamary et al. Plant Direct. .

Abstract

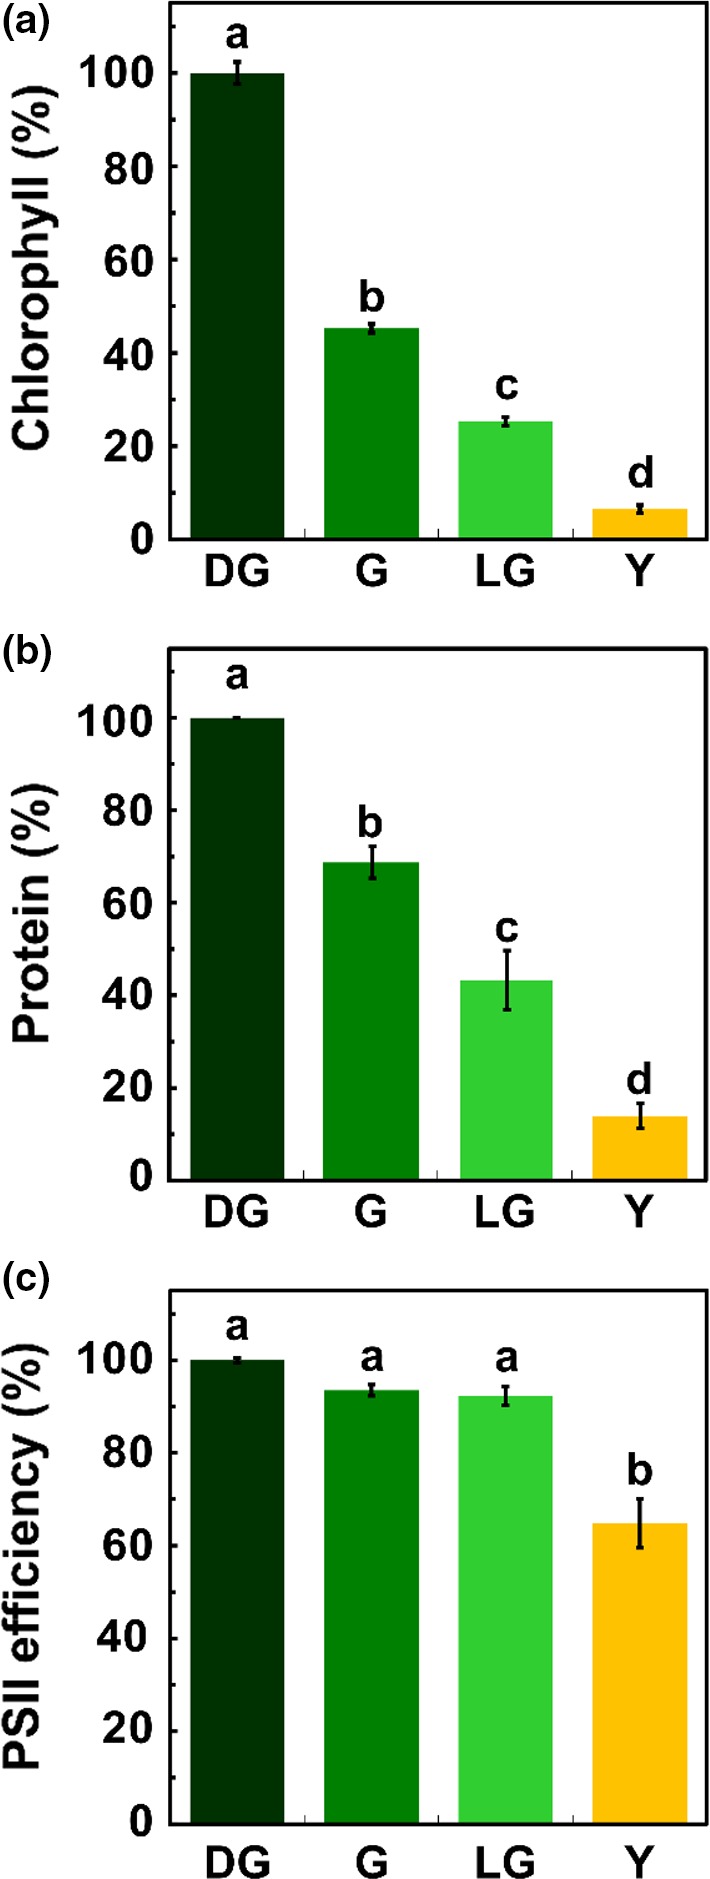
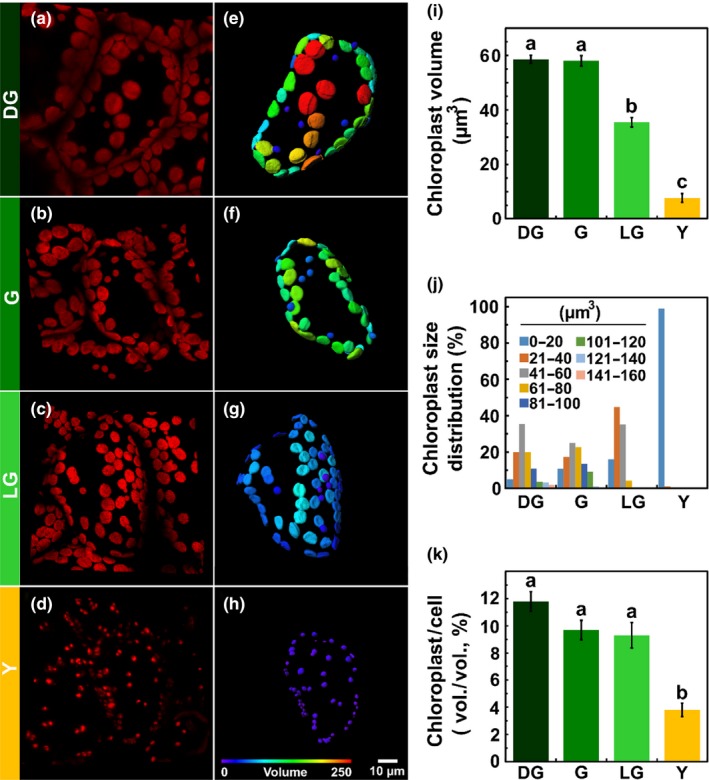
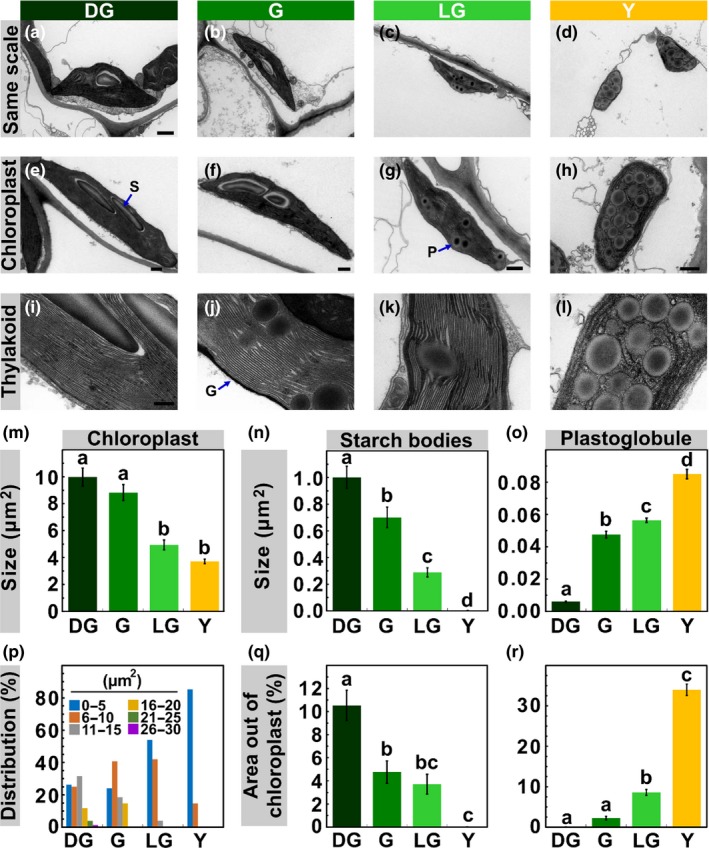
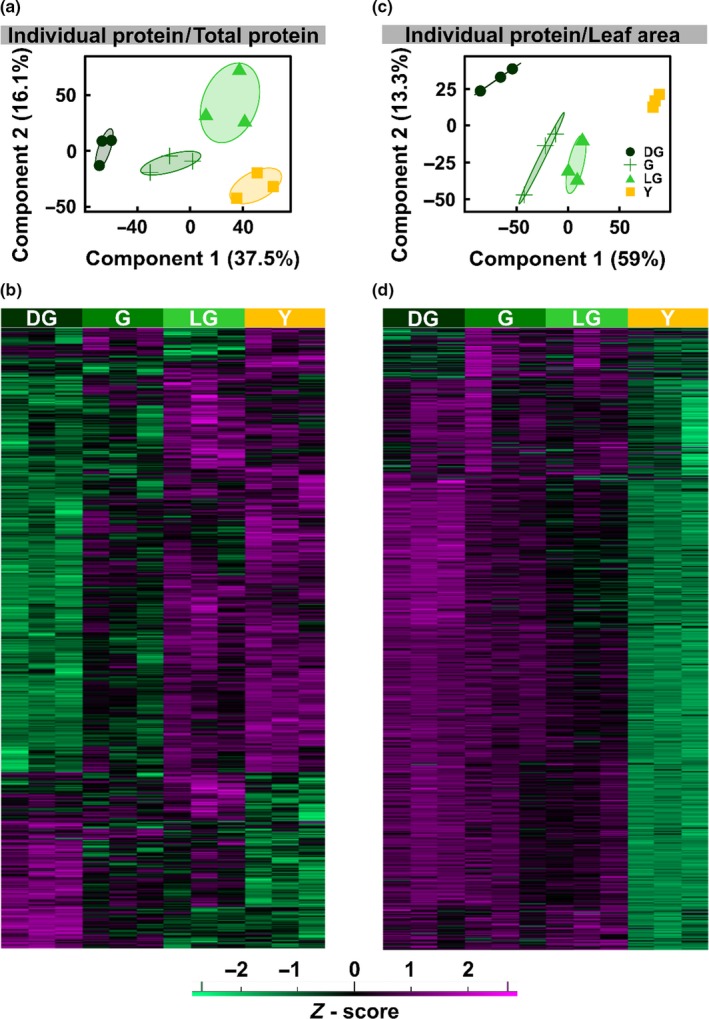
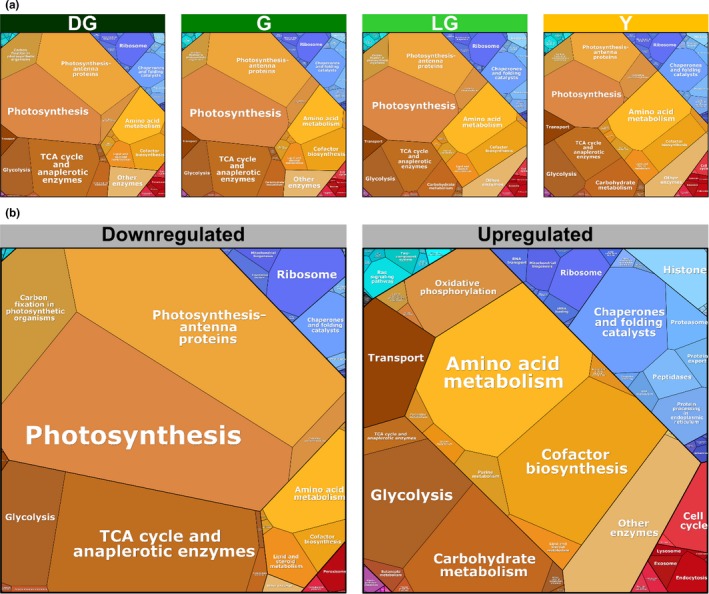
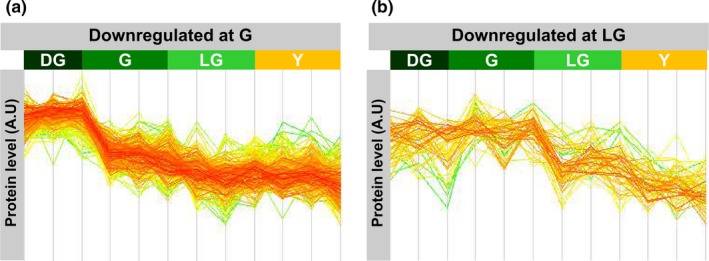
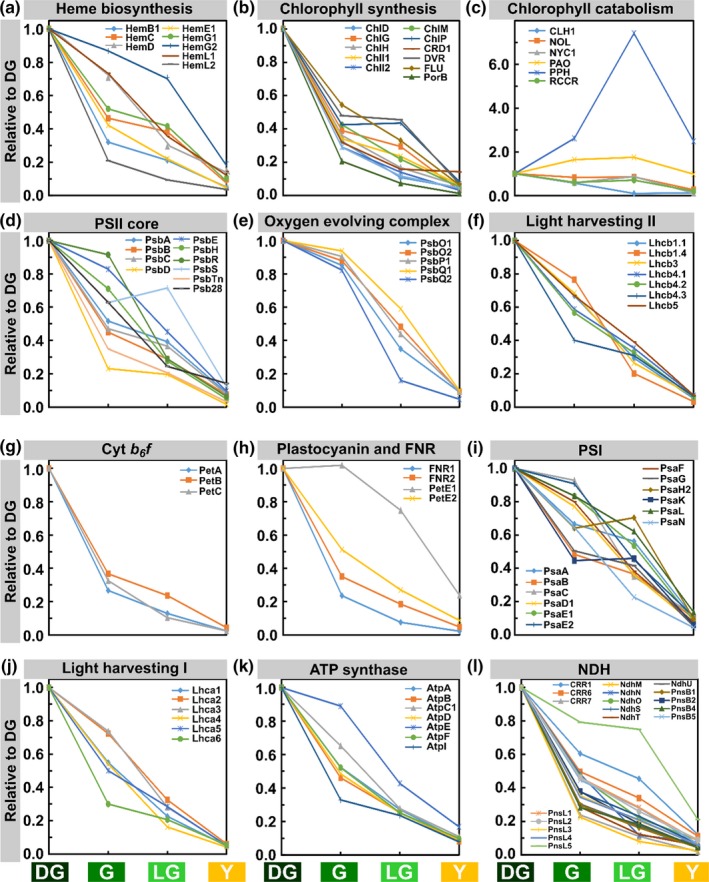
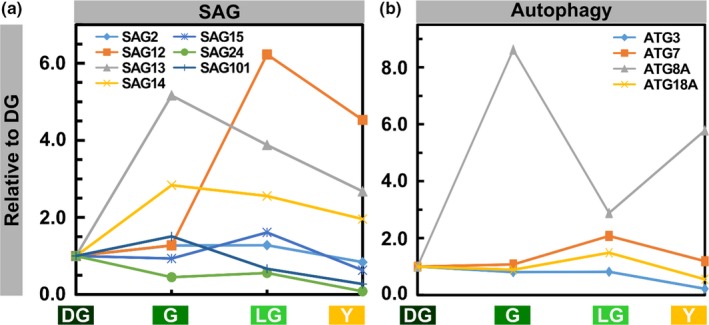
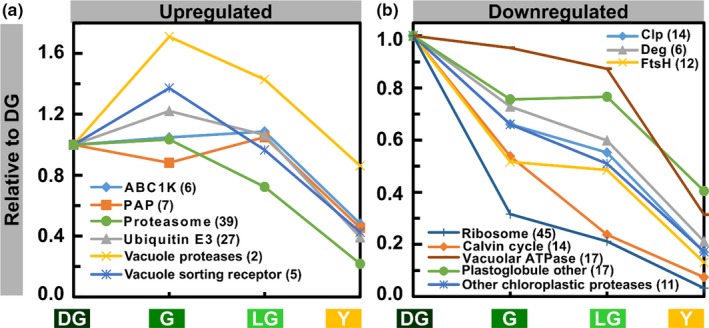
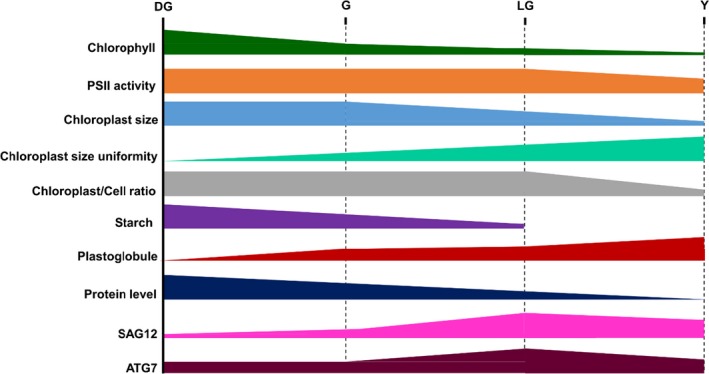
The earliest visual changes of leaf senescence occur in the chloroplast as chlorophyll is degraded and photosynthesis declines. Yet, a comprehensive understanding of the sequence of catabolic events occurring in chloroplasts during natural leaf senescence is still missing. Here, we combined confocal and electron microscopy together with proteomics and biochemistry to follow structural and molecular changes during Arabidopsis leaf senescence. We observed that initiation of chlorophyll catabolism precedes other breakdown processes. Chloroplast size, stacking of thylakoids, and efficiency of PSII remain stable until late stages of senescence, whereas the number and size of plastoglobules increase. Unlike catabolic enzymes, whose level increase, the level of most proteins decreases during senescence, and chloroplast proteins are overrepresented among these. However, the rate of their disappearance is variable, mostly uncoordinated and independent of their inherent stability during earlier developmental stages. Unexpectedly, degradation of chlorophyll-binding proteins lags behind chlorophyll catabolism. Autophagy and vacuole proteins are retained at relatively high levels, highlighting the role of extra-plastidic degradation processes especially in late stages of senescence. The observation that chlorophyll catabolism precedes all other catabolic events may suggest that this process enables or signals further catabolic processes in chloroplasts.

Keywords: Arabidopsis; chlorophyll; chloroplast; photosynthesis; plastoglobule; senescence; thylakoid.


Conflict of interest statement

The authors declare no conflict of interest associated with the work described in this manuscript.

Figures

Figure 1
Figure 1
Leaves throughout senescence. General characterization of Arabidopsis thaliana leaves throughout four stages of senescence: Dark Green (DG), Green (G), Light Green (LG) and Yellow (Y). (a) Chlorophyll content (< 0.05, = 6). 100% = 131.18 nmol chl/cm2. (b) Protein levels (< 0.05, = 3). 100% = 3.56 μg/mm2. (c) PSII photochemical efficiency (Fv/Fm), measured by pulse‐amplitude modulated fluorometry (< 0.05, = 4). 100% = 0.76. The data represent mean values, bars shown indicate standard error and letters indicate statistical significance using Tukey‐Kramer HSD test
Figure 2
Figure 2
Chloroplasts during leaf senescence. Characterization of chloroplasts from live tissues of Arabidopsis thaliana leaves, using confocal imaging, throughout four stages of leaf senescence: Dark Green (DG), Green (G), Light Green (LG) and Yellow (Y). (a–d) Three‐dimensional reconstructed confocal images of mesophyll cells. All images are of the same magnification. (e–h) Three‐dimensional model of the chloroplasts present in a cell shown in panels (a)–(d), respectively. Coloring is based on volume. (i) Chloroplast volume. (j) Volume distribution, calculated from the 3D models. (< 0.05,  128). (k) Total chloroplast volume out of the cell volume, calculated from the 3D models (< 0.05,  25). The data represent mean values, bars indicate standard error and letters indicate significance using Tukey‐Kramer HSD test
Figure 3
Figure 3
Chloroplast Structure Throughout Senescence. (a‐h) Transmission electron microscopy (TEM) images of chloroplasts present in mesophyll cells of Arabidopsis thaliana during stages DG, G, LG and Y. Scale bars: a–d, 1 μm, e–h, 500 nm. (i–l) TEM images of thylakoids. Scale bar, 200 nm. Average chloroplast area (m) and size distribution (p), calculated from TEM images (< 0.05, n ≥ 50). (n) Starch bodies average size and (q), their percentage out of the chloroplast total area, as calculated from TEM images (< 0.05, n ≥ 40). (o) Plastoglobules average size and (r), their percentage out of the chloroplast total area (< 0.05, n ≥ 30). The data represent mean values, bars shown indicate standard error and letters indicate significance
Figure 4
Figure 4
PCA and Hierarchical Clustering of Protein MS Data. Overview of proteomic data as obtained from protein 2D‐LC‐MS/MS analysis on extracts of Arabidopsis thaliana senescing leaf samples during the four stages of senescence. a, c: Principal component analysis (PCA) of the samples, normalized to total protein (a) or leaf area (c). b, d: Hierarchical clustering of the proteins detected, based on equal protein loading (b) or normalized to leaf area (d)
Figure 5
Figure 5
Quantitative composition of proteomes during senescence. Visual representation of proteomic data of Arabidopsis thaliana mesophyll cells during four stages of leaf senescence, based on proteomic data normalized to total protein. ~3,500 proteins that passed the ANOVA significance test (< 0.05) were used for this analysis. (a) Proteomaps of total proteins. (b) Proteomaps of downregulated and upregulated proteins
Figure 6
Figure 6
Different patterns of protein downregulation. Downregulated proteins were divided based on the pattern of the change in their level. (a) proteins downregulated early in senescence, after the DG stage. (b) proteins downregulated upon the transition to the LG stage
Figure 7
Figure 7
Behavior of proteins in different chloroplast protein groups. Proteomic data derived from the four stages of senescence. Values are based on normalization to leaf area. Proteins were selected from those that passed the ANOVA significance test (< 0.05). Protein levels are relative to the DG stage
Figure 8
Figure 8
Levels of SAG and Autophagy Proteins During Senescence. (a) SAG proteins. (b) Autophagy proteins. Values are based on proteomic data normalized to leaf area. Proteins were selected from those that passed the ANOVA significance test (< 0.05). Protein levels are relative to the DG stage
Figure 9
Figure 9
Behavior of Selected Protein Groups During Senescence. (a) Upregulated protein groups. Groups were considered upregulated if their level exceeded their level in a previous stage at least once. (b) Downregulated protein groups. Values are means of levels of proteins comprising a group. Numbers in parentheses indicate the number of proteins in each group. Protein levels are relative to the DG stage
Figure 10
Figure 10
Characteristics of senescence. A schematic representation of the behavior of different parameters throughout four stages of senescence

References

    1. Adam, Z. (1996). Protein stability and degradation in chloroplasts. Plant Molecular Biology, 32, 773–783. 10.1007/BF00020476 - DOI - PubMed
    1. Bhuiyan, N. H. , & van Wijk, K. J. (2017). Functions and substrates of plastoglobule‐localized metallopeptidase PGM48. Plant Signaling & Behavior, 12, e1331197 10.1080/15592324.2017.1331197 - DOI - PMC - PubMed
    1. Buchanan‐Wollaston, V. , Page, T. , Harrison, E. , Breeze, E. , Lim, P. O. , Nam, H. G. , … Leaver, C. J. (2005). Comparative transcriptome analysis reveals significant differences in gene expression and signalling pathways between developmental and dark/starvation‐induced senescence in Arabidopsis. Plant Journal, 42, 567–585. 10.1111/j.1365-313X.2005.02399.x - DOI - PubMed
    1. Butenko, Y. , Lin, A. , Naveh, L. , Kupervaser, M. , Levin, Y. , Reich, Z. , & Adam, Z. (2018). Differential roles of the thylakoid lumenal Deg protease homologs in chloroplast proteostasis. Plant Physiology, 178, 1065–1080. 10.1104/pp.18.00912 - DOI - PMC - PubMed
    1. Carrion, C. A. , Costa, M. L. , Martinez, D. E. , Mohr, C. , Humbeck, K. , & Guiamet, J. J. (2013). In vivo inhibition of cysteine proteases provides evidence for the involvement of ‘senescence‐associated vacuoles’ in chloroplast protein degradation during dark‐induced senescence of tobacco leaves. Journal of Experimental Botany, 64, 4967–4980. 10.1093/jxb/ert285 - DOI - PubMed

LinkOut - more resources