. 2019 Jun 27:8:e45853.
doi: 10.7554/eLife.45853.

Non-canonical Wnt signaling regulates junctional mechanocoupling during angiogenic collective cell migration

Affiliations

Non-canonical Wnt signaling regulates junctional mechanocoupling during angiogenic collective cell migration

Joana R Carvalho et al. Elife. .

Abstract

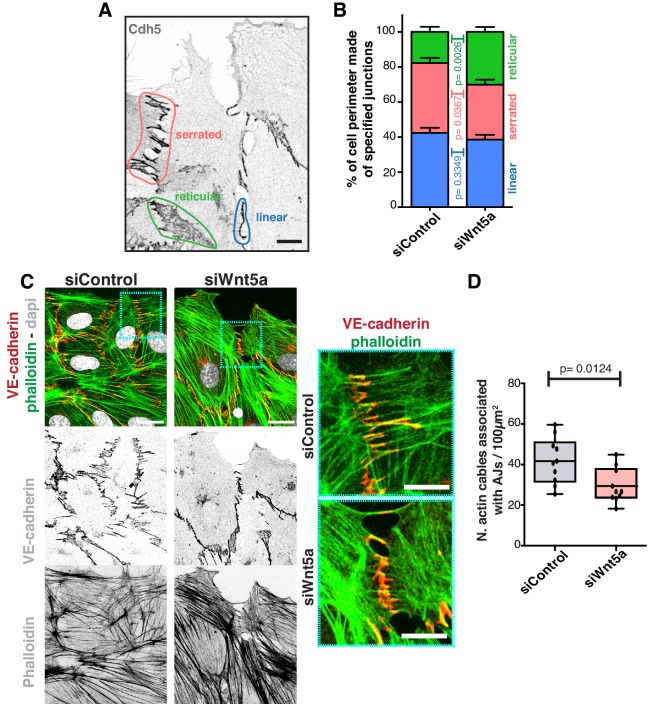
Morphogenesis of hierarchical vascular networks depends on the integration of multiple biomechanical signals by endothelial cells, the cells lining the interior of blood vessels. Expansion of vascular networks arises through sprouting angiogenesis, a process involving extensive cell rearrangements and collective cell migration. Yet, the mechanisms controlling angiogenic collective behavior remain poorly understood. Here, we show this collective cell behavior is regulated by non-canonical Wnt signaling. We identify that Wnt5a specifically activates Cdc42 at cell junctions downstream of ROR2 to reinforce coupling between adherens junctions and the actin cytoskeleton. We show that Wnt5a signaling stabilizes vinculin binding to alpha-catenin, and abrogation of vinculin in vivo and in vitro leads to uncoordinated polarity and deficient sprouting angiogenesis in Mus musculus. Our findings highlight how non-canonical Wnt signaling coordinates collective cell behavior during vascular morphogenesis by fine-tuning junctional mechanocoupling between endothelial cells.

Keywords: adherens junctions; angiogenesis; cell biology; collective cell migration; developmental biology; human; mechanotransduction; mouse; non-canonical Wnt signaling; vinculin.


Conflict of interest statement

JC, IF, CF, AP, PB, MD, FV, NS, FC, CF No competing interests declared

Figures

Figure 1.
Figure 1.. Wnt5a regulates endothelial collective cell migration.
(A) Quantification of wound closure, straightness and cell velocity over the course of 16 hr migration in siControl (n = 100 cells, from two independent experiments) and siWNT5a (n = 100 cells, from two independent experiments) transfected cells. Data are mean ± SEM, p-values from unpaired t-test. (B) Wound edge of siControl (left) and siWNT5a (right) transfected cells showing individual cell trajectories within the monolayer. Circles indicate cell nuclei. Scale bar, 50 µm. (C) Correlation length box plots from siControl (n = 6), siWNT5a (n = 8) and siCtnna1 (n = 3). (D) Polarity axis of each cell was defined as the angle (α) between the scratch edge and the cell polarity axis, defined by the vector drawn from the center of the cell nucleus to the center of the Golgi apparatus. The polarity index was calculated according to the formula and it was used as a measure for collective polarization. (E) Polarity index as function of the distance from the leading edge (µm) in HUVECs monolayers, binning data every 50 µm. Green area corresponds to the mean ± SD of the PI obtained of siCtnna1 cells across the monolayer, excluding leader cells. (F) Representative images of scratch-wound assay showing polarity angles of siControl and siWNT5a KD endothelial cells. Scale bar, 50 µm. (G) Angular histograms showing the distribution of polarization angles of leader cells from siControl (n = 13 images, from six independent experiments) and siWNT5a (n = 19 images, from eight independent experiments). (H) Polarity index box plots of non-infected siControl (n = 13 images, from six independent experiments) and siWNT5a (n = 19 images, from eight independent experiments) leader cells or from siControl (n = 5 images, from three independent experiments) and siWNT5a (n = 6 images, from three independent experiments) leader cells transduced with WNT5a-V5 lentiviruses. p-values from unpaired t-test. (I) Angular histograms showing the distribution of polarization angles of follower cells from siControl (n = 13 images, from six independent experiments) and siWNT5a (n = 19 images, from eight independent experiments). (J) Polarity index box plots of non-infected siControl (n = 13 images, from six independent experiments) and siWNT5a (n = 19 images, from eight independent experiments) follower cells or from siControl (n = 5 images, from three independent experiments) and siWNT5a (n = 6 images, from three independent experiments) follower cells transduced with Wnt5a lentiviruses. p-values from unpaired t-test. (K) Representative images of sprouting fronts from Wnt5a WT; Wnt11 WT and Wnt5a EC-KO; Wnt11 KO mouse retinas labeled for EC nuclei (Erg, green), lumen (Icam2, blue/gray) and Golgi (Golph4, red). Each insert shows corresponding image segmentation of the vascular plexus showing axial polarity vectors (red) and lumen of blood vessels (gray). Scale bar, 200 µm. (L) Polarity axis of each cell was defined as the angle (α) between the sprouting front edge and the cell polarity axis, defined by the vector drawn from the center of the cell nucleus to the center of the Golgi apparatus. (M) Angular histograms showing the distribution of polarization angles of endothelial cells at the vascular sprouting front from Wnt5a WT; Wnt11 WT (n = 4 retinas) and Wnt5a EC-KO; Wnt11 KO (n = 4 retinas) mouse retinas. (N) Polarity index box plots of endothelial cells from Wnt5a WT; Wnt11 WT (n = 4 retinas) and Wnt5a EC-KO; Wnt11 KO (n = 4 retinas) mouse retinas. p-values from unpaired t-test.
Figure 1—figure supplement 1.
Figure 1—figure supplement 1.. WNT5a, not WNT11, regulates collective behavior in vitro.
(A) Angular histograms showing the distribution of polarization angles of leaders (light blue) and followers (dark blue) from siControl, siWNT5a, siWNT11 and siWNT5a + siWNT11 transfected cells. n = 2 independent experiments for all conditions. (B) Angular histograms showing the distribution of polarization angles of leaders (light blue) and followers (dark blue) from siControl (n = 6 images, from three independent experiments) and siα-catenin (n = 4 images, from two independent experiments) transfected cells. p-values from unpaired t-test. (C) Polarity index box plots of leaders (top) and followers (bottom) from siControl (n = 6 images, from three independent experiments) and siα-catenin (n = 4 images, from two independent experiments). p-values from unpaired t-test. (D) Example of Lifeact-mCherry+ HUVEC extending cryptic lamellipodia under an adjacent cell labeled for nuclei (Dapi), tight junctions (ZO1) and actin (Lifeact-mCherry) (top) and the corresponding image segmentation with the cryptic lamellipodia in green, the cell body in blue and the axial polarity vector in black (bottom). Scale bar, 20 µm. (E) Cryptic lamellipodia polarity axis at the wound edge of migrating HUVECs was determined by calculating the angle of polarization (α) between the scratch edge and the polarity axis defined by a vector drawn from the center of the cell nucleus to the center of the cryptic lamellipodia (top). Angular histograms showing the polarity distributions of cryptic lamellipodia of Lifeact-mCherry+ cells from siControl (n = 44 cells, from four independent experiments) and siWNT5a (n = 37 cells, from four independent experiments) transfected cells.
Figure 2.
Figure 2.. Wnt5a regulates adherens junctions’ organization.
(A) Example of the distinct junctions’ morphologies in endothelial cells labeled for adherens junctions (VE-Cadherin) showing: linear (blue), serrated (red) and reticular (green). Scale bar, 10 µm. (B) Quantification of cell perimeter (%) composed of linear (blue), serrated (red) and reticular (green) in siControl (n = 22 leader and n = 40 follower cells, from four independent experiments) and siWNT5a (n = 40 leader and n = 46 follower cells, from six independent experiments) transfected cells. Data are mean ± SD and p-values from unpaired t-test. (C) Detail of wound edge of HUVECs showing the association of actin stress fibers (phalloidin) to the adherens junctions (VE-Cadherin) in siControl and siWNT5a transfected cells. Nucleus labeled with Dapi. Scale bar, 20 µm. Blue squares show a higher magnification of the association of actin filaments (phalloidin) and adherens junctions (VE-Cadherin) in siControl and siWNT5a cells. Scale bar, 10 µm. (D) Quantification of the number of actin stress fibers connected to VE-cadherin positive cell-cell junctions in siControl and siWNT5a cells. N = 10 images, from two independent experiments. Data are mean ± SD, and p-values from unpaired t-test.
Figure 3.
Figure 3.. Wnt5a signaling strengthens adherens junctions and enhances cell-cell force transmission.
(A) Diagram depicting the four steps involved in cell-cell adhesion measurements using atomic force microscopy (AFM), as well as its correspondence in the force-distance curves: (1) Attaching – cell attached to the tipless cantilever is lowered to make contact with another cell at the bottom; (2) Attached – cells establish cell-cell contact; (3) Detaching – the upper cell is pulled in order to break the cell-cell contact previously established; (4) Detached – cells are again fully separated. The gray area between the approach (red) and retraction (blue) curves corresponds to the value of work (energy necessary to overcome the cell-cell adhesion). The total force necessary to separate the two cells can also be obtained from the yy axis. (B) Quantification of the work necessary for cell-cell detachment in siControl with (n = 155 cell-cell interactions, from five independent experiments) or without EGTA (n = 395 cell-cell interactions, from five independent experiments), siWNT5a with (n = 205 cell-cell interactions, from six independent experiments) or without EGTA (n = 299 cell-cell interactions, from six independent experiments) and siCdh5 (n = 80 cell-cell interactions, from one experiment) transfected cells. Data are mean ± SEM, p-values from multiple comparisons in one-way ANOVA. (C) Maximum detachment force histogram for siCdh5 transfected cells (n = 80 cell-cell interactions, from one experiment). Data obtained from one independent experiment. (D) Maximum detachment force histogram for siControl transfected cells (n = 395 cell-cell interactions, from five independent experiments) (E) Maximum detachment force histogram for siWNT5a transfected cells (n = 299 cell-cell interactions, from six independent experiments). (F) The percentage (%) of cadherin-dependent interactions was calculated by dividing the number of events with detachment force above 150pN by the total number of events on each condition. The quantification of the percentage of the Cadherin-dependent interactions was based on the result obtained from the siCdh5-siCdh5 detachment force histogram (in panel C). (G) Diagram showing the molecular structure and mechanism of action of the FRET VE-cadherin tension sensor (VE-Cad TS) or VE-cadherin tailess sensor (VE-Cad TL). (H) HUVEC expressing VE-Cad TS undergoing FRET acceptor photobleaching at the adherens junction. Squares show the cell junction before (top) and after photobleaching (bottom). Scale bar = 10 µm. (I) Quantification of FRET efficiency in siControl (n = 51 cell-cell junctions, from six independent experiments) and siWNT5a (n = 69 cell-cell junctions, from six independent experiments) transfected cells expressing either VE-Cad TS or the tailless biosensor lacking the β-catenin binding-domain, VE-Cad TL (n = 3 cell-cell junctions, from one experiment for both siControl and siWNT5a conditions). Mean ± SD, p-values from unpaired t-test.
Figure 4.
Figure 4.. Wnt5a signaling promotes association of vinculin to the adherens junction complex.
(A) Western blot for VE-cadherin, vinculin, α-catenin and β-catenin and α-tubulin in siControl and siWNT5a transfected cells. (B) Quantification of VE-cadherin, vinculin, α-catenin and β-catenin relative protein levels normalized to α-tubulin. Data are mean ± SD, p-values from unpaired t-test (n = 5 independent experiments). (C) Representative images of HUVECs close to the wound labeled for VE-cadherin and vinculin used for co-localization analysis in siControl (top left) and siWNT5a (bottom left) transfected cells and the corresponding segmentation image showing the co-localizing pixels between both stainings in black (top and bottom right). Green (top right), blue (middle right) and red (bottom right) squares show a higher magnification of a junction where VE-cadherin and vinculin co-localize. Scale bar, 40 µm. (D) Co-localization (%) between α-catenin/VE-cadherin (n = 8 images, from three independent experiments), β-catenin/VE-cadherin (n = 5 images, from two independent experiments), p120Catenin/VE-cadherin (n = 6 images, from two independent experiments), and vinculin/VE-cadherin (n = 39 images, from six independent experiments) in siControl and siWNT5a transfected cells. Data are mean ± SD, p-values from unpaired t-test. (E) Representative images of HUVECs close to the wound labeled with VE-cadherin used for proximity ligation assay (PLA) between vinculin and VE-cadherin in siControl and siWNT5a transfected cells. Nucleus labeled with Dapi. Scale bar, 20 µm. (F) Co-localization (%) between PLA signal and VE-cadherin in siControl (n = 12 images, six independent experiments) and siWNT5a (n = 12 images, six independent experiments) transfected cells. Data are mean ± SD, p-values from unpaired t test. (G) VE-cadherin (n = 3) and vinculin (n = 4) co-immunoprecipitation in siControl and siWNT5a transfected cells. GAPDH co-immunoprecipitation was used as a control. (H) Fold change quantification of vinculin-VE-cadherin (n = 3) and VE-cadherin-vinculin (n = 4) binding in siControl and siWNT5a transfected cells. Data are mean ± SD, p-values from unpaired t test.
Figure 5.
Figure 5.. Wnt5a signaling stabilizes vinculin at adherens junctions.
(A) Representative images of HUVECs close to the wound stained for nuclei (Dapi), VE-cadherin (Cdh5), α18-catenin and vinculin for co-localization studies in siControl and siWNT5a transfected cells. Scale bar, 20 µm. (B) Co-localization (%) between α18-catenin/VE-Cadherin and vinculin/α18 catenin in siControl (n = 12 images, three independent experiments) and siWNT5a (n = 12 images, three independent experiments) transfected cells. Data are mean ± SD, p-values from unpaired t-test. (C) Co-localization (%) between vinculin/VE-cadherin as function of calcium incubation time (min) after the calcium switch in HUVECs monolayers of siControl and siWNT5a transfected cells. Data are mean ± SD, p-values from unpaired t-test (n = 9–15 images per time point per condition, from 2 to 3 independent experiments).
Figure 6.
Figure 6.. Vinculin is essential for sprouting angiogenesis and collective cell polarity.
(A) Angular histograms showing the distribution of polarization angles from siControl (n = 10) and siVinculin (n = 11) transfected cells. (B) Polarity index box plots of leaders and followers from siControl (n = 8 images, from four independent experiments) and siVinculin (n = 6 images, from three independent experiments). p-values from unpaired t-test. (C) Quantification of wound closure over the course of 16 hr migration in siControl and siWNT5a transfected cells. N = 4 independent experiments. Data are mean ± SEM, p-values from unpaired t-test. (D) Representative images of overviews of mouse retinas from Vinculin WT and Vinculin EC-KO labeled for CD31. Scale bar, 250 µm. (E) Box plots of vascular outgrowth, vessel density, number of branch points and EC density in Vinculin WT (n = 6 retinas) and Vinculin EC-KO (n = 6 retinas) mouse retinas. p-values from unpaired t-test. (F) Box plot of vessel regression events in Vinculin WT (n = 4 retinas) and Vinculin EC-KO (n = 6 retinas) mouse retinas. p-values from unpaired t-test. (G) Representative images of sprouting fronts from Vinculin WT and Vinculin EC-KO; mouse retinas labeled for EC nuclei (Erg, green), lumen (Icam2, blue) and Golgi (Golph4, red). Each insert shows corresponding image segmentation of the vascular plexus showing axial polarity vectors. Scale bar, 200 µm. (H) Angular histograms showing the distribution of polarization angles of endothelial cells at the vascular sprouting front from Vinculin WT (n = 4 retinas) and Vinculin EC-KO (n = 4 retinas) mouse retinas. (I) Polarity index box plots of endothelial cells at the vascular sprouting front from Vinculin WT (n = 4 retinas) and Vinculin EC KO (n = 4 retinas) mouse retinas. p-values from unpaired t-test.
Figure 7.
Figure 7.. Active vinculin rescues Wnt5a deficiency.
(A) Angular histograms showing the distribution of polarization angles from siControl and siWNT5a transfected cells either non-infected (n = 21–23 images, from six independent experiments) or expressing Vinculin-Full-Length-GFP (n = 9–11 images, from six independent experiments) or Vinculin-T12-GFP (n = 9–11 images, from six independent experiments). (B) Polarity index box plots of siControl and siWNT5a transfected cells either non-infected (n = 21–23 images, from six independent experiments) or Vinculin-Full-Length-GFP (n = 9–11 images, from six independent experiments) or Vinculin-T12-GFP (n = 9–11 images, from six independent experiments). p-values from unpaired t-test. (C) siControl and siWNT5a transfected HUVECs expressing Vinculin-Full-Length-GFP and Vinculin-T12-GFP. Nucleus labeled with Dapi, Golgi apparatus with GM130 and adherens junctions with VE-Cadherin. Scale bar, 20 µm. (D) Quantification of cell perimeter (%) composed of linear (blue), serrated (red) and reticular (green) in siControl and siWNT5a transfected cells expressing either Vinculin-Full-Length-GFP (n = 16 and 10 cells, respectively, from three independent experiments) or Vinculin-T12-GFP (n = 20 and 21 cells, respectively, from three independent experiments). Data are mean ± SD and p-values from unpaired t-test.
Figure 7—figure supplement 1.
Figure 7—figure supplement 1.. Overexpression of exogenous vinculin isoforms rescues polarity defects of vinculin siRNA depleted cells.
(A) Angular histograms showing the distribution of polarization angles from siVinculin transfected cells expressing Vinculin-Full-Length-GFP (n = 4 images, two independent experiments) or Vinculin-T12-GFP (n = 4 images, two independent experiments). (B) Polarity index box plots of siVinculin transfected cells non-infected (n = 4 images, two independent experiments) or infected with Vinculin-Full-Length-GFP (n = 4 images, two independent experiments) or Vinculin-T12-GFP (n = 4 images, two independent experiments). p-values from unpaired t-test.
Figure 7—figure supplement 2.
Figure 7—figure supplement 2.. Expression levels of exogenous vinculin isoforms in siControl and siWNT5a cells.
(A) Western blot for anti-GFP and α-tubulin in siControl and siWNT5a transfected cells, transduced or not transduced with corresponding lentiviral particles.
Figure 8.
Figure 8.. Forced vinculin binding to a-catenin rescues Wnt5a KD phenotype.
(A) Diagram showing the molecular structure of the αCat-Vinc construct. αCat-Vinc-HA is a fusion protein containing the β-catenin-binding domain of α-catenin (brown) fused with the actin-binding domain of vinculin (gray) and the HA tag (blue). (B) Example of HUVECs expressing αCat-Vinc-HA. Nucleus labeled with Dapi, adherens junctions with VE-Cadherin. Scale bar, 20 µm. Blue square 1 (bottom left) shows a higher magnification of a reticular junction where HA does not co-localize with VE-Cadherin. Blue square 2 (bottom right) shows a higher magnification of a linear junction where HA and VE-cadherin co-localize. (C) Angular histograms showing the distribution of polarization angles from siControl and siWNT5a cells either non-infected (n = 22–24 images, from six independent experiments) or expressing ɑCat-Vinc-HA (n = 11–12 images, from six independent experiments). (D) Polarity index box plots of siControl and siWNT5a cells either non-infected (n = 22–24 images, from six independent experiments) or expressing ɑCat-Vinc-HA (n = 11–12 images, from six independent experiments). p-values from unpaired t-test. (E) Quantification of cell velocity and straightness over the course of 16 hr migration in siControl and siWNT5a transfected cells either non-infected (n = 150 cells, from three independent experiments) or expressing αCat-Vinc-HA (n = 150 cells, from three independent experiments). Data are mean ± SEM, p-values from unpaired t test compare siControl and siWNT5a groups.
Figure 8—figure supplement 1.
Figure 8—figure supplement 1.. Overexpression of a-catenin-vinculin fusion protein rescues polarity defects of Wnt5a siRNA depleted cells.
(A) Western blot for anti-HA and α-tubulin in siControl and siWNT5a transfected cells, transduced or not transduced with corresponding lentiviral particles.
Figure 9.
Figure 9.. Wnt5a stabilizes vinculin at adherens junctions through a ROR2/Cdc42 pathway.
(A) Angular histograms showing the distribution of polarization angles from siControl (n = 11 images, from six independent experiments) and siROR2 (n = 11 images, from six independent experiments) transfected cells. (B) Polarity index box plots from siControl (n = 11 images, from six independent experiments), and siROR2 (n = 11 images, from six independent experiments) cells. p-values from unpaired t-test. (C) Co-localization (%) between Vinculin/VE-Cadherin in siControl and siROR2 transfected cells (n = 9 images, from three independent experiments). Data are mean ± SD, p-values from unpaired t-test. (D) Angular histograms showing the distribution of polarization angles of followers from wild type cells treated with either DMSO, iJNK (SP600125), iRac (NSC27632) or iCdc42 (ML141). n = 4 images, from two independent experiments. (E) Angular histograms showing the distribution of polarization angles from siControl (n = 14 images, from five independent experiments) and siCdc42 (n = 11 images, from five independent experiments) transfected cells. (F) Polarity index box plots from siControl (n = 14 images, from five independent experiments) and siCdc42 (n = 11 images, from five independent experiments) transfected cells. p-values from unpaired t-test. (G) Co-localization (%) between vinculin-VE-cadherin (n = 8 images, from three independent experiments) in siControl and siCdc42 transfected cells. Data are mean ± SD, p-values from unpaired t-test. (H) Detail of adherens junctions showing the association of actin stress fibers (phalloidin) to the adherens junctions (VE-Cadherin) of adjacent HUVECs in siCdc42 transfected cells. Nucleus labeled with Dapi. Scale bar, 20 µm. (I) Quantification of cell perimeter (%) composed of linear (blue), serrated (red) and reticular (green) in siControl and siCdc42 transfected cells (n = 78 and 75 cells, respectively, from two independent experiments). Data are mean ± SEM and p-values from unpaired t-test. (J) Quantification of the number of actin stress fibers connected to VE-cadherin positive cell-cell junctions in siControl or siCdc42 treated cells. N = 7 images, from three independent experiments. Data are mean ± SD, and p-values from unpaired t-test. (K) Pulldown of active GTP-bound Cdc42 in siControl and siROR2 transfected cells unstimulated or stimulated with recombinant human Wnt5a protein (rhWnt5a) (n = 1). (L) HUVEC expressing Cdc42-2G at adherens junction. Scale bar = 20 µm. (M) Box plots showing the number of Cdc42 FRET peaks per junction in siControl (n = 11 cell-cell interfaces, from two independent experiments) and siWNT5a (n = 9 cell-cell interfaces, from two independent experiments) transfected cells. p-values from unpaired t-test. (N) Box plots showing the number of Cdc42 FRET peaks per leading edge in siControl (n = 5 leading edges, from two independent experiments) and siWNT5a (n = 6 leading edges, from two independent experiments) transfected cells. p-values from unpaired t-test. (O) Left: example of a mouse retina sprouting front treated with PBS and Ml141 labeled for EC nuclei (Erg, green), lumen (Icam2, blue) and Golgi (Golph4, red). Right: higher magnification of the sprouting front showing high cell polarity coordination in PBS treated retinas and poor cell polarity coordination in Ml141 treated retinas. Scale bar, 200 µm. (P) Angular histograms showing the distribution of polarization angles of endothelial cells at the vascular sprouting front from mouse retinas treated with PBS (n = 4 retinas) or Ml141 (n = 5 retinas). (Q) Polarity index box plots of endothelial cells from mouse retinas treated with PBS (n = 4 retinas) or Ml141 (n = 5 retinas). p-values from unpaired t-test.
Figure 9—figure supplement 1.
Figure 9—figure supplement 1.. Polarity Indexes of endothelial cells depleted on specific receptors related to non-canonical Wnt signaling.
(A) Angular histograms showing the distribution of polarization angles of leaders (light blue) and followers (dark blue) from siControl (n = 5 independent experiments), siROR1 (n = 3 independent experiments), siFZD4 (n = 4 independent experiments), siFZD6 (n = 4 independent experiments), siFZD7 (n = 3 independent experiments), siFZD8 (n = 2 independent experiments) and siRYK (n = 4 independent experiments) transfected cells.
Figure 10.
Figure 10.. Schematic of the function of Wnt5a signaling in mechanocoupling at adherens junctions.
Working model for the role of non-canonical Wnt ligand WNT5a in mechanotransduction. Wnt5a, through ROR2, activates Cdc42 at adherens junctions, which is necessary for stable binding of vinculin to ɑ-catenin, and efficient mechanocoupling between endothelial cells. Low non-canonical Wnt signaling weakens adherens junctions, impairs force propagation, and disrupts collective cell migration of endothelial cells.
Figure 11.
Figure 11.. Validation of specificity of siRNAs used in this study.
(A) Quantification of mRNA expression levels by qPCR showing the knockdown efficiencies of siRNAs against CDC42, CDH5, CTNNA1, FZD4, FZD6, FZD7, FZD8, ROR1, ROR2, RYK, VCL, WNT5a and WNT11. Data are mean ± SD, gene expression levels were normalized to GAPDH. (B) Western blot showing siRNA knockdown efficiency for α-Catenin (n = 2), VE-cadherin (n = 2), vinculin (n = 1) and Cdc42 (n = 1).
Author response image 1.
Author response image 1.. Data supporting response to reviewers.
(A) Analysis of polarity index and branch orientation in intraocular injections of PBS, VEGF, sFLT1 retinas. Left: examples of the sprouting front vascular network of designated treatments. Right: Box plots for Polarity Indexes, Branch Angle, and distribution of Mean Branch Angle and Mean Polarity Index for each retina. The analysis of branch direction was performed using Fiji. Briefly, the sprouting front of each retina was skeletonize and short branches were pruned. Subsequently, we used the directionality plugin to infer branch directionality. PI analysis and statistical analysis was performed in Matlab. n = 3 independent retinas. (B) Left: Example of area of analysis in a P6 mouse retina. Rectangles represent bins of 100µm wide used to calculate Polarity Index of endothelial cells towards the sprouting front (green > 0-100µm; blue > 300-400µm; yellow > 900-1000µm). Right: Distribution of Polarity Indexes along the Sprouting Front to Optic Nerve axis of the mouse retina, for retinas injected either with PBS (blue line), VEGFA (green line), sFLT1 (VEGFA inhibitor, red line), treated for 36h. Standard deviation is shown as lighter color. Note that close to the Sprouting Front, endothelial cells show a positive Polarity Index, meaning pointing towards the Sprouting Front, but closer to the Optic Nerve, endothelial cells show a negative value of Polarity Index, representing a polarity away from the Sprouting Front (towards the Optic Nerve). VEGFA treatment delays the transition from positive to negative values. sFLT1 reverts polarity of endothelial cells even at the Sprouting front, and in this condition, endothelial cells mainly polarize towards the Optic Nerve. This analysis was possible because of an adaptation of the Polarity Index formula, imposing a positive value to the Polarity Index if mean value of the resultant vector is between 0-179 degrees, and a negative value if mean value of the resultant vector is between 180-359 degrees. (C) Polarity index box plots of siWnt5a transduced or non-transduced cells with Vinculin-Full-Length-GFP (n = 6 independent experiments), Vinculin-T12-GFP (n = 6 independent experiments) or ɑCat-Vinc-HA GFP (n = 7 independent experiments). No significant differences were observed between transduced or non-transduced cells coming from the same experiment. (D) Quantification of mRNA expression levels of Wnt5a by qPCR showing the knockdown efficiencies of each single siRNA against Wnt5a (n = 6 replicas, from 3 independent experiments). (E) Western blot showing poor specificity of Wnt5a (~45 kDa) antibodies.

Similar articles

Cited by

References

    1. Alatortsev VE, Kramerova IA, Frolov MV, Lavrov SA, Westphal ED. Vinculin gene is non-essential in Drosophila melanogaster. FEBS Letters. 1997;413:197–201. doi: 10.1016/s0014-5793(97)00901-0. - DOI - PubMed
    1. Barry DM, Xu K, Meadows SM, Zheng Y, Norden PR, Davis GE, Cleaver O. Cdc42 is required for cytoskeletal support of endothelial cell adhesion during blood vessel formation in mice. Development. 2015;142:3058–3070. doi: 10.1242/dev.125260. - DOI - PMC - PubMed
    1. Bazellières E, Conte V, Elosegui-Artola A, Serra-Picamal X, Bintanel-Morcillo M, Roca-Cusachs P, Muñoz JJ, Sales-Pardo M, Guimerà R, Trepat X. Control of cell-cell forces and collective cell dynamics by the intercellular adhesome. Nature Cell Biology. 2015;17:409–420. doi: 10.1038/ncb3135. - DOI - PMC - PubMed
    1. Berens P. CircStat : a MATLAB toolbox for circular statistics. Journal of Statistical Software. 2009;31 doi: 10.18637/jss.v031.i10. - DOI
    1. Broman MT, Kouklis P, Gao X, Ramchandran R, Neamu RF, Minshall RD, Malik AB. Cdc42 regulates adherens junction stability and endothelial permeability by inducing alpha-catenin interaction with the vascular endothelial cadherin complex. Circulation Research. 2006;98:73–80. doi: 10.1161/01.RES.0000198387.44395.e9. - DOI - PubMed

Publication types