. 2019 Jul 23;13(7):7690-7704.
doi: 10.1021/acsnano.9b01201. Epub 2019 Jul 2.

Biodegradable Biliverdin Nanoparticles for Efficient Photoacoustic Imaging

Affiliations

Biodegradable Biliverdin Nanoparticles for Efficient Photoacoustic Imaging

Parinaz Fathi et al. ACS Nano. .

Abstract

Photoacoustic imaging has emerged as a promising imaging platform with a high tissue penetration depth. However, biodegradable nanoparticles, especially those for photoacoustic imaging, are rare and limited to a few polymeric agents. The development of such nanoparticles holds great promise for clinically translatable diagnostic imaging with high biocompatibility. Metabolically digestible and inherently photoacoustic imaging probes can be developed from nanoprecipitation of biliverdin, a naturally occurring heme-based pigment. The synthesis of nanoparticles composed of a biliverdin network, cross-linked with a bifunctional amine linker, is achieved where spectral tuning relies on the choice of reaction media. Nanoparticles synthesized in water or water containing sodium chloride exhibit higher absorbance and lower fluorescence compared to nanoparticles synthesized in 2-(N-morpholino)ethanesulfonic acid buffer. All nanoparticles display high absorbance at 365 and 680 nm. Excitation at near-infrared wavelengths leads to a strong photoacoustic signal, while excitation with ultraviolet wavelengths results in fluorescence emission. In vivo photoacoustic imaging experiments in mice demonstrated that the nanoparticles accumulate in lymph nodes, highlighting their potential utility as photoacoustic agents for sentinel lymph node detection. The biotransformation of these agents was studied using mass spectroscopy, and they were found to be completely biodegraded in the presence of biliverdin reductase, a ubiquitous enzyme found in the body. Degradation of these particles was also confirmed in vivo. Thus, the nanoparticles developed here are a promising platform for biocompatible biological imaging due to their inherent photoacoustic and fluorescent properties as well as their complete metabolic digestion.

Keywords: biliverdin; biodegradation; bioimaging; fluorescent; nanoparticle; nanoprecipitation; photoacoustic.


Figures
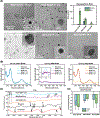
Figure 1.
Figure 1.
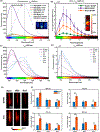
Physicochemical characterization of BVNPs. (A) TEM micrographs of different BVNP compositions. Spherical nanoparticles were found to be formed for each composition. Size was determined using ImageJ, and error bars represent standard deviation across all nanoparticles in a representative image for each nanoparticle type. (B) UV−Vis spectra for BVNPs. Water−BVNPs and NaCl−BVNPs display higher absorbance than MES−BVNPs. High absorbance is observed near 365 and 680 nm. (C) FT-IR spectra confirms the presence of differences between MES−BVNPs and other compositions, with peaks resulting from MES. (D) ζ potential differences between 10 min and 24 h timepoints for water−BVNPs, MES−BVNPs, and NaCl−BVNPs. Error bars represent standard deviation across 12 or more runs as automatically determined by the Malvern Zeta sizer software.
Figure 2.
Figure 2.
Spectral properties of BVNPs. (A) Fluorescence spectra for an excitation wavelength of 365 nm. MES-BVNPs exhibit red-shifting fluorescence with time, resulting in yellow-green fluorescence at 24 h. MES-BVNPs have the greatest fluorescence intensity. MES-BVNPs dialyzed with water lose their fluorescence advantage. Inset depicts 24 h BVNPs under a 365 nm lamp. 1, 2, and 3 correspond to water—BVNP, MES—BVNP, and NaCl—BVNP, respectively (B) Average radiant efficiency for 24 h BVNPs at an excitation wavelength of 465 nm. MES— BVNPs were found to have higher radiant efficiency than water—BVNPs and NaCl—BVNPs. Inset depicts IVIS image of BVNPs for an excitation wavelength of 500 nm and an emission wavelength of 680 nm. 1, 2, and 3 correspond to water—BVNP, MES—BVNP, and NaCl—BVNP, respectively. (C) MES—BVNP fluorescence change with time for an excitation wavelength of 365 nm. An initial decrease in fluorescence intensity is observed, followed by a fluorescence red-shifting and subsequent increase in fluorescence intensity to its initial magnitude. (D) MES—BVNP fluorescence change with time for an excitation wavelength of 465 nm. A steady increase in fluorescence intensity is observed with synthesis time. (E) Photoacoustic tissue phantom imaging of dialyzed BVNPs, compared to ICG dissolved in water at the same concentration. ICG concentrations were 0.51, 0.93, and 0.31 mg/mL, respectively. An excitation wavelength of 680 nm was used. (F) ROI quantification of photoacoustic tissue phantom images. ** indicates statistical significance with P < 0.05.
Figure 3.
Figure 3.
Nanoparticle hydrodynamic size. (A) Screenshots from videos collected by Nanosight for size analysis. Red arrows point to some examples of nanoparticles. Overlays depict representative nanoparticle size distributions (concentration vs size). (B) Hydrodynamic size distribution. 10% of detected nanoparticles have sizes below the D10 value, 50% of detected nanoparticles have sizes below the D50 value, and 90% of detected nanoparticles have sizes below the D90 value. (C) Average hydrodynamic size for each type of particle. (D) Mode nanoparticle size (nanoparticle size with highest frequency of occurrence) for each type of particle. Each mode is calculated from one 1 min Nanosight video. (E) Nanoparticle concentration post-dialysis, as determined by Nanosight video analysis. *** indicates statistical significance with P < 0.001.
Figure 4.
Figure 4.
Photoacoustic imaging of sentinel lymph nodes using BVNPs. 680 nm wavelength photoacoustic images of mice before nanoparticle injection, 10 min after injection, and 30 min after injection. An increase in PA signal intensity is observed post-injection, and nonspecific accumulation of BVNPs can be observed in lymph nodes. White scale bars represent 5 mm, and yellow scale bars represent 1 mm. LN = lymph node; LV= lymphatic vessel.
Figure 5.
Figure 5.
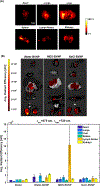
BVNP organ distribution. (A) Representative Photo-acoustic images of dissected organs from mice treated with NaCl−BVNPs. Generally, similar accumulation was observed in the organs of mice treated with water−BVNPs MES−BVNPs, and NaCl−BVNPs. Here, some nanoparticle accumulation is seen in all organs, with very high nanoparticle accumulation in the liver. (B) IVIS fluorescence imaging of dissected organs from mice treated with water−BVNPs, MES−BVNPs, and NaCl−BVNPs. The majority of accumulation in BVNP-treated animals was observed in the liver, kidneys, and lungs, with some accumulation in the spleen and most lymph nodes. Top to bottom: heart, lungs, liver, spleen, lymph nodes, and kidneys. Aggregation-induced fluorescence shifting resulted in a fluorescence response from BVNPs in organs for an excitationwavelengthof675nm. Error bars indicate standard error across all animals for each nanoparticle type.
Figure 6.
Figure 6.
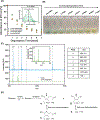
Degradation of water−BVNPs and NaCl−BVNPs. (A)UV−Vis absorbance at 670 nm for degraded BVNPs as a percentage of UV−Vis absorbance at 670 nm for BVNPs prior to degradation. Inset depicts 550−900 nm UV−Vis spectra collected for 10 min water−BVNPs. (B) Color change in diluted 24 h BVNPs as a result of increasing degradation time. A shift from blue-green to yellow is observed with an increase in degradation time. (C) Mass spectrometry results for 24 h water−BVNPs. (D) Proposed BVNP degradation process.
Figure 7.
Figure 7.
Degradation of MES-BVNPs. (A) Color change in diluted 24 h MES-BVNPs as a result of increasing degradation time. A shift from green to yellow is observed with an increase in degradation time. (B) UV-Vis absorbance at 670 nm for degraded MES-BVNPs (13 days degradation) as a percentage of UV-Vis absorbance at 670 nm for MES-BVNPs prior to degradation. (C) Mass spectrometry results for degraded 24 h MES-BVNPs.
Figure 8.
Figure 8.
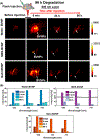
In vivo BVNP degradation over a period of 96 h. (A) Photoacoustic images take prior to nanoparticle injection in mouse flanks and 5 min, 24 h, and 96 h after injection. An increase in signal as a result of BVNP injection and decrease in signal as a result of BVNP degradation is observed. Arrows indicate locations of signal increase and decrease as a result of BVNP injection and degradation. (B) ROI analysis of in vivo degradation for each type of BVNP for photoacoustic imaging acquisition wavelengths of 680, 720, and 750 nm. A sharp decrease in signal 24 h post-injection indicates quick in vivo degradation
Figure 9.
Figure 9.
In vivo BVNP degradation over a period of 24 h. (A) Photoacoustic images taken 2 min, 1h,6h, 12h, and 24 h after injection in mouse flanks. A decrease in signal as a result of BVNP degradation is observed. Arrows indicate locations of signal increase and decrease as a result of BVNP injection and degradation (B) ROI analysis of in vivo degradation for each type of BVNP for photoacoustic imaging acquisition wavelengths of 680, 720, and 750 nm. A steady decrease in BVNP signal is observed over a period of 24 h, indicating BVNP degradation with time.
Scheme 1.
Scheme 1.
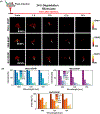
(A) BVNP Synthesis Schematica aThe synthesis solvent determines BVNP composition and spectral properties. The use of water, MES, and NaCl results in water-BVNPs (iii), MES-BVNPs (i), and NaCl-BVNPs (ii), respectively. Dialysis of MES-BVNPs with water (iv) results in water—BVNPs. Nanoparticles degrade in the presence of biliverdin reductase (v). (B) MES-BVNPs have a red-shifted fluorescence compared to the water-BVNPs and NaCl-BVNPs. All compositions exhibit high absorbance at 365 and 680 nm, resulting in fluorescent and photoacoustic properties, respectively.

References

    1. Knox HJ; Chan J. Acoustogenic Probes: A New Frontier in Photoacoustic Imaging. Acc. Chem. Res. 2018, 51, 2897–2905. - PMC - PubMed
    1. Zhang Y; Wang L; Liu L; Lin L; Liu F; Xie Z; Tian H; Chen X. Engineering Metal Organic Frameworks for Photoacoustic Imaging Guided Chemo/Photothermal Combinational Tumor Therapy. ACS Appl Mater. Interfaces 2018, 10, 41035–41045. - PubMed
    1. Qiao Y; Gumin J; Maclellan CJ; Gao F; Bouchard R; Lang FF; Stafford RJ; Melancon MP Magnetic Resonance and Photoacoustic Imaging of Brain Tumor Mediated by Mesenchymal Stem Cell Labeled with Multifunctional Nanoparticle Introduced via Carotid Artery Injection. Nanotechnology 2018, 29, 165101. - PMC - PubMed
    1. Kwon HJ; Shin K; Soh M; Chang H; Kim J; Lee J; Ko G; Kim BH; Kim D; Hyeon T. Large-Scale Synthesis and Medical Applications of Uniform-Sized Metal Oxide Nanoparticles. Adv. Mater. 2018, 30, 1870319. - PubMed
    1. Köker T; Tang N; Tian C; Zhang W; Wang X; Martel R; Pinaud F. Cellular Imaging by Targeted Assembly of Hot-Spot SERS and Photoacoustic Nanoprobes Using Split-Fluorescent Protein Scaffolds. Nat. Commun. 2018, 9, 607. - PMC - PubMed

Publication types