

SPARE: Sparse-view reconstruction challenge for 4D cone-beam CT from a 1-min scan
- PMID: 31247134
- PMCID: PMC6739166
- DOI: 10.1002/mp.13687
SPARE: Sparse-view reconstruction challenge for 4D cone-beam CT from a 1-min scan
Abstract
Purpose: Currently, four-dimensional (4D) cone-beam computed tomography (CBCT) requires a 3-4 min full-fan scan to ensure usable image quality. Recent advancements in sparse-view 4D-CBCT reconstruction have opened the possibility to reduce scan time and dose. The aim of this study is to provide a common framework for systematically evaluating algorithms for 4D-CBCT reconstruction from a 1-min scan. Using this framework, the AAPM-sponsored SPARE Challenge was conducted in 2018 to identify and compare state-of-the-art algorithms.
Methods: A clinically realistic CBCT dataset was simulated using patient CT volumes from the 4D-Lung database. The selected patients had multiple 4D-CT sessions, where the first 4D-CT was used as the prior CT, and the rest were used as the ground truth volumes for simulating CBCT projections. A GPU-based Monte Carlo tool was used to simulate the primary, scatter, and quantum noise signals. A total of 32 CBCT scans of nine patients were generated. Additional qualitative analysis was performed on a clinical Varian and clinical Elekta dataset to validate the simulation study. Participants were blinded from the ground truth, and were given 3 months to apply their reconstruction algorithms to the projection data. The submitted reconstructions were analyzed in terms of root-mean-squared-error (RMSE) and structural similarity index (SSIM) with the ground truth within four different region-of-interests (ROI) - patient body, lungs, planning target volume (PTV), and bony anatomy. Geometric accuracy was quantified as the alignment error of the PTV.
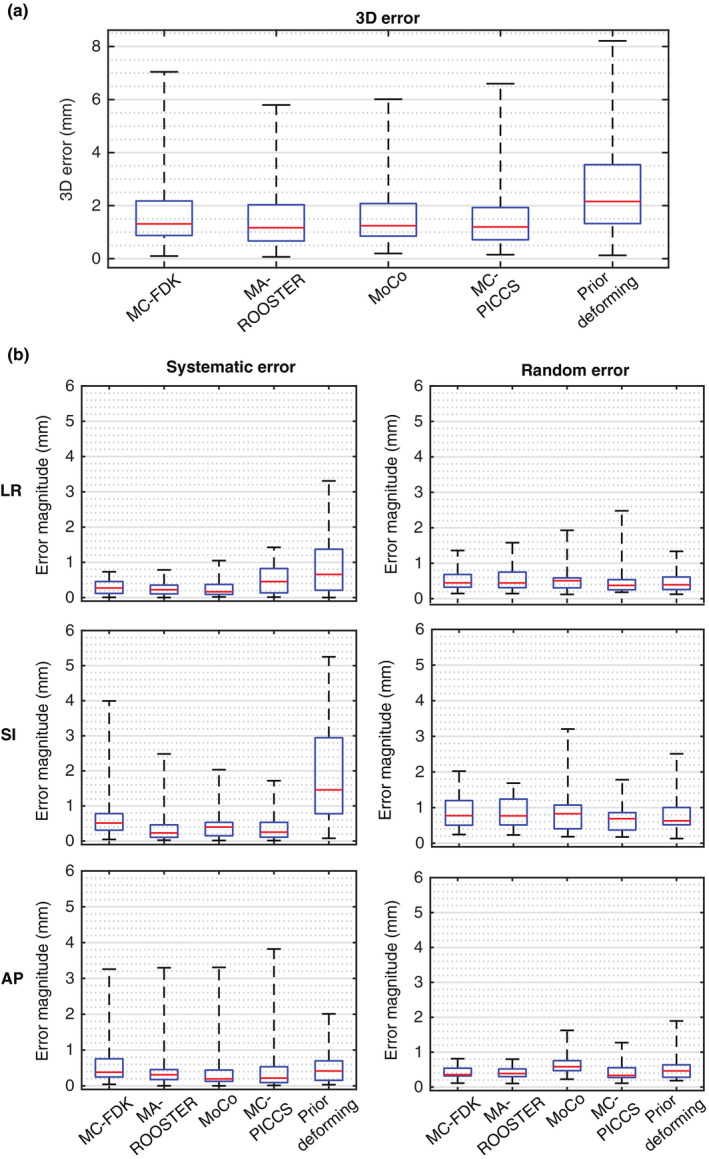
Results: Twenty teams participated in the challenge, with five teams completing the challenge. Techniques involved in the five methods included iterative optimization, motion-compensation, and deformation of the prior 4D-CT. All five methods rendered significant reduction in noise and streaking artifacts when compared to the conventional Feldkamp-Davis-Kress (FDK) algorithm. The RMS of the three-dimensional (3D) target registration error of the five methods ranged from 1.79 to 3.00 mm. Qualitative observations from the Varian and Elekta datasets mostly concur with those from the simulation dataset. Each of the methods was found to have its own strengths and weaknesses. Overall, the MA-ROOSTER method, which utilizes a 4D-CT motion model for temporal regularization, had the best and most consistent image quality and accuracy.
Conclusion: The SPARE Challenge represents the first framework for systematically evaluating state-of-the-art algorithms for 4D-CBCT reconstruction from a 1-min scan. Results suggest the potential for reducing scan time and dose for 4D-CBCT. The challenge dataset and analysis framework are publicly available for benchmarking future reconstruction algorithms.
Keywords: 4D-CBCT; grand challenge; image reconstruction.
© 2019 American Association of Physicists in Medicine.
Figures


References
-
- Sonke J‐J, Zijp L, Remeijer P, van Herk M. Respiratory correlated cone beam CT. Med Phys. 2005;32:1176–1186. ISSN 2473‐4209. - PubMed
-
- Sweeney RA, Seubert B, Stark S, et al. Accuracy and inter‐observer variability of 3D versus 4D cone‐beam CT based image‐guidance in SBRT for lung tumors. Radiat Oncol. 2012;7:81. ISSN 1748‐717X; https://www.ncbi.nlm.nih.gov/pubmed/22682767 - PMC - PubMed
-
- Feldkamp LA, Davis LC, Kress JW. Practical cone‐beam algorithm. J Opt Soc Am A. 1984;1:612–619. http://josaa.osa.org/abstract.cfm?URI=josaa-1-6-612-619
-
- McKinnon G, Bates R. Towards imaging the beating heart usefully with a conventional CT scanner. IEEE Trans Biomed Eng. 1981;28:123–127. ISSN 0018‐9294. - PubMed
MeSH terms
Grants and funding
LinkOut - more resources
Full Text Sources
