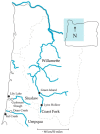
Population Genetic Divergence and Environment Influence the Gut Microbiome in Oregon Threespine Stickleback
- PMID: 31248008
- PMCID: PMC6678413
- DOI: 10.3390/genes10070484
Population Genetic Divergence and Environment Influence the Gut Microbiome in Oregon Threespine Stickleback
Abstract
Much of animal-associated microbiome research has been conducted in species for which little is known of their natural ecology and evolution. Microbiome studies that combine population genetic, environment, and geographic data for wild organisms can be very informative, especially in situations where host genetic variation and the environment both influence microbiome variation. The few studies that have related population genetic and microbiome variation in wild populations have been constrained by observation-based kinship data or incomplete genomic information. Here we integrate population genomic and microbiome analyses in wild threespine stickleback fish distributed throughout western Oregon, USA. We found that gut microbiome diversity and composition partitioned more among than within wild host populations and was better explained by host population genetic divergence than by environment and geography. We also identified gut microbial taxa that were most differentially abundant across environments and across genetically divergent populations. Our findings highlight the benefits of studies that investigate host-associated microbiomes in wild organisms.
Keywords: ecology; genetic divergence; host-bacterial associations; microbiome; microbiota; population genomics.
Conflict of interest statement
The authors declare no conflict of interest. The funders had no role in the design of the study; in the collection, analyses, or interpretation of data; in the writing of the manuscript; nor in the decision to publish the results.
Figures


Similar articles
-
Dietary input of microbes and host genetic variation shape among-population differences in stickleback gut microbiota.ISME J. 2015 Nov;9(11):2515-26. doi: 10.1038/ismej.2015.64. Epub 2015 Apr 24. ISME J. 2015. PMID: 25909977 Free PMC article.
-
Host genomic variation shapes gut microbiome diversity in threespine stickleback fish.mBio. 2023 Oct 31;14(5):e0021923. doi: 10.1128/mbio.00219-23. Epub 2023 Aug 22. mBio. 2023. PMID: 37606367 Free PMC article.
-
Interpopulation Variation in the Atlantic Salmon Microbiome Reflects Environmental and Genetic Diversity.Appl Environ Microbiol. 2018 Aug 1;84(16):e00691-18. doi: 10.1128/AEM.00691-18. Print 2018 Aug 15. Appl Environ Microbiol. 2018. PMID: 29915104 Free PMC article.
-
The role of animal hosts in shaping gut microbiome variation.Philos Trans R Soc Lond B Biol Sci. 2024 May 6;379(1901):20230071. doi: 10.1098/rstb.2023.0071. Epub 2024 Mar 18. Philos Trans R Soc Lond B Biol Sci. 2024. PMID: 38497257 Free PMC article. Review.
-
Studies of threespine stickleback developmental evolution: progress and promise.Genetica. 2007 Jan;129(1):105-26. doi: 10.1007/s10709-006-0036-z. Epub 2006 Aug 8. Genetica. 2007. PMID: 16897450 Review.
Cited by
-
Gut microbiota of an Amazonian fish in a heterogeneous riverscape: integrating genotype, environment, and parasitic infections.Microbiol Spectr. 2023 Sep 19;11(5):e0275522. doi: 10.1128/spectrum.02755-22. Online ahead of print. Microbiol Spectr. 2023. PMID: 37724869 Free PMC article.
-
Integrating population genetic structure, microbiome, and pathogens presence data in Dermacentor variabilis.PeerJ. 2020 Jul 7;8:e9367. doi: 10.7717/peerj.9367. eCollection 2020. PeerJ. 2020. PMID: 32704442 Free PMC article.
-
Microbiomes in the context of developing sustainable intensified aquaculture.Front Microbiol. 2023 Jun 23;14:1200997. doi: 10.3389/fmicb.2023.1200997. eCollection 2023. Front Microbiol. 2023. PMID: 37426003 Free PMC article. Review.
-
Cross-Sectional Analysis of the Microbiota of Human Gut and Its Direct Environment in a Household Cohort with High Background of Antibiotic Use.Microorganisms. 2021 Oct 8;9(10):2115. doi: 10.3390/microorganisms9102115. Microorganisms. 2021. PMID: 34683436 Free PMC article.
-
Threespine Stickleback: A Model System For Evolutionary Genomics.Annu Rev Genomics Hum Genet. 2021 Aug 31;22:357-383. doi: 10.1146/annurev-genom-111720-081402. Epub 2021 Apr 28. Annu Rev Genomics Hum Genet. 2021. PMID: 33909459 Free PMC article. Review.
References
Publication types
MeSH terms
Grants and funding
LinkOut - more resources
Full Text Sources

