

Monitoring of Heart Rate from Photoplethysmographic Signals Using a Samsung Galaxy Note8 in Underwater Environments
- PMID: 31248022
- PMCID: PMC6651860
- DOI: 10.3390/s19132846
Monitoring of Heart Rate from Photoplethysmographic Signals Using a Samsung Galaxy Note8 in Underwater Environments
Abstract
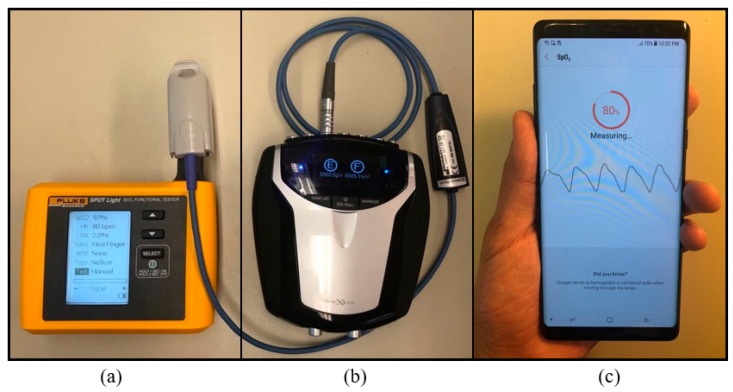
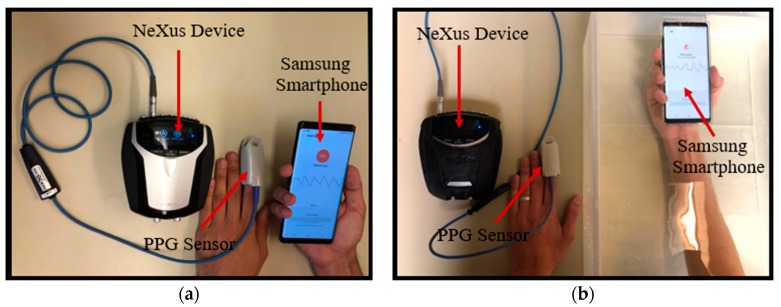
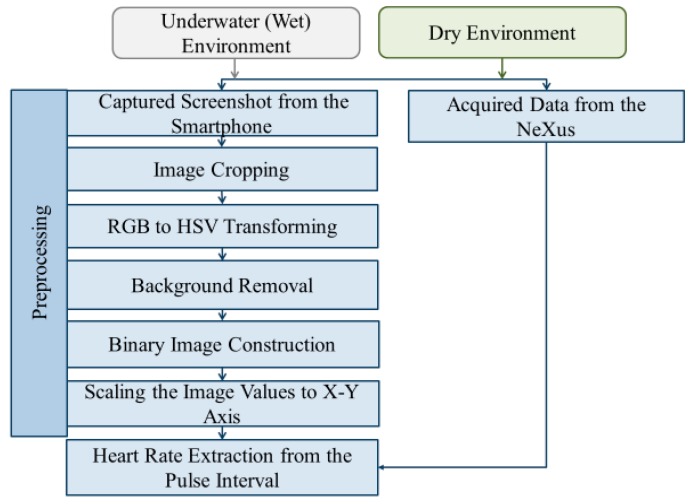
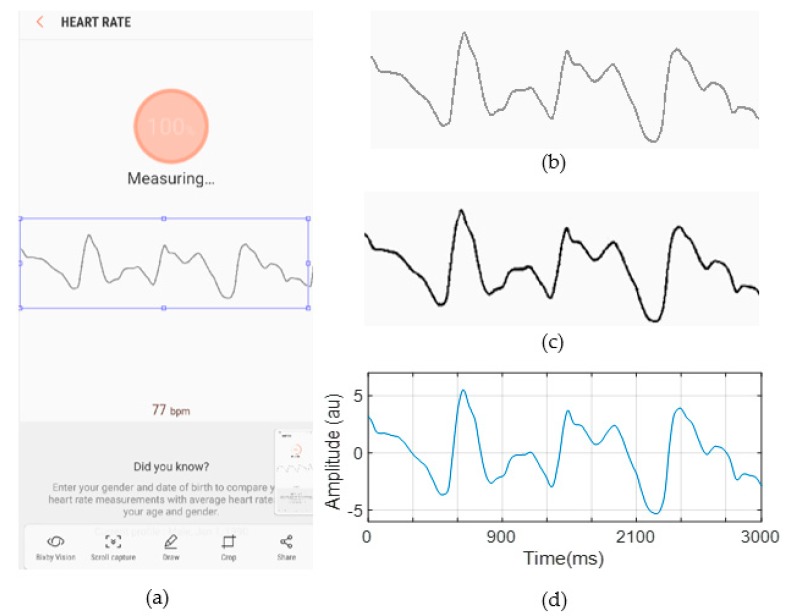
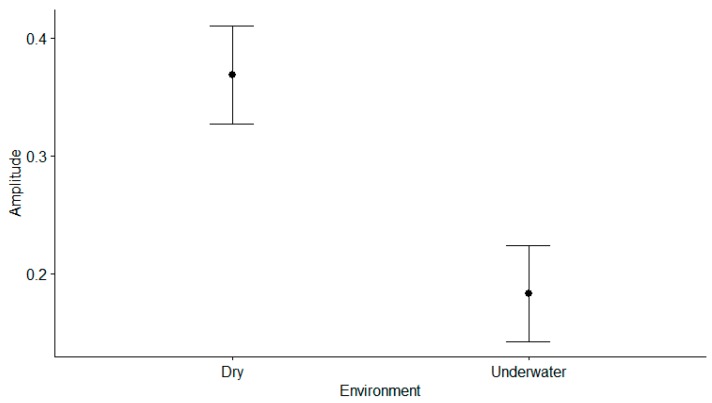
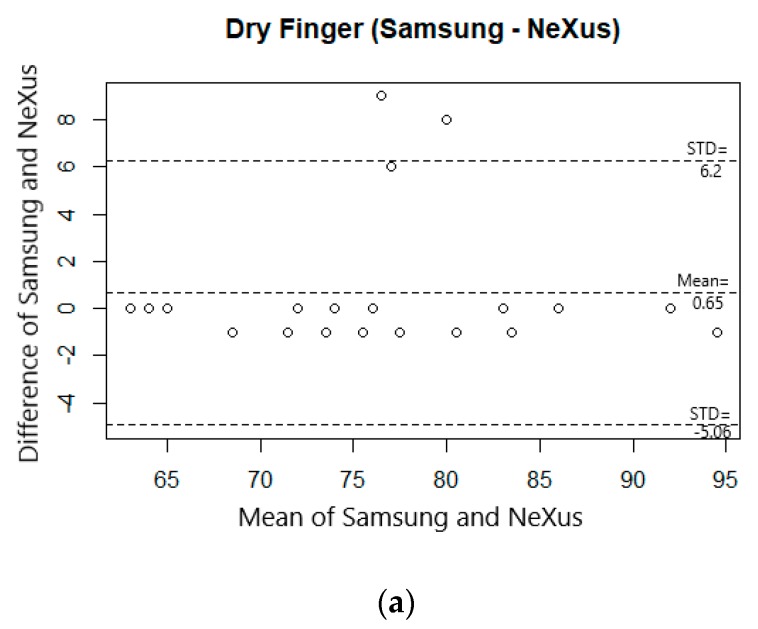
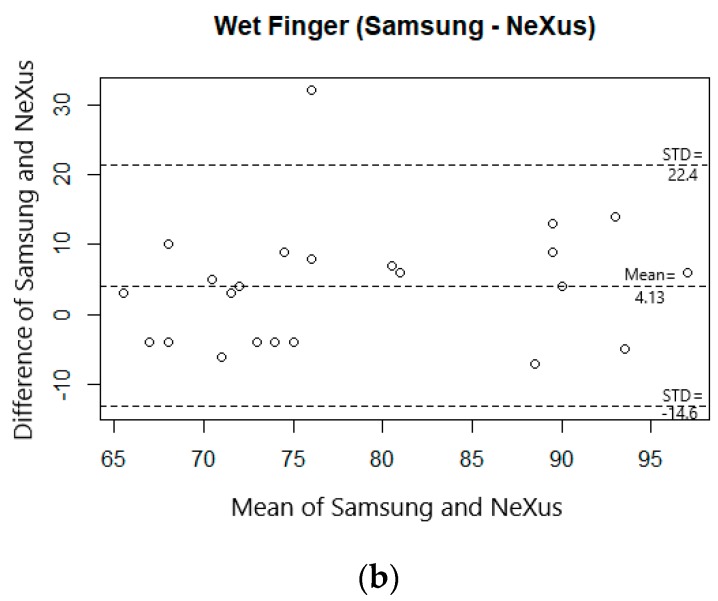
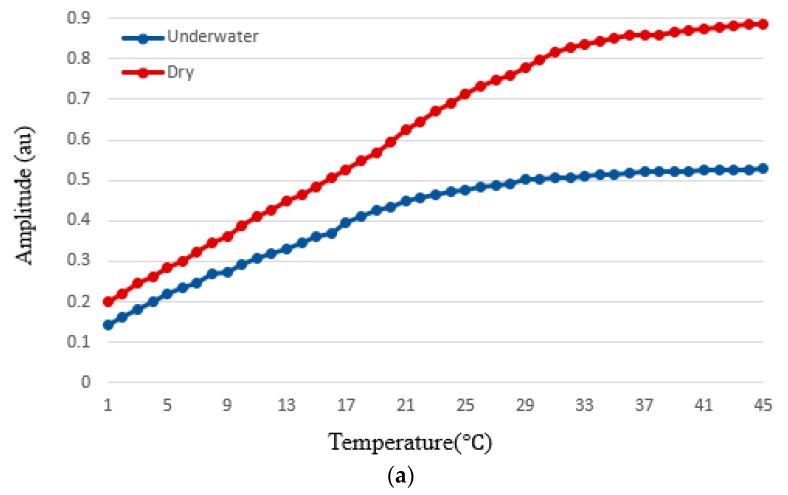
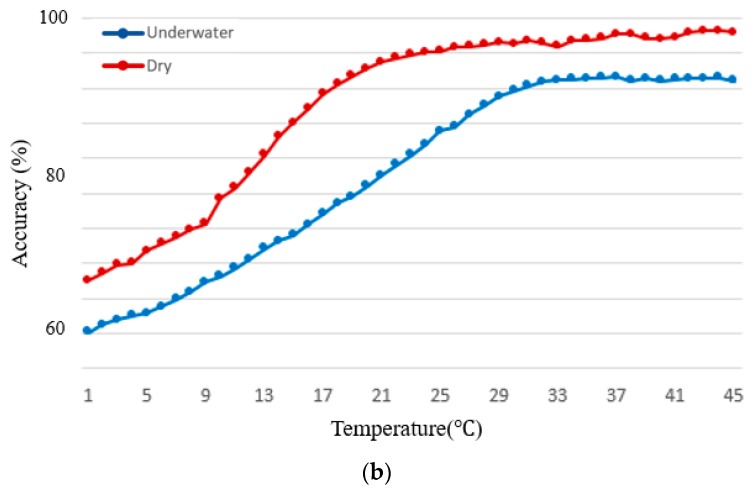
Photoplethysmography (PPG) is a commonly used in determining heart rate and oxygen saturation (SpO2). However, PPG measurements and its accuracy are heavily affected by the measurement procedure and environmental factors such as light, temperature, and medium. In this paper, we analyzed the effects of different mediums (water vs. air) and temperature on the PPG signal quality and heart rate estimation. To evaluate the accuracy, we compared our measurement output with a gold-standard PPG device (NeXus-10 MKII). The experimental results show that the average PPG signal amplitude values of the underwater environment decreased considerably (22% decrease) compared to PPG signals of dry environments, and the heart rate measurement deviated 7% (5 beats per minute on average. The experimental results also show that the signal to noise ratio (SNR) and signal amplitude decrease as temperature decreases. Paired t-test which compares amplitude and heart rate values between the underwater and dry environments was performed and the test results show statistically significant differences for both amplitude and heart rate values (p < 0.05). Moreover, experimental results indicate that decreasing the temperature from 45 °C to 5 °C or changing the medium from air to water decreases PPG signal quality, (e.g., PPG signal amplitude decreases from 0.560 to 0.112). The heart rate is estimated within 5.06 bpm deviation at 18 °C in underwater environment, while estimation accuracy decreases as temperature goes down.
Keywords: PPG; heart rate variability; photoplethysmography; temperature; underwater.
Conflict of interest statement
The authors declare no conflict of interest.
Figures
Similar articles
-
A novel and low-complexity peak detection algorithm for heart rate estimation from low-amplitude photoplethysmographic (PPG) signals.J Med Eng Technol. 2018 Nov;42(8):569-577. doi: 10.1080/03091902.2019.1572237. Epub 2019 Mar 28. J Med Eng Technol. 2018. PMID: 30920315
-
Spot measurement of heart rate based on morphology of PhotoPlethysmoGraphic (PPG) signals.J Med Eng Technol. 2017 Feb;41(2):87-96. doi: 10.1080/03091902.2016.1223198. Epub 2016 Sep 9. J Med Eng Technol. 2017. PMID: 27609492
-
Smartphone-based photoplethysmographic imaging for heart rate monitoring.J Med Eng Technol. 2017 Jul;41(5):387-395. doi: 10.1080/03091902.2017.1299233. Epub 2017 Mar 16. J Med Eng Technol. 2017. PMID: 28300460
-
The Principles of Hearable Photoplethysmography Analysis and Applications in Physiological Monitoring-A Review.Sensors (Basel). 2023 Jul 18;23(14):6484. doi: 10.3390/s23146484. Sensors (Basel). 2023. PMID: 37514778 Free PMC article. Review.
-
A Review of Wearable Multi-Wavelength Photoplethysmography.IEEE Rev Biomed Eng. 2023;16:136-151. doi: 10.1109/RBME.2021.3121476. Epub 2023 Jan 5. IEEE Rev Biomed Eng. 2023. PMID: 34669577 Review.
Cited by
-
Recent Advances in Materials and Flexible Sensors for Arrhythmia Detection.Materials (Basel). 2022 Jan 18;15(3):724. doi: 10.3390/ma15030724. Materials (Basel). 2022. PMID: 35160670 Free PMC article. Review.
-
An automated heart rate-based algorithm for sleep stage classification: Validation using conventional polysomnography and an innovative wearable electrocardiogram device.Front Neurosci. 2022 Oct 6;16:974192. doi: 10.3389/fnins.2022.974192. eCollection 2022. Front Neurosci. 2022. PMID: 36278001 Free PMC article.
-
Skin-electrode iontronic interface for mechanosensing.Nat Commun. 2021 Aug 5;12(1):4731. doi: 10.1038/s41467-021-24946-4. Nat Commun. 2021. PMID: 34354053 Free PMC article.
-
Sources of Inaccuracy in Photoplethysmography for Continuous Cardiovascular Monitoring.Biosensors (Basel). 2021 Apr 16;11(4):126. doi: 10.3390/bios11040126. Biosensors (Basel). 2021. PMID: 33923469 Free PMC article. Review.
-
Video-based sympathetic arousal assessment via peripheral blood flow estimation.Biomed Opt Express. 2023 Nov 30;14(12):6607-6628. doi: 10.1364/BOE.507949. eCollection 2023 Dec 1. Biomed Opt Express. 2023. PMID: 38420320 Free PMC article.
References
-
- World Heath Organization (WHO) [(accessed on 22 September 2018)];Cardiovascular Diseases (CVDs) Available online: https://www.who.int/cardiovascular_diseases/en/
-
- Mozaffarian D., Benjamin E.J., Go A.S., Arnett D.K., Blaha M.J., Cushman M., de Ferranti S., Despres J.P., Fullerton H.J., Howard V.J., et al. Heart disease and stroke statistics—2015 update: A report from the American Heart Association. Circulation. 2015;131:e29–e322. doi: 10.1161/CIR.0000000000000152. - DOI - PubMed
-
- Sardana M., Saczynski J., Esa N., Floyd K., Chon K., Chong J.W., McManus D. Performance and usability of a novel smartphone application for atrial fibrillation detection in an ambulatory population referred for cardiac monitoring. J. Am. Coll. Cardiol. 2016;67:844. doi: 10.1016/S0735-1097(16)30845-2. - DOI
MeSH terms
Grants and funding
LinkOut - more resources
Full Text Sources
