Review
. 2019 Jun 19;17(6):364.
doi: 10.3390/md17060364.

Marine Natural Products from Indonesian Waters

Affiliations
Review

Marine Natural Products from Indonesian Waters

Novriyandi Hanif et al. Mar Drugs. .

Abstract

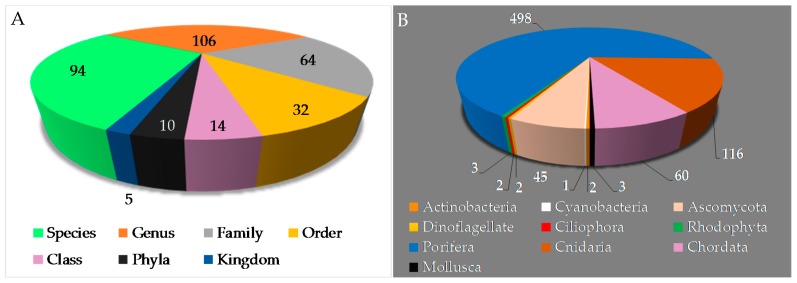
Natural products are primal and have been a driver in the evolution of organic chemistry and ultimately in science. The chemical structures obtained from marine organisms are diverse, reflecting biodiversity of genes, species and ecosystems. Biodiversity is an extraordinary feature of life and provides benefits to humanity while promoting the importance of environment conservation. This review covers the literature on marine natural products (MNPs) discovered in Indonesian waters published from January 1970 to December 2017, and includes 732 original MNPs, 4 structures isolated for the first time but known to be synthetic entities, 34 structural revisions, 9 artifacts, and 4 proposed MNPs. Indonesian MNPs were found in 270 papers from 94 species, 106 genera, 64 families, 32 orders, 14 classes, 10 phyla, and 5 kingdoms. The emphasis is placed on the structures of organic molecules (original and revised), relevant biological activities, structure elucidation, chemical ecology aspects, biosynthesis, and bioorganic studies. Through the synthesis of past and future data, huge and partly undescribed biodiversity of marine tropical invertebrates and their importance for crucial societal benefits should greatly be appreciated.

Keywords: biodiversity; biogeography; bioorganic chemistry; biosynthesis; chemical synthesis; cytotoxicity; enzyme inhibitor; structural revision; structure elucidation.


Conflict of interest statement

The authors declare no conflict of interest.

Figures

Figure 1
Figure 1
Map of Indonesia and its 34 provinces [15]: SRA (Special Region of Aceh), NST (North Sumatra), RAU (Riau), RUI (Riau Islands), WST (West Sumatra), JMI (Jambi), BKU (Bengkulu), SST (South Sumatra), BBI (Bangka–Belitung Islands), LPG (Lampung), BTN (Banten), JSCR (Jakarta Special Capital Region), WJV (West Java), CJV (Central Java), SRY (Special Region of Yogyakarta), EJV (East Java), BLI (Bali), WNT (West Nusa Tenggara), ENT (East Nusa Tenggara), WKM (West Kalimantan), CKM (Central Kalimantan), EKM (East Kalimantan), SKM (South Kalimantan), NKM (North Kalimantan), NSW (North Sulawesi), GTO (Gorontalo), WSW (West Sulawesi), CSW (Central Sulawesi), SSW (South Sulawesi), SES (Southeast Sulawesi), NMU (North Maluku), MLU (Maluku), SRWP (Special Region of West Papua), and PUA (Papua).
Figure 2
Figure 2
Structure of (–)-25-hydroxy-24ξ-methylcholesterol 1.
Figure 3
Figure 3
Statistics of new Indonesian MNPs from January 1970 to December 2017 (A). Distribution of new MNPs on the basis of their publication per year (B) and journal titles (C).
Figure 4
Figure 4
Distribution of new Indonesian MNPs on the basis of chemical skeletons (A), classes (B), chemical types (C), and atomic diversities (D).
Figure 4
Figure 4
Distribution of new Indonesian MNPs on the basis of chemical skeletons (A), classes (B), chemical types (C), and atomic diversities (D).
Figure 5
Figure 5
Distribution of new Indonesian MNPs on the basis of biological sources (A,B).
Figure 6
Figure 6
Distribution of new Indonesian MNPs on the basis of biological sources and a list of species of Indonesian marine organisms reported to contain new MNPs. Unknown unknown is an unidentified species from certain phyla.
Figure 7
Figure 7
Distribution of new Indonesian MNPs on the basis of their significant biological activity.
Figure 8
Figure 8
Distribution of new Indonesian MNPs on the basis of their biogeography hotspots (A,B) (OPV other provinces).
Figure 9
Figure 9
Structures of marine sesquiterpenoids from Indonesian waters found in 1970–2017 (A): representative. Distribution of new marine sesquiterpenoids by year (B). Statistics of new marine sesquiterpenoids (C). Distribution of new marine sesquiterpenoids on the basis of their skeletons (D,E), biological sources (F), and biogeography (G).
Figure 9
Figure 9
Structures of marine sesquiterpenoids from Indonesian waters found in 1970–2017 (A): representative. Distribution of new marine sesquiterpenoids by year (B). Statistics of new marine sesquiterpenoids (C). Distribution of new marine sesquiterpenoids on the basis of their skeletons (D,E), biological sources (F), and biogeography (G).
Figure 10
Figure 10
Plausible biosynthetic pathway of (+)-africanol 35.
Figure 11
Figure 11
Structures of marine diterpenoids from Indonesian waters found in 1970–2017 (A): representative. Distribution of new marine diterpenoids by year (B). Statistics of new marine diterpenoids (C). Distribution of new marine diterpenoids on the basis of their skeletons (D,F), significant biological activity (E), biological sources (G), and biogeography (H).
Figure 11
Figure 11
Structures of marine diterpenoids from Indonesian waters found in 1970–2017 (A): representative. Distribution of new marine diterpenoids by year (B). Statistics of new marine diterpenoids (C). Distribution of new marine diterpenoids on the basis of their skeletons (D,F), significant biological activity (E), biological sources (G), and biogeography (H).
Figure 12
Figure 12
Structures of marine sesterterpenoids from Indonesian waters found in 1970–2017: (A) representative. Distribution of new marine sesterterpenoids by year (B). Statistics of new marine sesterterpenoids (C). Distribution of new marine sesterterpenoids on the basis of their skeletons (D), biological sources (E), and biogeography (F).
Figure 12
Figure 12
Structures of marine sesterterpenoids from Indonesian waters found in 1970–2017: (A) representative. Distribution of new marine sesterterpenoids by year (B). Statistics of new marine sesterterpenoids (C). Distribution of new marine sesterterpenoids on the basis of their skeletons (D), biological sources (E), and biogeography (F).
Figure 13
Figure 13
Structures of marine triterpenoids from Indonesian waters found in 1970–2017: (A) representative. Distribution of new marine triterpenoids by year (B). Statistics of new marine triterpenoids (C). Distribution of new marine triterpenoids on the basis of their skeletons (D), biological sources (E), and biogeography (F).
Figure 13
Figure 13
Structures of marine triterpenoids from Indonesian waters found in 1970–2017: (A) representative. Distribution of new marine triterpenoids by year (B). Statistics of new marine triterpenoids (C). Distribution of new marine triterpenoids on the basis of their skeletons (D), biological sources (E), and biogeography (F).
Figure 14
Figure 14
Plausible biosynthetic pathway of (–)-vannusals A 198b and B 199b.
Figure 15
Figure 15
Structures of marine steroids from Indonesian waters found in 1970–2017: (A) representative. Distribution of new marine steroids by year (B). Statistics of new marine steroids (C). Distribution of new marine steroids on the basis of their skeletons (D,E), biological sources (F), significant biological activity (G), and biogeography (H).
Figure 15
Figure 15
Structures of marine steroids from Indonesian waters found in 1970–2017: (A) representative. Distribution of new marine steroids by year (B). Statistics of new marine steroids (C). Distribution of new marine steroids on the basis of their skeletons (D,E), biological sources (F), significant biological activity (G), and biogeography (H).
Figure 16
Figure 16
Structures of marine saponins from Indonesian waters found in 1970–2017: (A) representative.
Figure 17
Figure 17
Structures of marine meroterpenoids from Indonesian waters found in 1970–2017: (A) representative. Distribution of new marine meroterpenoids by year (B). Statistics of new marine meroterpenoids (C). Distribution of new marine meroterpenoids on the basis of their skeletons (D,E), biological sources (F), significant biological activity (G), and biogeography (H).
Figure 17
Figure 17
Structures of marine meroterpenoids from Indonesian waters found in 1970–2017: (A) representative. Distribution of new marine meroterpenoids by year (B). Statistics of new marine meroterpenoids (C). Distribution of new marine meroterpenoids on the basis of their skeletons (D,E), biological sources (F), significant biological activity (G), and biogeography (H).
Figure 18
Figure 18
Structures of marine piperidine alkaloids from Indonesian waters found in 1970–2017: (A) representative. Distribution of new marine piperidines by year (B). Statistics of new marine piperidines (C). Distribution of new marine piperidine molecules on the basis of their skeletons (D), significant biological activity (E), biological sources (F), and biogeography (G).
Figure 18
Figure 18
Structures of marine piperidine alkaloids from Indonesian waters found in 1970–2017: (A) representative. Distribution of new marine piperidines by year (B). Statistics of new marine piperidines (C). Distribution of new marine piperidine molecules on the basis of their skeletons (D), significant biological activity (E), biological sources (F), and biogeography (G).
Figure 19
Figure 19
Plausible biosynthetic pathway of (–)-manadomanzamines A 318, B 319.
Figure 20
Figure 20
Structures of marine pyridine alkaloids from Indonesian waters found in 1970–2017: (A) representative. Distribution of new alkaloids by year (B). Statistics of new marine pyridine molecules (C). Distribution of new marine pyridine molecules on the basis of biological sources (D), and biogeography (E).
Figure 21
Figure 21
Structures of marine indole alkaloids from Indonesian waters found in 1970–2017: (A) representative. Distribution of new marine indole alkaloids by year (B). Statistics of new marine indole alkaloids (C). Distribution of new marine indole alkaloids, biological activity (D), biological sources (E), and biogeography (F).
Figure 22
Figure 22
Structures of marine acridine alkaloids from Indonesian waters found in 1970–2017: (A) representative. Distribution of new marine acridine alkaloids by year (B). Statistics of new marine acridine molecules (C). Distribution of new marine acridine-containing molecules on the basis of their biological sources (D), and biogeography (E).
Figure 23
Figure 23
Biomimetic synthesis of styelsamine B (379) from kynuramine (379-I) and N-acetyl dopamine (379-II).
Figure 24
Figure 24
Structures of marine quinoline or isoquinoline alkaloids from Indonesian waters found in 1970–2017: (A) representative. Distribution of the alkaloids by year (B). Statistics of new marine quinoline or isoquinoline alkaloids (C). Distribution of new marine quinoline and isoquinoline alkaloids on the basis of their biological activity (D), biological sources (E), and biogeography (F).
Figure 25
Figure 25
Structures of marine tyrosine alkaloids from Indonesian waters in 1970–2017: (A) representative. Distribution of the alkaloids by year (B). Statistics of new tyrosine alkaloids (C). Distribution of new marine tyrosine-containing alkaloids on the basis of their, biological activity (D), biological sources (E), and biogeography (F).
Figure 26
Figure 26
Structures of marine pyrrole alkaloids from Indonesian waters found in 1970–2017: (A) representative. Distribution of the alkaloids by year (B). Statistics of new pyrrole alkaloids (C). Distribution of new marine pyrrole-containing alkaloids on the basis of their, biological activity (D), biological sources (E), and biogeography (F).
Figure 26
Figure 26
Structures of marine pyrrole alkaloids from Indonesian waters found in 1970–2017: (A) representative. Distribution of the alkaloids by year (B). Statistics of new pyrrole alkaloids (C). Distribution of new marine pyrrole-containing alkaloids on the basis of their, biological activity (D), biological sources (E), and biogeography (F).
Figure 27
Figure 27
The plausible biosynthetic pathway of latonduines A 450, B 451d, and (Z)-3-bromohymenialdisine 441.
Figure 28
Figure 28
Structures of marine imidazole alkaloids from Indonesian waters found in 1970–2017: (A) representative. Distribution of the alkaloids by year (B). Statistics of imidazole alkaloids (C). Distribution of new marine imidazole alkaloids on the basis of their chemical skeletons (D), biological sources (E), and biogeography (F).
Figure 29
Figure 29
The plausible biosynthetic pathway of lissodendrins A 483 and B 484.
Figure 30
Figure 30
Structures of marine polysulfur aromatic alkaloids from Indonesian waters found in 1970–2017: (A) representative. Distribution of the alkaloids by year (B). Statistics of polysulfur aromatic alkaloids (C). Distribution of new marine polysulfur aromatic-containing alkaloids on the basis of their biological activity (D).
Figure 31
Figure 31
Structures of marine serine-containing alkaloids from Indonesian waters found in 1970–2017: (A) representative. Distribution of the alkaloids by year (B). Statistics of the alkaloids (C). Distribution of marine serine-containing alkaloids on the basis of their chemical skeleton (D), biological source (E), and biogeography (F).
Figure 31
Figure 31
Structures of marine serine-containing alkaloids from Indonesian waters found in 1970–2017: (A) representative. Distribution of the alkaloids by year (B). Statistics of the alkaloids (C). Distribution of marine serine-containing alkaloids on the basis of their chemical skeleton (D), biological source (E), and biogeography (F).
Figure 32
Figure 32
Structures of other marine alkaloids from Indonesian waters found in 1970–2017: (A) representative. Distribution of other marine alkaloids by year (B). Statistics of other marine alkaloids (C). Distribution of other marine alkaloids on the basis of biological activity (D), biological source (E), and biogeography (F).
Figure 32
Figure 32
Structures of other marine alkaloids from Indonesian waters found in 1970–2017: (A) representative. Distribution of other marine alkaloids by year (B). Statistics of other marine alkaloids (C). Distribution of other marine alkaloids on the basis of biological activity (D), biological source (E), and biogeography (F).
Figure 33
Figure 33
Plausible biosynthetic relation of polycarpathiamines A 544 and B 545.
Figure 34
Figure 34
Structures of marine peptides from Indonesian waters found in 1970–2017: (A) representative. Distribution of marine peptides by year (B). Statistics of marine peptides (C). Distribution of marine peptides on the basis of biological activity (D), biological source (E), and biogeography (F).
Figure 34
Figure 34
Structures of marine peptides from Indonesian waters found in 1970–2017: (A) representative. Distribution of marine peptides by year (B). Statistics of marine peptides (C). Distribution of marine peptides on the basis of biological activity (D), biological source (E), and biogeography (F).
Figure 35
Figure 35
Structures of fatty acids and linear molecules from Indonesian waters found in 1970–2017: (A) representative. Distribution of this group of metabolites by year (B). Distribution of marine fatty acid on the basis of their biological activity (C), biological source (D), and biogeography (E).
Figure 36
Figure 36
Structures of marine polyketides from Indonesian waters found in 1970–2017: (A) representative. Distribution of marine polyketides by year (B). Statistics of marine polyketides (C). Distribution of marine polyketide on the basis of their biological activity (D), biological source (E), and biogeography (F).
Figure 36
Figure 36
Structures of marine polyketides from Indonesian waters found in 1970–2017: (A) representative. Distribution of marine polyketides by year (B). Statistics of marine polyketides (C). Distribution of marine polyketide on the basis of their biological activity (D), biological source (E), and biogeography (F).
Figure 37
Figure 37
Structures of marine carbohydrates from Indonesian waters in 1970–2017.

Similar articles

Cited by

References

    1. Nicolau K.C., Montagnon T. Molecules that Changed the World. Willey-VCH; Weinheim, Germany: 2008. pp. 9–319.
    1. Hoffmann R.W. Classical Methods in Structure Elucidation of Natural Products. Willey-VCHA; Zürich, Switzerland: 2018. pp. 1–259.
    1. Blunt J., Buckingham J., Munro M. Taxonomy and Marine Natural Products Research. In: Fattorusso E., Gerwick W.H., Tagliatela-Scafati O., editors. Handbook of Marine Natural Products. Volume 1. Springer; New York, NY, USA: 2012. pp. 3–54.
    1. Pimm S.L., Jenkins C.N., Abell R., Brooks T.M., Gittleman J.L., Joppa L.N., Raven P.H., Roberts C.M., Sexton J.O. The biodiversity of species and their rates of extinction, distribution, and protection. Science. 2014;344:988–998. doi: 10.1126/science.1246752. - DOI - PubMed
    1. Appeltans W., Ahyong A.T., Anderson G., Angel M.V., Artois T., Baily N., Bamber R., Barber A., Bartsch I., Berta A., et al. The magnitude of global marine species diversity. Curr. Biol. 2012;22:2189–2202. doi: 10.1016/j.cub.2012.09.036. - DOI - PubMed

Substances

LinkOut - more resources