. 2019 Aug 21;103(4):598-616.e7.
doi: 10.1016/j.neuron.2019.05.039. Epub 2019 Jun 24.

Deep Sequencing of Somatosensory Neurons Reveals Molecular Determinants of Intrinsic Physiological Properties

Affiliations

Deep Sequencing of Somatosensory Neurons Reveals Molecular Determinants of Intrinsic Physiological Properties

Yang Zheng et al. Neuron. .

Abstract

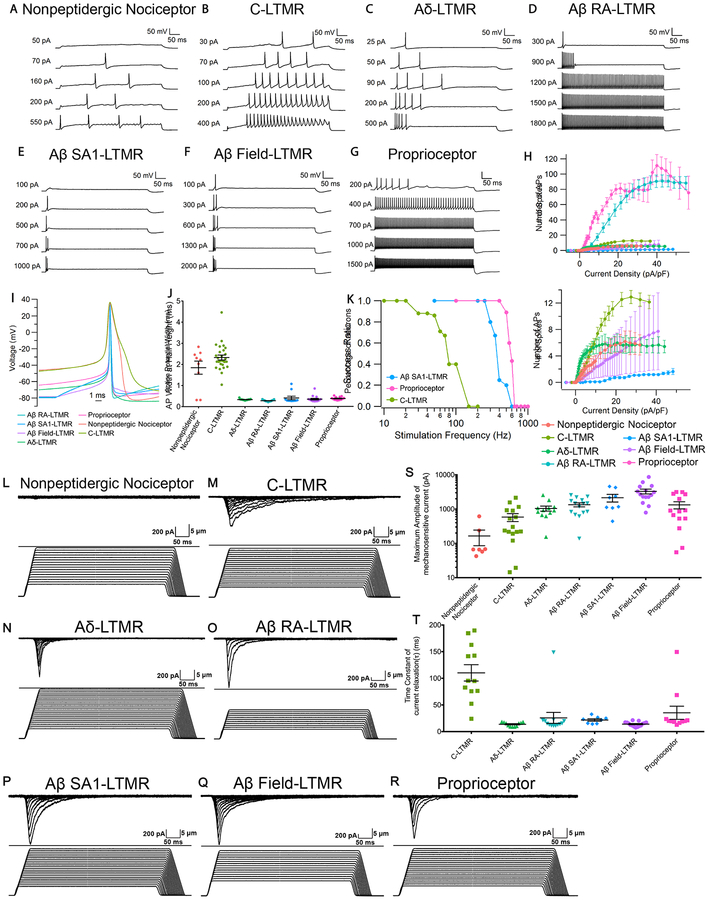
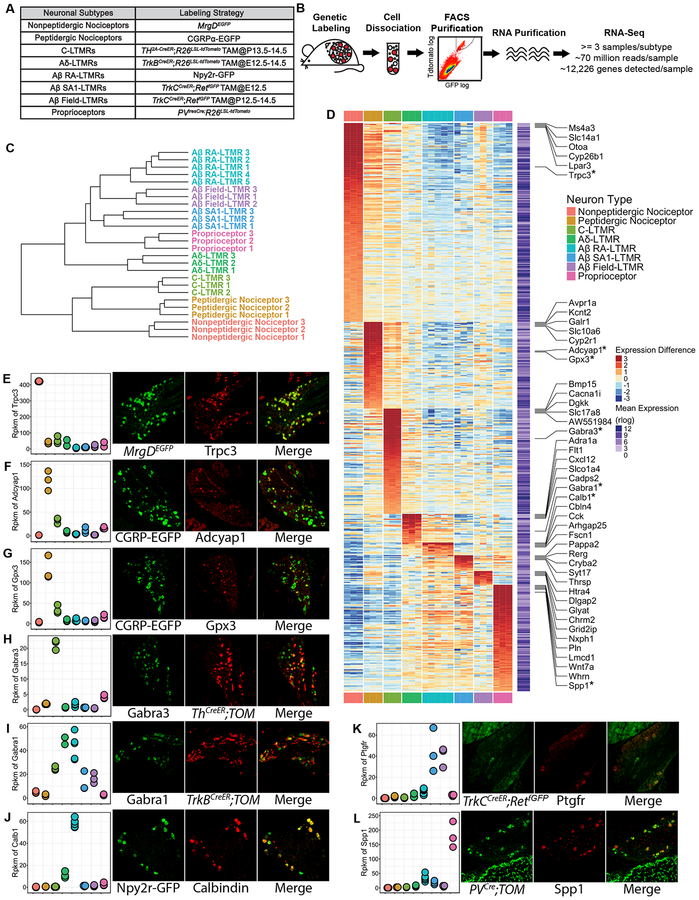
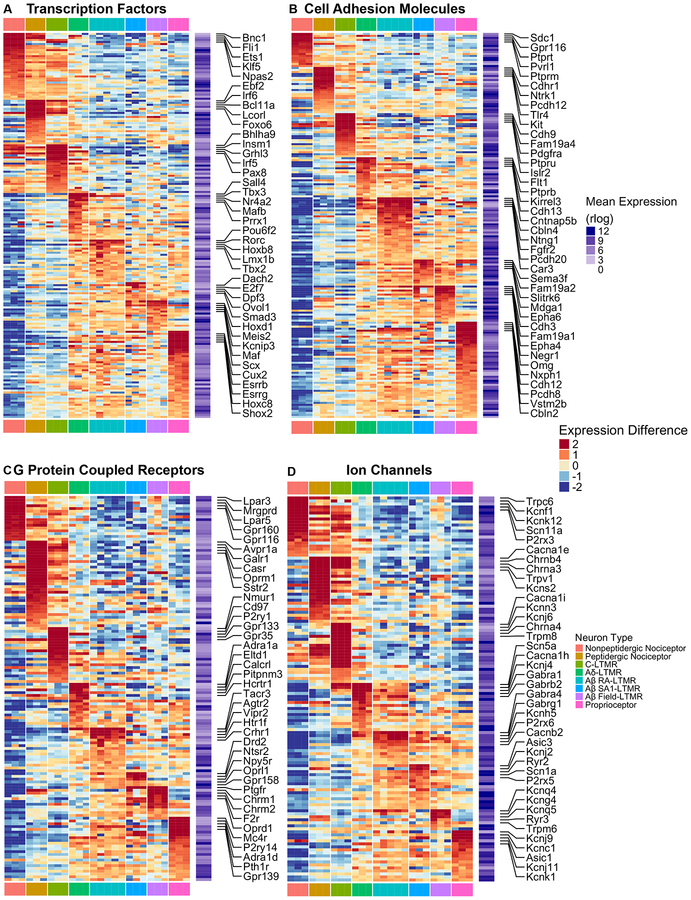
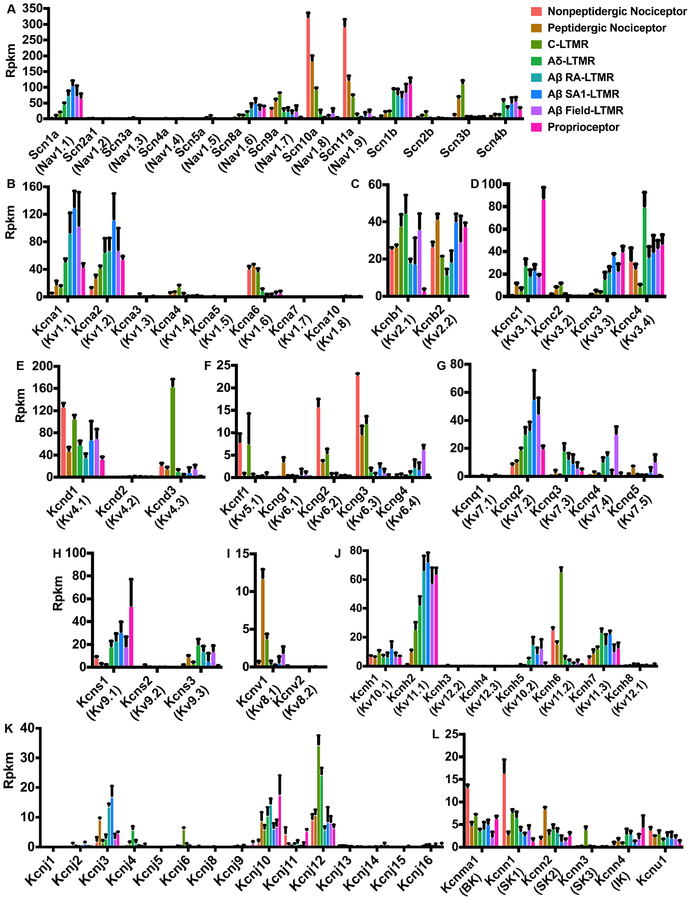
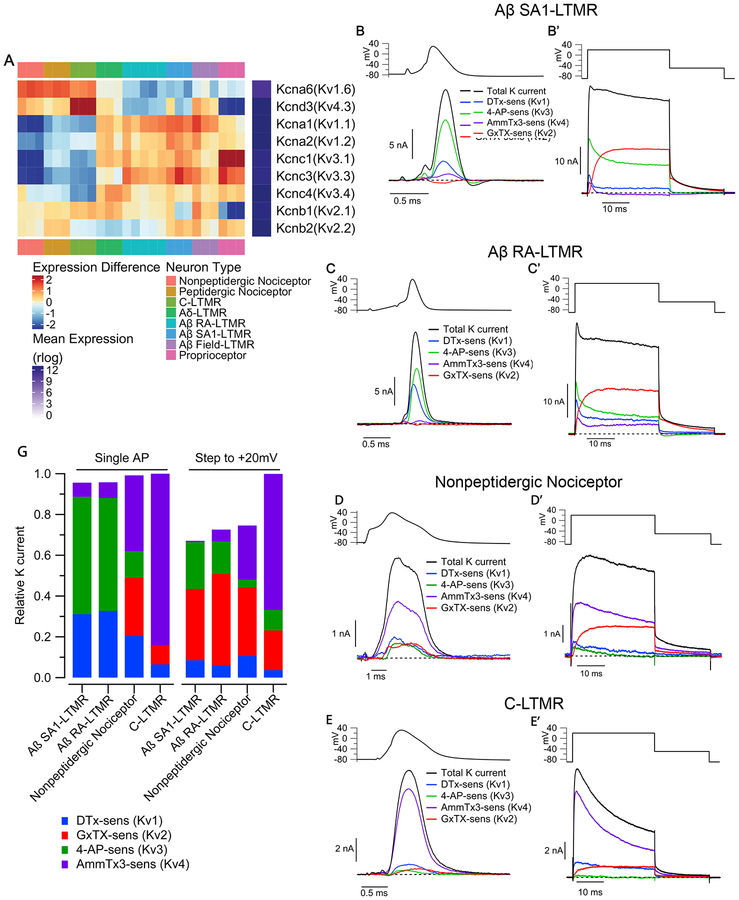
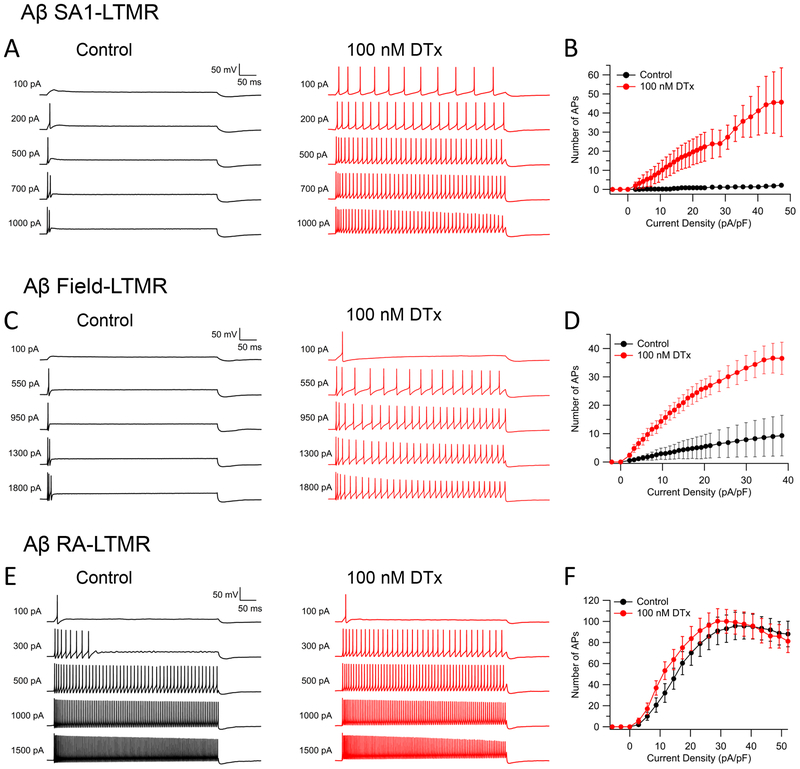
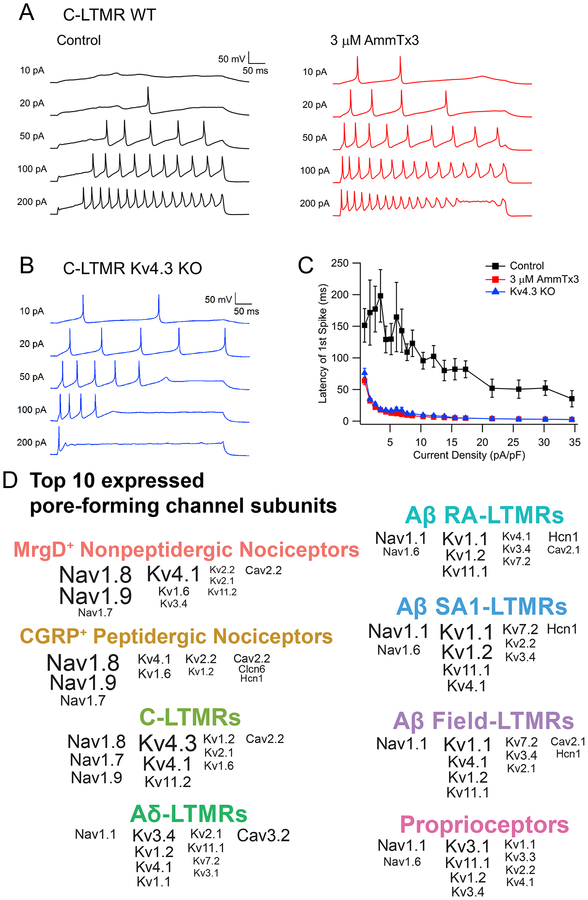
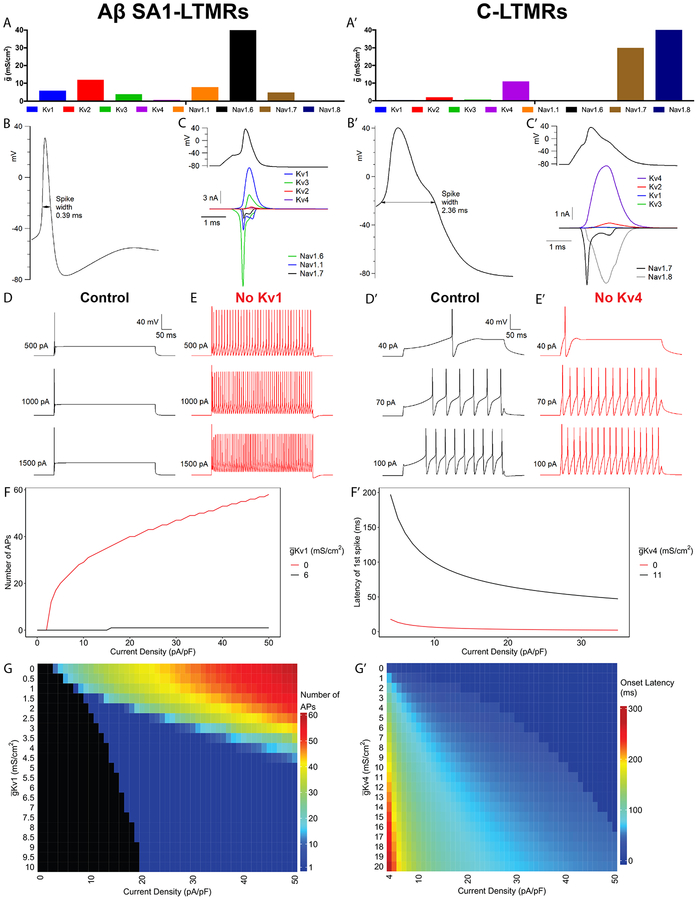
Dorsal root ganglion (DRG) sensory neuron subtypes defined by their in vivo properties display distinct intrinsic electrical properties. We used bulk RNA sequencing of genetically labeled neurons and electrophysiological analyses to define ion channel contributions to the intrinsic electrical properties of DRG neuron subtypes. The transcriptome profiles of eight DRG neuron subtypes revealed differentially expressed and functionally relevant genes, including voltage-gated ion channels. Guided by these data, electrophysiological analyses using pharmacological and genetic manipulations as well as computational modeling of DRG neuron subtypes were undertaken to assess the functions of select voltage-gated potassium channels (Kv1, Kv2, Kv3, and Kv4) in shaping action potential (AP) waveforms and firing patterns. Our findings show that the transcriptome profiles have predictive value for defining ion channel contributions to sensory neuron subtype-specific intrinsic physiological properties. The distinct ensembles of voltage-gated ion channels predicted to underlie the unique intrinsic physiological properties of eight DRG neuron subtypes are presented.

Keywords: DRG; RNA sequencing; genetic labeling; intrinsic membrane properties; mechanosensory neuron; somatosensation; transcriptome profile; voltage-gated ion channels.


Conflict of interest statement

Declaration of Interest

The authors declare no competing interests.

Figures

Figure 1.
Figure 1.. Distinct intrinsic physiological properties and mechanosensitivity of eight major DRG sensory neuron subtypes
(A-G) Representative in vitro spiking patterns of DRG neuron subtypes during 500-ms injections of depolarizing current steps of increasing magnitude. (H) Number of APs during 500-ms current injections for each subtype (mean ± standard error of the mean (SEM)) plotted against current density, with expanded y-axis shown in the bottom panel. N=9 for MrgD+ nonpeptidergic nociceptors; n=28 for C-LTMRs; n=19 for Aδ-LTMRs; n=25 for Aβ RA-LTMRs; n=11 for Aβ SA1-LTMRs; n=16 for Aβ Field-LTMRs; n=14 for proprioceptors. (I) Representative AP waveforms of DRG neuron subtype (first AP evoked by 500-ms current injection at or near threshold). (J) AP widths (measured at half-maximal spike amplitude) of DRG neuron subtypes (mean ± SEM, n’s as in H). One-way ANOVA with Tukey’s multiple comparisons test showed that MrgD+ nonpeptidergic nociceptors and C-LTMRs are different from each other (p=0.036) and from all other subtypes (p<0.001). (K) Survival plot depicting the percentages of C-LTMRs (n=8), Aβ SA1-LTMRs (n=5) and proprioceptors (n=9) whose repetitive firing successfully followed 250 μs pulse stimulation at the indicated frequencies. (L-R) Representative traces of Imech during 500-ms step displacements of increasing magnitudes for each DRG neuron subtype. (S) Maximal amplitudes of Imech for each DRG neuron subtypes (mean ± SEM). The maximal amplitudes of Imech are significantly different (p<0.0001). In particular, maximal amplitudes of Imech measured in MrgD+ nonpeptidergic nociceptors are significantly smaller than those measured in Aβ RA-LTMRs (p=0.0072), Aβ SA1-LTMRs (p=0.0014) and Aβ Field-LTMRs (p<0.0001) and proprioceptors (p=0.0345). Kruskal-Wallis test with multiple comparisons of every subtype against MrgD+ nonpeptidergic nociceptors. Imech measured in MrgD+ nonpeptidergic nociceptors is not significantly different from 100pA, which is the noise level (p=0.4450), while Imech measured in five LTMRs and proprioceptors are (p<0.01). One-sample t-test. n=7 for MrgD+ nonpeptidergic nociceptors; n=16 for C-LTMRs; n=12 for Aδ-LTMRs; n=15 for Aβ RA-LTMRs; n=8 for Aβ SA1-LTMRs; n=15 for Aβ Field-LTMRs and n=14 for proprioceptors. (T) Time constant (t) of Imech relaxation kinetics for each DRG neuron subtype. Group mean and SEM are shown using error bars. τ of Imech are significantly different among subtypes (p<0.0001). In particular, τ in C-LTMRs are significantly larger than those in Aδ-LTMRs (p<0.0001), Aβ RA-LTMRs (p=0.0006), and Aβ Field-LTMRs (p<0.0001), suggesting Imech in C-LTMRs decays slower. Kruskal-Wallis test with Dunn’s multiple comparisons test. n=12 for C-LTMRs; n=11 for Aδ-LTMRs; n=13 for Aβ RA-LTMRs; n=8 for Aβ SA1-LTMRs; n=15 for Aβ Field-LTMRs and n=11 for proprioceptors. See also Figure S1.
Figure 2.
Figure 2.. Transcriptome profiling of eight major DRG neuron subtypes
(A) Genetic toolbox for labeling each of the eight DRG neuron subtypes. (B) Schematic of the RNA-sequencing workflow. (C) Hierarchical clustering of samples based on the expression (represented in rlog transformed count values) of the top 1000 genes that display the highest expression variance across samples using Euclidean distance. (D) Heatmap depicting expression patterns of SUEGs. Expression (represented in rlog transformed count values) differences compared to the average expression levels for each gene are plotted in the main heatmap. Average expression level of a gene was calculated by averaging expression across all samples and is plotted in a second heatmap next to the main heatmap. Only highly expressed genes (average expression levels in the upper 75th percentile) were selected for this analysis. Genes are ordered based on the subtype in which expression is enriched, and their degree of enrichment. The top 5 most enriched genes for each of the neuronal subtypes are labeled. Genes whose expression were further tested with experiments as shown in (E-L) are labeled and marked with an asterisk. (E-L) Left-most panels: Dotplots depicting expression levels of selected genes across subtypes in rpkm (reads per kilobase per million reads) values. Three right panels: Representative images of double immunostaining (E, H, I, J) or in situ hybridization (F, G, K, L) of fluorescent reporters and select genes using DRG sections from genetically labeled mice. Sensory neuron subtype reporters and tested genes are shown in separate channels, and the degree of overlap between the two is shown in the merged images. n=3 mice for (E-K), n=2 mice for L. See STAR Methods for details.
Figure 3.
Figure 3.. Functionally relevant genes are differentially expressed across DRG sensory neuron subtypes
(A-D) Heatmaps depicting expression patterns for genes encoding transcription factors and transcriptional regulators (A), cell adhesion molecules (B), G protein-coupled receptors (C), and ion channels (D). Plotting scheme, calculation for average expression and expression deviation from average are the same as in Figure 2D. Only genes that are both highly expressed (average expression in the upper 75th percentile) and highly variable (at least three samples have an expression deviation from average larger than 1) were included in the heatmaps. See STAR Methods for details.
Figure 4.
Figure 4.. Expression patterns of genes encoding Nav and Kv channel subunits
(A-L) Bar plots depicting expression patterns of genes encoding Nav channel α and β subunits (A), Kv1 subunits (B), Kv2 subunits (C), Kv3 subunits (D), Kv4 subunits (E), Kv5 and Kv6 subunits (F), Kv7 subunits (G), Kv8 subunits (I), Kv9 subunits (H), Kv10 subunits (J), inward-rectifier potassium channel subunits (Kir, IRK) (K) and calcium-activated potassium channel α subunits (L). Data are reported as mean ± standard deviation (SD).
Figure 5.
Figure 5.. Kv channel families differentially contribute to outward current in sensory neuron subtypes
(A) Heatmap depicting expression patterns of the most abundantly expressed Kv1, Kv2, Kv3 and Kv4 subunits. Plotting scheme is as Figure 2D. (B-E) Components of Kv current during the AP of sensory neuron subtypes. Currentwas evoked by AP waveforms (previously recorded in a different cell of each type), and components of current were isolated by sequential cumulative application of 100 nM α-Dendrotoxin (DTX), 100 μM 4-aminopyridine (4-AP), 3 μM AmmTx3, and 100 nM Guangxitoxin-1E (GxTX) to identify Kv1, Kv3, Kv4, and Kv2 currents, respectively. (B’-E’) Currents evoked by a step depolarization to +20 mV (30 ms), applied in parallel with the AP commands in the same cells as B-E. (F) Stacked bar plots showing the average fraction of total outward K+ current carried by Kv1, Kv2, Kv3, Kv4 channels in Aβ SA1-LTMRs (AP waveform: 31 ± 3% Kv1, 0 ± 1% Kv2, 59 ± 3% Kv3, 7 ± 1% Kv4; Step to +20 mV: 9 ± 2% Kv1, 35 ± 3% Kv2, 22 ± 3% Kv3, 1 ± 1% Kv4; n=15), Aβ RA-LTMRs (AP waveform: 33 ± 4% Kv1, 0 ± 2% Kv2, 58 ± 4% Kv3, 8 ± 2% Kv4; Step to +20 mV: 6 ± 3% Kv1, 45 ± 8% Kv2, 16 ± 7% Kv3, 6 ± 3% Kv4; n=11), MrgD+ nonpeptidergic nociceptors (AP waveform: 20 ± 4% Kv1, 29 ± 6% Kv2, 13 ± 3% Kv3, 37 ± 6% Kv4; Step to +20 mV: 11 ± 3% Kv1, 34 Kv4; n=11; mean ± SEM). Current contributions were quantified by integrating the currents during the AP or the 30ms step depolarization.
Figure 6.
Figure 6.. Blocking Kv1 channels dramatically increases repetitive spiking in Aβ SA1-LTMRs and Aβ Field-LTMRs but not in Aβ RA-LTMRs
(A, C, E) Representative voltage traces showing the effect of 100 nM α-DTX on spike patterns of an Aβ SA1-LTMR (A), an Aβ Field-LTMR (C), and an Aβ RA-LTMR (E) during 500-ms current injections. (B, D, F) Number of spikes during 500-ms current injections are plotted against injected current density before (black curve) and after (red curve) α-DTX for Aβ SA1-LTMRs (B, n=6), Aβ Field-LTMRs (D, n=13) and Aβ RA-LTMRs (F, n=15). Data are represented as mean ± SEM.
Figure 7.
Figure 7.. Kv4.3 underlies the delayed firing pattern of C-LTMRs
(A) Representative voltage traces showing the spike patterns of a C-LTMR during 500-ms sustained current injections before and after application of the Kv4 channel inhibitor AmmTx3. (B) Representative spike pattern from a C-LTMR neuron from a Kv4.3D mouse.(C) Plot depicting latencies of the first spike as a function of injected current density for wild-type C-LTMRs, before (black squares) and after (red squares) AmmTx3 application (n=8), and for C-LTMRs from Kv4.3D mice (blue triangles) (n=13). Data are represented as mean ± SEM. (D) Summary plot showing the ten most highly expressed voltage-gated ion channel α subunits in each sensory neuron subtype, ranked by rpkm value. The font size is proportional to the expression level in rpkm, but maxed out at rpkm=150.
Figure 8.
Figure 8.. Computational modeling suggests key roles of Kv1 and Kv4 in firing patterns of Aβ SA1-LTMRs and C-LTMRs
(A-A’) Maximum conductances () of each channel for Aβ SA1-LTMR (A) and C-LTMR (A’) models. (B, B’) Waveforms of the first AP in response to near threshold 500-ms sustained current injection in Aβ SA1-LTMR (450pA) (B) and C-LTMR (40pA) (B’) models. (C, C’) Current carried by each channel during the AP of Aβ SA1-LTMR (C) and C-LTMR (C’) models, using an AP waveform evoked by a 0.5-ms current injection. (D-E) Firing patterns of Aβ SA1-LTMR model neuron evoked by 500-ms sustained current injections with Kv1 (Kv1 = 6 mS/cm2) (D) or with Kv1 removed from the model (E). (F) Number of APs in the Aβ SA1-LTMR model as a function of injected current density (500-ms current injection) with Kv1 ( Kv1 = 6 mS/cm2; black trace) or with Kv1 removed (red trace). (G) Heatmap of the number of APs during 500 Kv1-ms current injections as a function of current density as well as Kv1. (D’-E’) Firing patterns of C-LTMR model evoked by 500-ms current injections with Kv4 (Kv4 = 11 mS/cm2) (D’) or with Kv4 removed (E’). (F’) Onset latency in current-clamp simulations of C-LTMR model as in (D’-E’) is plotted against varying levels of injected current density with Kv4 (Kv4 = 11 mS/cm2; black trace) or with Kv4 removed (red trace). (G’) Heatmap of onset latency during 500-ms current injection as a function of current density as well as Kv4. See also Figure 1I, 5A–B, 6A–B, 7A–C.

References

    1. Abraira VE, and Ginty DD (2013). The sensory neurons of touch. Neuron 79, 618–639. - PMC - PubMed
    1. Abraira VE, Kuehn ED, Chirila AM, Springel MW, Toliver AA, Zimmerman AL, Orefice LL, Boyle KA, Bai L, Song BJ, et al. (2017). The Cellular and Synaptic Architecture of the Mechanosensory Dorsal Horn. Cell 168, 295–310.e19. - PMC - PubMed
    1. Arcourt A, Gorham L, Dhandapani R, Prato V, Taberner FJ, Wende H, Gangadharan V, Birchmeier C, Heppenstall PA, and Lechner SG (2017). Touch Receptor-Derived Sensory Information Alleviates Acute Pain Signaling and Fine-Tunes Nociceptive Reflex Coordination. Neuron 93, 179–193. - PubMed
    1. Badea TC, Williams J, Smallwood P, Shi M, Motajo O, and Nathans J (2012). Combinatorial Expression of Brn3 Transcription Factors in Somatosensory Neurons: Genetic and Morphologic Analysis. J. Neurosci 32, 995–1007. - PMC - PubMed
    1. Bai L, Lehnert BP, Liu J, Neubarth NL, Dickendesher TL, Nwe PH, Cassidy C, Woodbury CJ, and Ginty DD (2015). Genetic Identification of an Expansive Mechanoreceptor Sensitive to Skin Stroking. Cell 163, 1783–1795. - PMC - PubMed

Publication types

MeSH terms