. 2019 Jul 16;51(1):155-168.e5.
doi: 10.1016/j.immuni.2019.05.006. Epub 2019 Jun 24.

Defining Genetic Variation in Widely Used Congenic and Backcrossed Mouse Models Reveals Varied Regulation of Genes Important for Immune Responses

Affiliations

Defining Genetic Variation in Widely Used Congenic and Backcrossed Mouse Models Reveals Varied Regulation of Genes Important for Immune Responses

Danielle A Chisolm et al. Immunity. .

Abstract

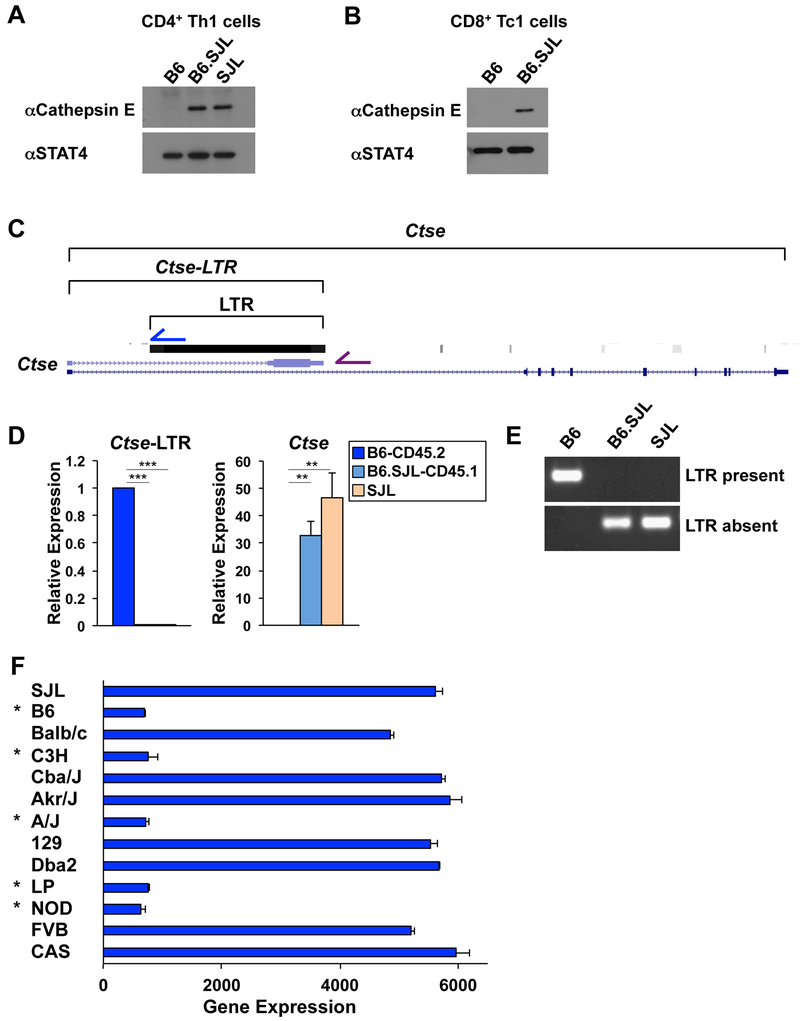
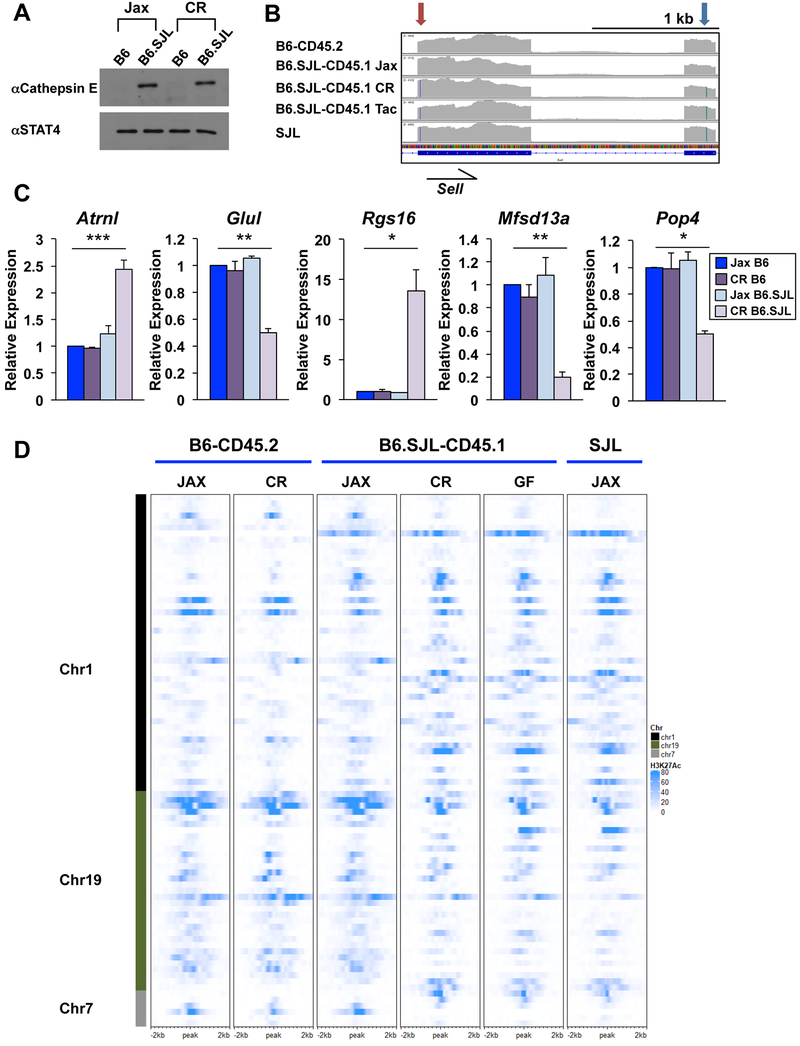
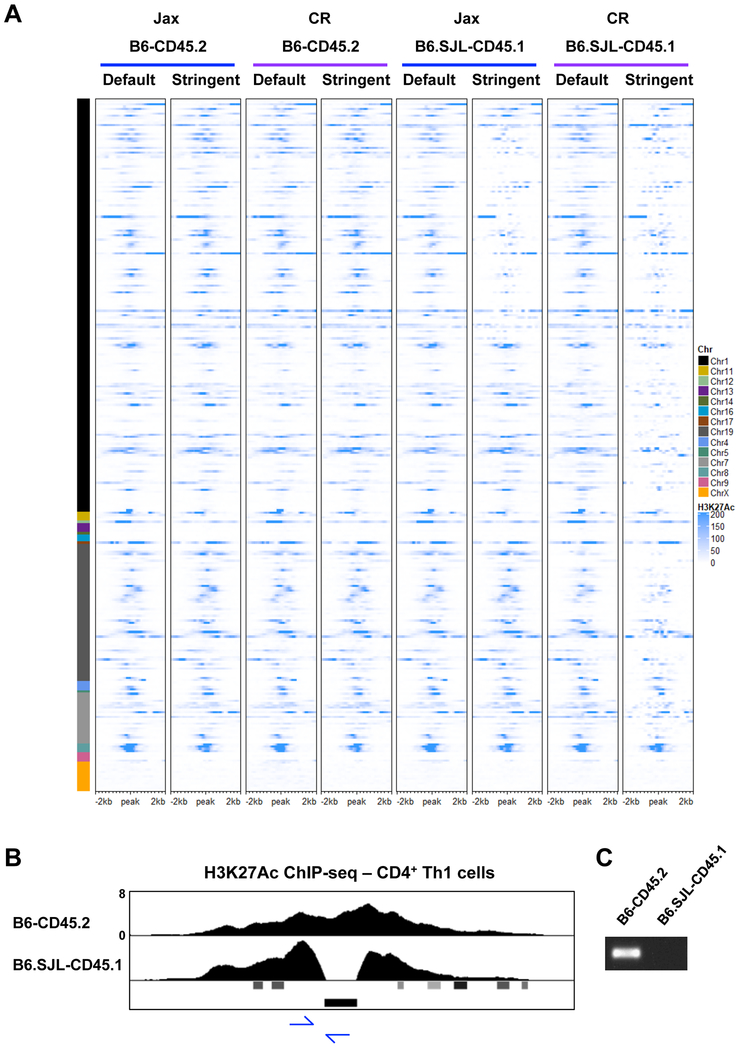
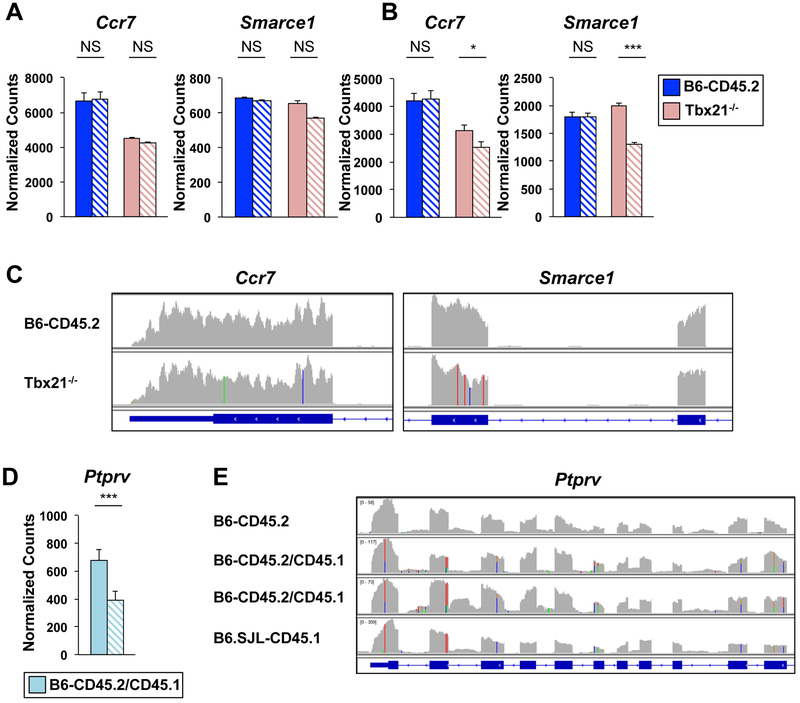
Genetic variation influences how the genome is interpreted in individuals and in mouse strains used to model immune responses. We developed approaches to utilize next-generation sequencing datasets to identify sequence variation in genes and enhancer elements in congenic and backcross mouse models. We defined genetic variation in the widely used B6-CD45.2 and B6.SJL-CD45.1 congenic model, identifying substantial differences in SJL genetic content retained in B6.SJL-CD45.1 strains on the basis of the vendor source of the mice. Genes encoding PD-1, CD62L, Bcl-2, cathepsin E, and Cxcr4 were within SJL genetic content in at least one vendor source of B6.SJL-CD45.1 mice. SJL genetic content affected enhancer elements, gene regulation, protein expression, and amino acid content in CD4+ T helper 1 cells, and mice infected with influenza showed reduced expression of Cxcr4 on B6.SJL-CD45.1 T follicular helper cells. These findings provide information on experimental variables and aid in creating approaches that account for genetic variables.

Keywords: CD45.1; CD8(+) T cells; Cxcr4; ERV; Ly5.1; Rgs16; T-bet; Tfh; Th1; germ-free.


Conflict of interest statement

The authors declare no competing interests.

Figures

Figure 1.
Figure 1.. Genetic variation between B6-CD45.2 and B6.SJL-CD45.1 mice impacts H3K27Ac in T cells.
(A, C) H3K27Ac ChIP-seq analyses were performed on (A, C) CD4+ or (A) CD8+ T cells polarized in Th1 conditions. Cells were isolated from (A) conventional (B6-CD45.2) or germ-free (B6.SJL-CD45.1) mice, or (C) B6-CD45.2, B6.SJL-CD45.1, or SJL mice from Jax. (B) Schematic representation of chromosome 1, with the red box indicating a region identified to contain SJL genetic content (Waterstrat et al., 2010). (A, C) UCSC genome browser tracks with genes (below) and cell types or genetic backgrounds (left) indicated. (A, C) Representative of at least 2 independent biological replicates. See also Fig. S1.
Figure 2.
Figure 2.. Viral integration impacts cathepsin E expression.
(A, D) CD4+ or (B) CD8+ T cells were isolated from B6-CD45.2, B6.SJL-CD45.1, or SJL mice from Jax and cells were polarized in Th1 conditions. (A, B) Western blot analysis of cathepsin E protein expression with STAT4 as a control. (C) Schematic of Ctse locus displaying the location of an alternative Ctse annotation (Ctse-LTR) and a viral LTR integration. (D) qRT-PCR analysis of Ctse and Ctse-LTR transcripts. Transcripts were normalized to Rps18 as a control and then expression levels were compared relative to B6-CD45.2 genotype cells. (E) PCR analysis of DNA isolated from B6-CD45.2, B6.SJL-CD45.1, or SJL mice using a common forward primer, with either a reverse primer inside (blue arrow in (C); LTR present) or outside (purple arrow in (C); LTR absent) of the LTR. (F) Ctse expression in CD4+ T cells isolated from mouse strains indicated to the left of the graph as defined in ImmGen datasets (GSE60337). Asterisks indicate strains that have the viral integration in the first intron of Ctse. (A, B, D, E) Data are compiled from, or representative of, at least (E) 2 or (A, B, D) 3 independent biological replicates. (D, F) Error bars represent standard error of the mean (SEM) and (D) p-values were calculated by an unpaired Student’s t test (***≤ 0.001 and ** ≤ 0.01). See also Fig. S2.
Figure 3.
Figure 3.. Genetic variation occurs in the Cxcr4 locus in B6.SJL-CD45.1 compared to B6.CD45.2 mice.
(A-F) CD4+ or (A, B) CD8+ T cells were isolated from B6-CD45.2, B6.SJL-CD45.1, or SJL mice from Jax and polarized in Th1 conditions. (A) Western analysis monitoring Cxcr4 protein expression, with STAT4 shown as a control. (B) Flow cytometry analyzing Cxcr4 cell surface expression. (C) qRT-PCR analyses with primer sets monitoring different regions of the Cxcr4 transcript. Data were processed as in Fig. 2D, and p-values were calculated with an unpaired Student’s t test (*** ≤ 0.001 and ** ≤ 0.01). (D) Primer sequence locations (color arrows) used in (C) and Sanger sequencing for a partial Cxcr4 transcript. (E) Graphs of normalized counts for RNA-seq datasets from B6-CD45.2 (dark blue), B6.SJL-CD45.1 (light blue) and SJL (orange) mice processed with default (solid bars) or stringent (hatched bars) parameters. DESeq2 performs a Benjamini-Hochberg test to calculate adjusted p-values (*** ≤ 0.001 and ** ≤ 0.01). (F) IGV browser display of RNA-seq alignment files from default parameters with nucleotide changes from the mm10 genome shown by color lines (red (T), blue (C), green (A), orange (G)). (A-F) Data are compiled from, or representative of, at least (D) 2, (A, E, F) 3, (C) 4, or (B) 6 independent biological replicates. See also Fig. S2.
Figure 4.
Figure 4.. Substantial differences in SJL genetic content are present in B6.SJL-CD45.1 mice from different vendors.
(A, B) CD4+ T cells were isolated from B6-CD45.2, B6.SJL-CD45.1, and SJL mice from Jax (blue highlight), B6N-CD45.2 and B6.SJL-CD45.1 mice from Charles River (purple highlight), or B6.SJL-CD45.1 mice from Taconic (green highlight) and cells were polarized in Th1 conditions. RNA-seq datasets were processed with default (mismatches; blue, purple, or green lettering) or stringent (0 mismatches; red lettering) parameters. Shown are heatmaps representing the z scores for the normalized counts from the DESeq2 analyses of the indicated samples from (A) Jax or (B) CR, Tac and Jax mice. See methods for heatmap gene selection. Datasets from at least three independent biological replicates are shown. (C) Schematic of chromosomes 1, 7, and 19. Blue (Jax), purple (CR), and green (Tac) boxes indicate the regions defined to contain SJL genetic content in B6.SJL-CD45.1 mice from each vendor. White dashed line represents a region detected to have B6 content in H3K27Ac analysis for genetic variation. See also Figs. S3–5.
Figure 5.
Figure 5.. SJL genetic content functionally impacts CD4+ Th1 cells from B6.SJL-CD45.1 mice.
(A-D) CD4+ T cells were isolated from B6-CD45.2 or B6.SJL-CD45.1 mice from Jax, CR, or Tac and polarized in Th1 conditions (vendor indicated in panels). (A) Western blot analysis of cathepsin E protein expression with STAT4 shown as a control. (B) IGV browser display of RNA-seq default alignment files as indicated. Partial Sell transcript is shown indicating nucleotide substitutions in the C-type lectin (red arrow) and Egf-like (blue arrow) domains. Color lines in transcript coverage denote nucleotide change from mm10 genome as indicated in Fig. 3F. (C) qRT-PCR of genes on chromosomes 1, 7, or 19 of CD4+ Th1 cells isolated from B6-CD45.2 or B6.SJL-CD45.1 mice from Jax (blue) or CR (purple) as indicated. Error bars represent SEM and p values were calculated with an unpaired Student’s t test (*** ≤ 0.001, ** ≤ 0.01, and * ≤ 0.05). (D) Heatmap of H3K27Ac ChIP-seq datasets from CD4+ Th1 cells isolated from B6-CD45.2, B6.SJL-CD45.1 or SJL mice from Jax or CR. H3K27Ac ChIP-seq data from B6.SJL-CD45.1 germ-free (GF) mice are also shown. See methods for heatmap peak selection. Data are compiled from, or representative of, at least (A, D) 2 or (B, C) 3 independent biological replicates. See also Fig. S6.
Figure 6.
Figure 6.. Genetic variation is found in H3K27Ac elements in CD4+ Th1 cells.
(A) Heatmap of H3K27Ac ChIP-seq datasets comparing default and stringent alignment parameters for CD4+ Th1 cells isolated from B6-CD45.2 and B6.SJL-CD45.1 mice from Jax or CR. See results and methods for heatmap peak selection. (B) UCSC genome browser display of H3K27Ac ChIP-seq tracks for CD4+ Th1 cells isolated from B6-CD45.2 or B6.SJL-CD45.1 mice from Jax. Viral LTR annotation is shown below the tracks. Primer locations for PCR in (C) are shown with blue arrows. (C) PCR analysis examining DNA from B6-CD45.2 or B6.SJL-CD45.1 mice from Jax. (A-C) Data are representative of at least 2 independent biological replicates. See also Fig. S5.
Figure 7.
Figure 7.. 129 genetic content was detected in Tbx21−/− transcripts.
(A-C) CD4+ T cells were isolated from B6-CD45.2 or Tbx21−/− mice or (D-E) B6-CD45.2/CD45.1 heterozygous mice and polarized in Th1 conditions. RNA-seq was performed with (A, C) 50bp single-end or (B, D, E) 150bp paired-end reads on two independent biological replicates. Graphs of normalized counts for RNA-seq data from (A, B) B6-CD45.2 (dark blue) and Tbx2T−/− (pink) or (D) B6-CD45.2/CD45.1 (light blue) mice processed with default (solid bars) or stringent (hatched bars) parameters. P-values defined by DESeq2 analysis (***≤ 0.001, * ≤ 0.05). (C, E) IGV browser tracks displaying RNA-seq alignments from default processing parameters with nucleotide changes from the mm10 genome displayed as in Fig. 3F. See also Fig. S7.

Comment in

  • Mouse Watch: A Cautionary Tale.
    Dikiy S, Rudensky AY. Dikiy S, et al. Immunity. 2019 Jul 16;51(1):10-12. doi: 10.1016/j.immuni.2019.06.019. Immunity. 2019. PMID: 31315029

Similar articles

Cited by

References

    1. Basu S, Ray A, and Dittel BN (2013). Differential representation of B cell subsets in mixed bone marrow chimera mice due to expression of allelic variants of CD45 (CD45.1/CD45.2). Journal of immunological methods 396, 163–167. - PMC - PubMed
    1. Chisolm DA, Savic D, Moore AJ, Ballesteros-Tato A, Leon B, Crossman DK, Murre C, Myers RM, and Weinmann AS (2017). CCCTC-Binding Factor Translates Interleukin 2- and alpha-Ketoglutarate-Sensitive Metabolic Changes in T Cells into Context-Dependent Gene Programs. Immunity 47, 251–267 e257. - PMC - PubMed
    1. Chisolm DA, and Weinmann AS (2018). Connections Between Metabolism and Epigenetics in Programming Cellular Differentiation. Annu Rev Immunol 36, 221–246. - PubMed
    1. Chuong EB, Elde NC, and Feschotte C (2017). Regulatory activities of transposable elements: from conflicts to benefits. Nat Rev Genet 18, 71–86. - PMC - PubMed
    1. Dobin A, Davis CA, Schlesinger F, Drenkow J, Zaleski C, Jha S, Batut P, Chaisson M, and Gingeras TR (2013). STAR: ultrafast universal RNA-seq aligner. Bioinformatics 29, 15–21. - PMC - PubMed

Publication types

MeSH terms