. 2019 Sep 2;216(9):1999-2009.
doi: 10.1084/jem.20190689. Epub 2019 Jun 27.

A stromal cell niche sustains ILC2-mediated type-2 conditioning in adipose tissue

Affiliations

A stromal cell niche sustains ILC2-mediated type-2 conditioning in adipose tissue

Batika M J Rana et al. J Exp Med. .

Abstract

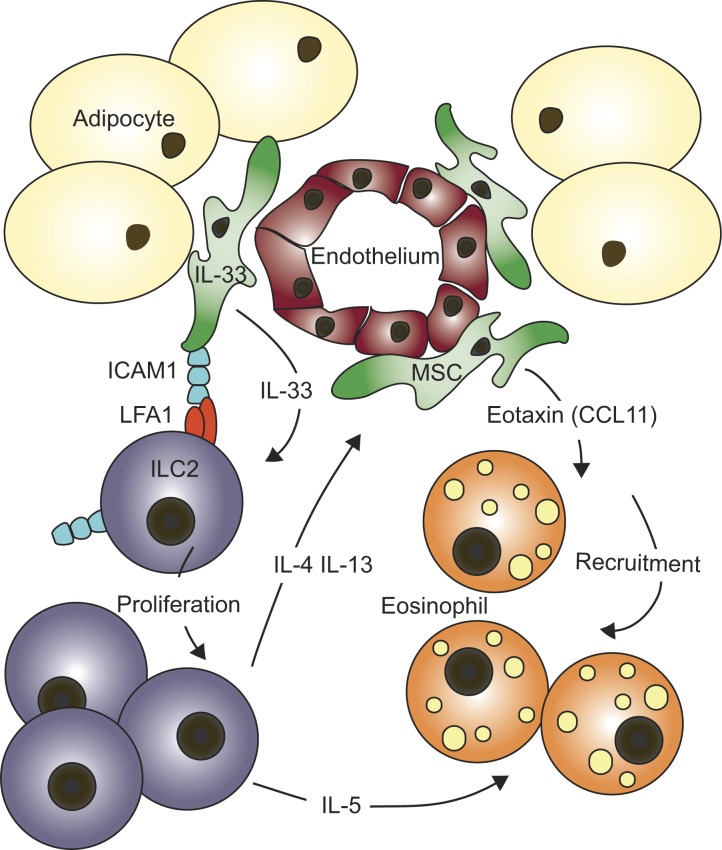
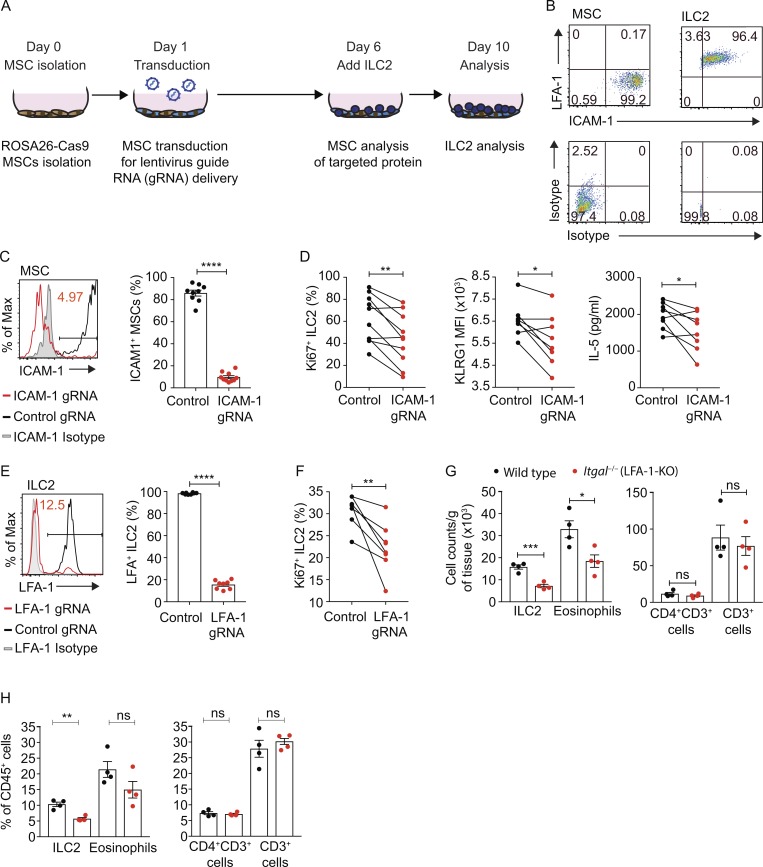
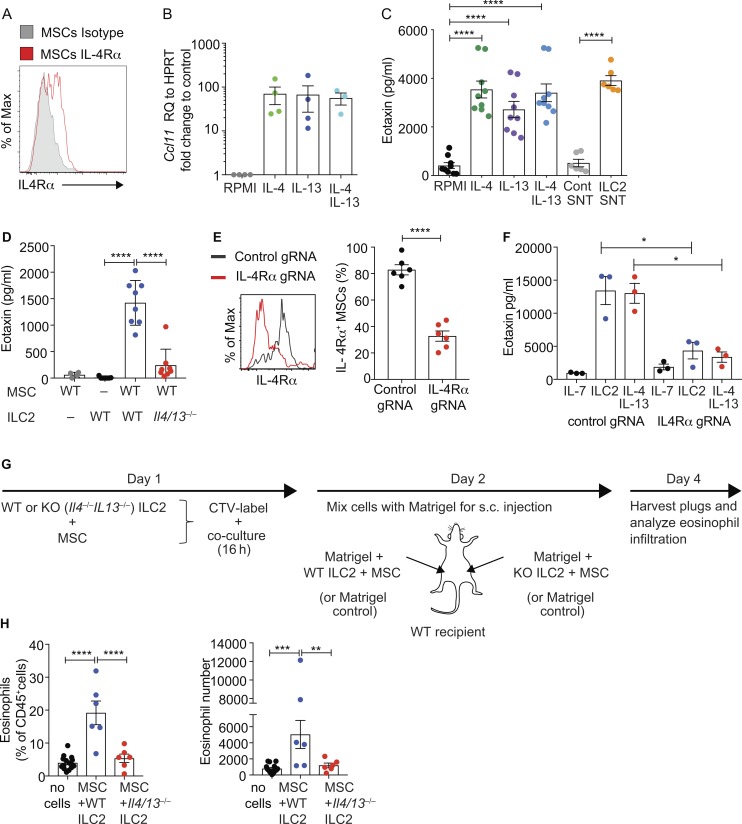
Group-2 innate lymphoid cells (ILC2), type-2 cytokines, and eosinophils have all been implicated in sustaining adipose tissue homeostasis. However, the interplay between the stroma and adipose-resident immune cells is less well understood. We identify that white adipose tissue-resident multipotent stromal cells (WAT-MSCs) can act as a reservoir for IL-33, especially after cell stress, but also provide additional signals for sustaining ILC2. Indeed, we demonstrate that WAT-MSCs also support ICAM-1-mediated proliferation and activation of LFA-1-expressing ILC2s. Consequently, ILC2-derived IL-4 and IL-13 feed back to induce eotaxin secretion from WAT-MSCs, supporting eosinophil recruitment. Thus, MSCs provide a niche for multifaceted dialogue with ILC2 to sustain a type-2 immune environment in WAT.


Figures

None
Graphical abstract
Figure 1.
Figure 1.
Adipose resident IL-33+ cells are MSCs. (A) Gating strategy. CD45EpCAM+ epithelial cells (Epi), CD45CD31+ endothelial cells (End), and CD45EpCAMCD31PDGFRα+CD34+ stromal cells. SSC-A, side scatter area; FSC-A, forward scatter area. (B) Proportion of Il33-citrine–positive cells in tissues from Il33cit/+ mice (n = 4, representative of two similar independent experiments). (C) Proportion of Il33-citrine+or–CD45EpCAMPDGFRα+ stromal cells among live cells in indicated tissues (n = 4). (D) Histology of WT or Il33cit/+ mesentery: tomato lectin stain of capillary lumen. Scale bars, 50 µm. (E) Western blot analysis of IL-33 protein from purified WAT-MSCs. Full-length mouse IL-33 (IL-33-FL) in lysate of HEK cells expressing recombinant IL-33 and truncated mouse IL-33 (processed, IL-33-P). Representative of two similar independent experiments. (F) Phenotyping of Il33-citrine+ stromal cells. (G) Principal component analysis (PCA) of RNA-seq data from indicated cell populations (n = 3). (H) Gene expression data (reads per kilobase of transcript per million mapped reads; RPKM). Representative of at least two repeat experiments. (I) Comparison of Il33+ and Il33 WAT-MSCs from adipose tissue. Genes of interest are highlighted (n = 3). (J) Adipose differentiation determined by lipid droplet analysis. Representative of two experiments. Scale bars, 100 µm. (K) Myocyte differentiation determined by α-smooth muscle actin (αSMA) staining. Representative of three experiments. Scale bars, 100 µm. Data are represented as mean ± SEM. Max, maximum.
Figure 2.
Figure 2.
ILC2s respond to MSC-derived IL-33. (A) ILC2 number at 7 d of culture with WT or IL-33–deficient (Il33−/−) MSCs. Pooled data from three experiments (n = 5 or 6). (B) Frequency of Ki67+ILC2 in co-cultures at day 7. One of two similar experiments (n = 4). (C) Mean fluorescent intensity (MFI) of intracellular IL-5 expression by ILC2s in co-cultures at day 7, determined by flow cytometry. (D) IL-5 in co-culture supernatants at day 7 determined by ELISA. (E and F) MFI of KLRG1 (E) or of intracellular GATA3 expression by ILC2s from co-cultures at day 7 (F). Pooled data are from two experiments (n = 6 mice; C–F). (G) IL-33 in freeze-thawed SVF supernatants analyzed by ELISA. Pooled data from three experiments (n = 7). (H) Frequency of Ki67+ ILC2s cultured for 48 h with supernatants from I. Pooled data represent 10 separate ILC2 purifications from three independent experiments. (I and J) MFI of KLRG1 (I) or GATA3 (J) expression by ILC2s, cultured as in H. Pooled data represent 10 separate ILC2 purifications from three independent experiments. Data are mean ± SEM. ns, not significant; *, P < 0.05; **, P < 0.01; ***, P < 0.001; ****, P < 0.0001; statistical analysis, one-way ANOVA with Tukey’s post hoc test (A–F), Student’s t test (G), or paired Student’s t test (H–J).
Figure 3.
Figure 3.
WAT-MSCs induce ILC2 proliferation and type-2 cytokine production. (A) Frequency of Ki67+ILC2s and KLRG1 expression by ILC2 from ILC2 alone, or ILC2 cultured with MSCs (ILC2 + MSCs). (B) ILC2 cell counts after 7 d of co-culture. TW, transwell. Pooled data from two experiments (n = 7). (C) Flow cytometric analysis of CTV dilution and quantification of relative CTV MFI (CTV MFI sample/CTV MFI ILC2)−1 after 7 d of co-culture. Pooled data from two experiments (n = 7). (D) IL-5 in supernatants after 7 d of co-culture, as determined by ELISA. Pooled data from four experiments (n = 11). Data are mean ± SEM. ns, not significant; *, P < 0.05; **, P < 0.01; ****, P < 0.0001; statistical analysis, one-way ANOVA with Freidman test (C) or Tukey’s post hoc test (B and D).
Figure 4.
Figure 4.
Ligation of LFA-1 on ILC2 by ICAM-1 on WAT-MSCs induces ILC2 proliferation and IL-5 production. (A) Schematic of CRISPR targeting knockout co-culture assay. (B) Representative flow cytometric analysis of ICAM-1 and LFA-1 expression by WAT-MSCs and ILC2. Data representative of two independent experiments (n = 6). (C) Representative example of MSC ICAM-1 CRISPR-Cas9–mediated knockdown. Non-targeting gRNA (Control gRNA); ICAM-1 targeting gRNA (ICAM-1 gRNA). Pooled data from four independent experiments (n = 9 or 10). (D) Frequency of Ki67+ILC2, KLRG1 MFI on ILC2s, and IL-5 concentrations (ELISA) from MSC ICAM-1–targeted cultures at day 10. Pooled data from 8–10 individual MSC purifications from at least two independent experiments (n = 8–10). (E) Representative example of LFA-1 CRISPR-Cas9–mediated knockdown. Non-targeting gRNA (Control gRNA); LFA-1 targeting gRNA (LFA-1 gRNA). Pooled data from two experiments (n = 8 mice). (F) Frequency of Ki67+ILC2 from ILC2 LFA-1–targeted cultures at day 10. Pooled data from eight individual MSC purifications from two independent experiments (n = 8). (G and H) Cell numbers (G) and frequency (H) of ILC2, eosinophil, CD4+CD3+ T cell, and CD3+ T cell in combined perigonadal and inguinal adipose tissue. Control (WT) and Itgal−/− (LFA-1-KO) mice. Data representative of two independent experiments (n = 4 mice). Data are mean ± SEM. ns, not significant; *, P < 0.05; **, P < 0.01; ****, P < 0.0001; statistical analysis, Student’s t tests (C, E, G, and H) or paired Student’s t tests (D and F).
Figure 5.
Figure 5.
ILC2 and MSCs coordinate eosinophil recruitment in vivo. (A) Representative flow cytometric analysis of IL-4Rα expression by WAT-MSCs. (B) Quantitative PCR analysis of eotaxin (Ccl11) expression by purified WAT-MSCs cultured with the indicated cytokines for 48 h. Pooled data from three experiments (n = 4). RQ, relative quantification; HRPT, hypoxanthine phosphoribosyltransferase. (C) ELISA detection of eotaxin in supernatants (at 7 d) from WAT-MSCs and ILC2 co-cultures treated as indicated. SNT, supernatant. Pooled data from three to five independent experiments (n = 6–9). (D) Detection of eotaxin in supernatants from MSCs and ILC2s (WT, WT BALB/c, or Il4−/−/Il13−/− BALB/c) cultured as indicated for 7 d, as determined by ELISA. Pooled data from two experiments (n = 4–8). (E) Representative example of IL-4Rα CRISPR-Cas9–mediated knockdown. Non-targeting gRNA (Control gRNA); IL-4Rα targeting gRNA (IL-4Rα gRNA; n = 6). Representative of two similar experiments. (F) ELISA detection of eotaxin in supernatants from MSCs transduced with lentiviral vectors containing non-targeting gRNA (Control gRNA) or IL-4Rα targeting gRNA (IL-4Rα gRNA), and cultured with ILC2 or recombinant IL-13 and IL-4 for 4 d (n = 3 mice). Representative of two similar experiments. (G) Schematic of eosinophil recruitment model. (H) Flow cytometry analysis of CD45+GR1CD11b+SiglecF+ eosinophil recruitment to Matrigel plugs harvested from WT recipients, shown as eosinophil percentage of CD45+ cells and absolute number of eosinophils per Matrigel plug. Pooled data from three experiments (n = 6 experimental, and n = 15 control). Data represented as mean ± SEM. *, P < 0.05; **, P < 0.01; ***, P < 0.001; ****, P < 0.0001; statistical analysis, repeated-measures ANOVA with Tukey’s post hoc test (C and F), one-way ANOVA (B, D, and H), or Student’s t test (E).

Comment in

  • ILC2s chew the fat.
    Ricardo-Gonzalez RR, Locksley RM. Ricardo-Gonzalez RR, et al. J Exp Med. 2019 Sep 2;216(9):1972-1973. doi: 10.1084/jem.20191098. Epub 2019 Aug 12. J Exp Med. 2019. PMID: 31405894 Free PMC article.

References

    1. Bapat S.P., Myoung Suh J., Fang S., Liu S., Zhang Y., Cheng A., Zhou C., Liang Y., LeBlanc M., Liddle C., et al. . 2015. Depletion of fat-resident Treg cells prevents age-associated insulin resistance. Nature. 528:137–141. 10.1038/nature16151 - DOI - PMC - PubMed
    1. Berton G., Laudanna C., Sorio C., and Rossi F.. 1992. Generation of signals activating neutrophil functions by leukocyte integrins: LFA-1 and gp150/95, but not CR3, are able to stimulate the respiratory burst of human neutrophils. J. Cell Biol. 116:1007–1017. 10.1083/jcb.116.4.1007 - DOI - PMC - PubMed
    1. Brestoff J.R., Kim B.S., Saenz S.A., Stine R.R., Monticelli L.A., Sonnenberg G.F., Thome J.J., Farber D.L., Lutfy K., Seale P., and Artis D.. 2015. Group 2 innate lymphoid cells promote beiging of white adipose tissue and limit obesity. Nature. 519:242–246. 10.1038/nature14115 - DOI - PMC - PubMed
    1. Cawthorn W.P., Scheller E.L., and MacDougald O.A.. 2012. Adipose tissue stem cells meet preadipocyte commitment: going back to the future. J. Lipid Res. 53:227–246. 10.1194/jlr.R021089 - DOI - PMC - PubMed
    1. Cipolletta D., Feuerer M., Li A., Kamei N., Lee J., Shoelson S.E., Benoist C., and Mathis D.. 2012. PPAR-γ is a major driver of the accumulation and phenotype of adipose tissue Treg cells. Nature. 486:549–553. 10.1038/nature11132 - DOI - PMC - PubMed

Publication types