. 2019 Aug 5;218(8):2529-2544.
doi: 10.1083/jcb.201904169. Epub 2019 Jun 27.

High-resolution imaging reveals how the spindle midzone impacts chromosome movement

Affiliations

High-resolution imaging reveals how the spindle midzone impacts chromosome movement

Melissa C Pamula et al. J Cell Biol. .

Abstract

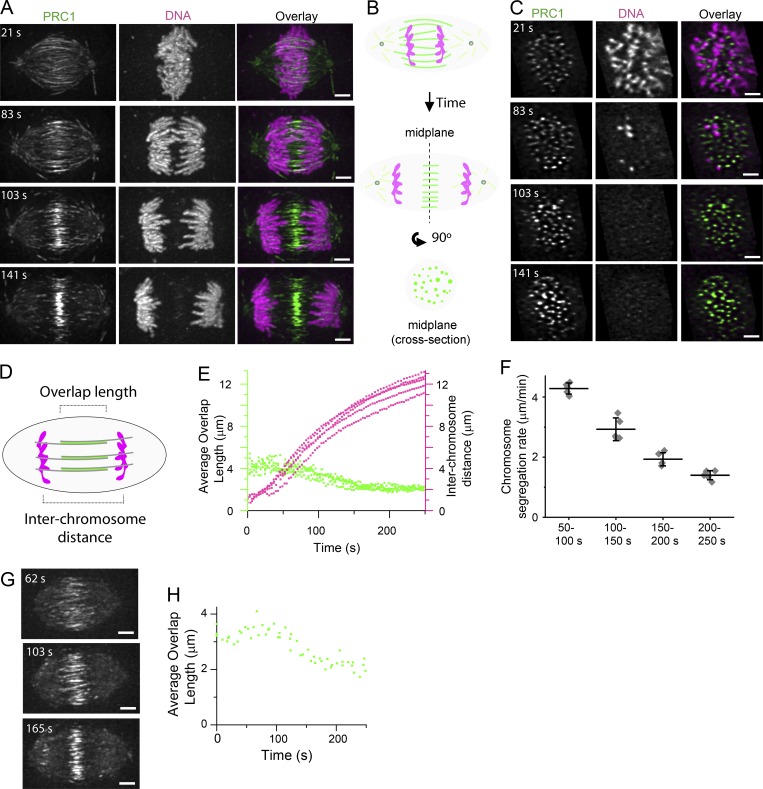
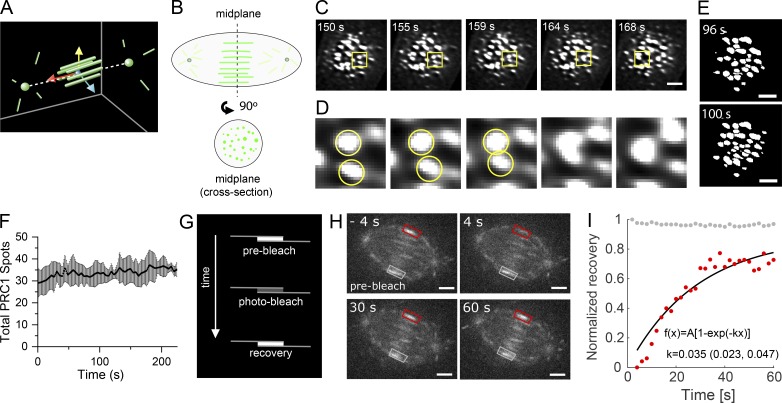
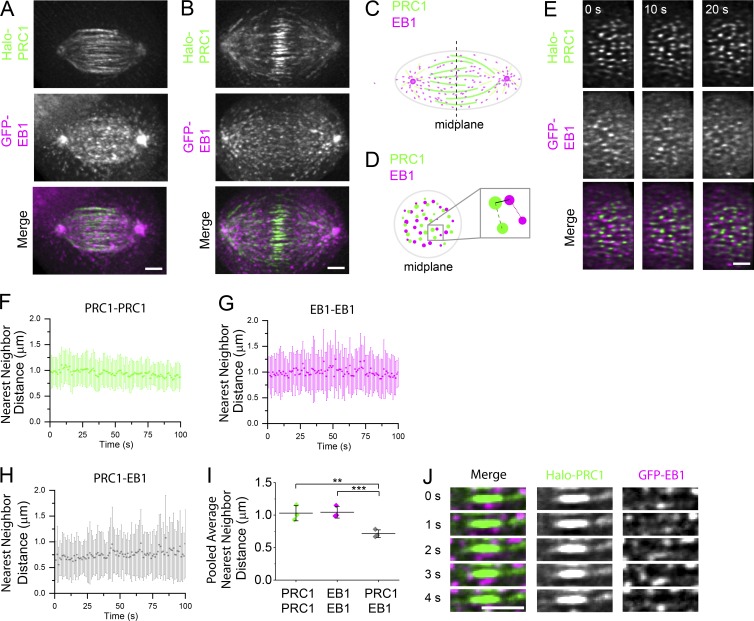
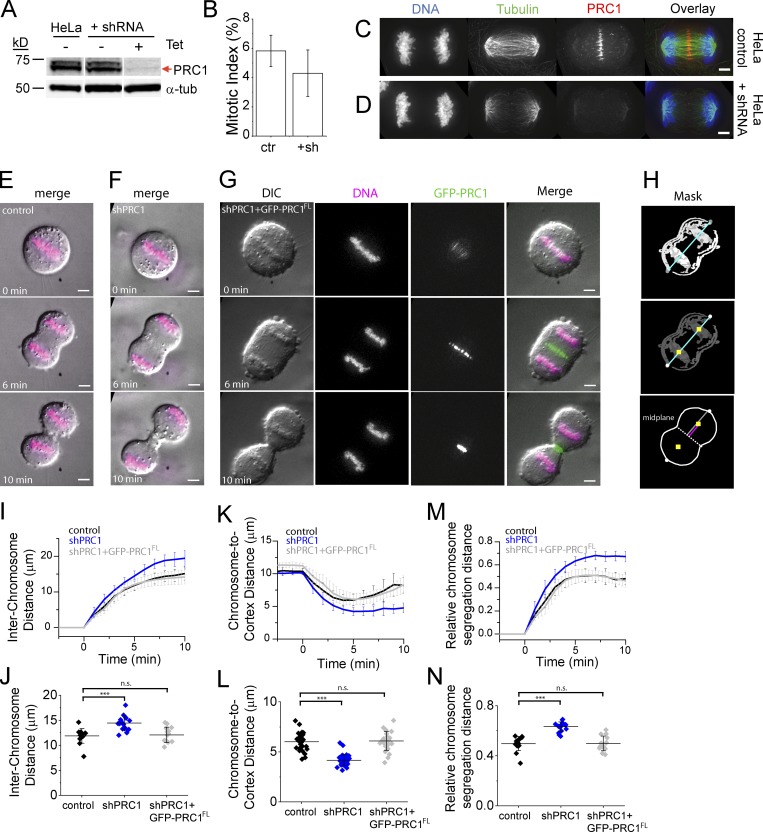
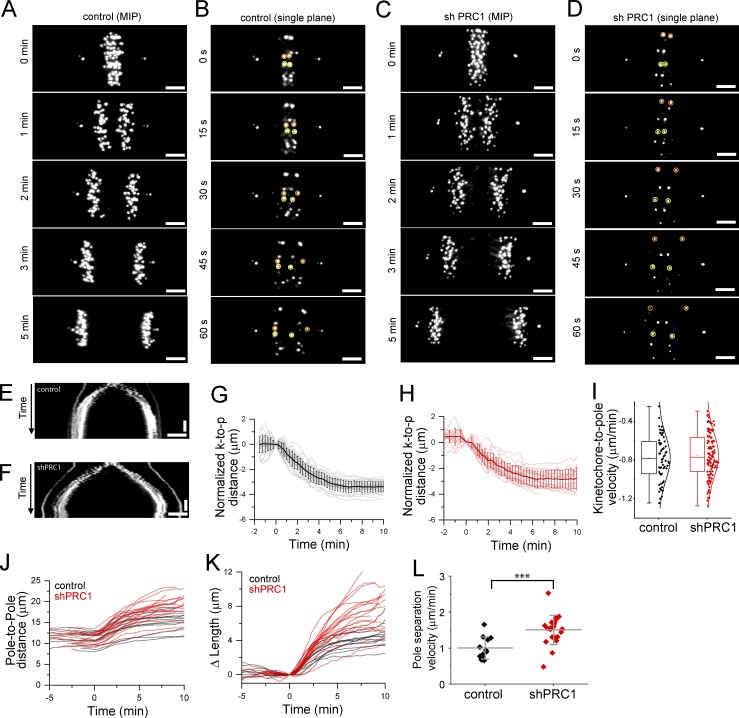
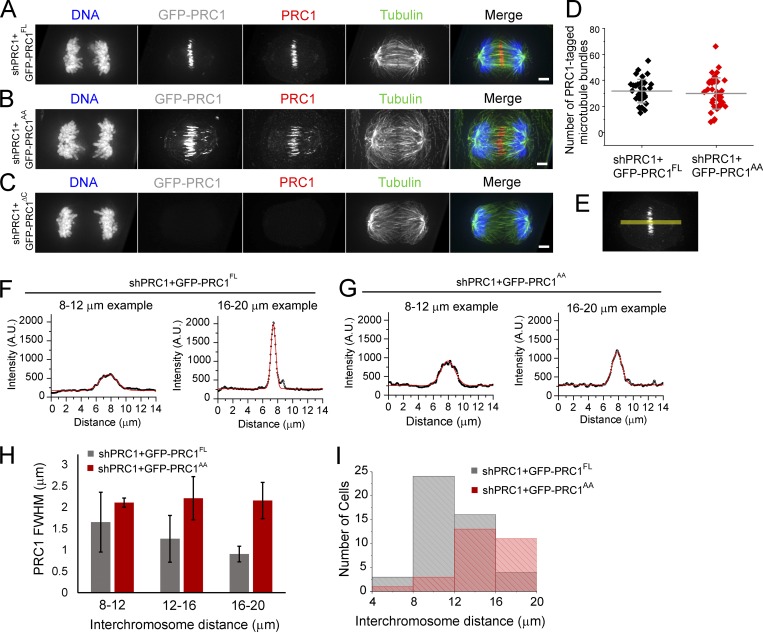
In the spindle midzone, microtubules from opposite half-spindles form bundles between segregating chromosomes. Microtubule bundles can either push or restrict chromosome movement during anaphase in different cellular contexts, but how these activities are achieved remains poorly understood. Here, we use high-resolution live-cell imaging to analyze individual microtubule bundles, growing filaments, and chromosome movement in dividing human cells. Within bundles, filament overlap length marked by the cross-linking protein PRC1 decreases during anaphase as chromosome segregation slows. Filament ends within microtubule bundles appear capped despite dynamic PRC1 turnover and submicrometer proximity to growing microtubules. Chromosome segregation distance and rate are increased in two human cell lines when microtubule bundle assembly is prevented via PRC1 knockdown. Upon expressing a mutant PRC1 with reduced microtubule affinity, bundles assemble but chromosome hypersegregation is still observed. We propose that microtubule overlap length reduction, typically linked to pushing forces generated within filament bundles, is needed to properly restrict spindle elongation and position chromosomes within daughter cells.


Figures

Figure 1.
Figure 1.
3D analysis of microtubule bundles and chromosomes in dividing cells. (A and C) Near-simultaneous two-color LLSM was used to image GFP-PRC1 and chromosomes during anaphase in hTERT-RPE1 cells. Cell volumes (101 images in each channel at 300-nm step size) were captured at 3-s intervals. T = 0 was assigned to the frame immediately before that with detectable chromatid separation. (A) Single-channel images (maximum-intensity projections) and overlays from select time points show GFP-PRC1 (green) and chromosomes (magenta). Time-lapse recording is provided in Video 1. Scale bar, 3 µm. (B) Schematic of an anaphase spindle shows PRC1 (green) and chromosomes (magenta) at a plane incident with the pole-to-pole axis and at the spindle midplane, a cross-sectional plane orthogonal to the pole-to-pole axis and equidistant between the two poles. (C) Single-channel images (single image planes) and overlays show the spindle midplane of the cell shown in A. Scale bar, 3 µm. (D) Schematic of an anaphase spindle shows region of microtubule overlap marked by PRC1 (green) and chromosomes (magenta). The length of microtubule overlap and interchromosome distance is indicated. (E) Plots of average microtubule overlap length (green dots) and interchromosome distance (magenta dots) versus time in hTERT-RPE1 cells. Average microtubule overlap length was determined for each cell at each frame (n = 5 cells). (F) Average chromosome segregation rates following anaphase onset. Data were binned in 50-s time intervals. Error bars are SD. (G) LLSM was used to image Halo-PRC1 during anaphase in HeLa cells. Cell volumes (101 images at 300-nm step size) were captured at 9.5–20.5-s intervals. Single-channel images (maximum-intensity projections) show select time points from an example cell imaged at 20.5-s intervals. T = 0 was assigned to the frame immediately before that with detectable spindle elongation. Scale bar, 3 µm. (H) Plot of average microtubule overlap length versus time in HeLa cells. Average microtubule overlap length was determined for each cell at each frame (n = 3 cells).
Figure 2.
Figure 2.
Dynamics of microtubule bundles and FRAP analysis of PRC1. (A) Schematic indicating position of PRC1-tagged microtubules (green bars) and position of the spindle midplane, the plane formed by passing through yellow and blue vectors, orthogonal to the red vector, equidistant to the two spindle poles (green spheres). (B) Schematic of an anaphase spindle shows GFP-PRC1 (green) localization in a plane incident with the pole-to-pole axis and in the spindle midplane. (C–E) LLSM was used to image GFP-PRC1 during anaphase in hTERT-RPE1 cells. T = 0 s was assigned to the frame immediately before detectable pole separation. Cells were imaged at 4.4-s intervals. (C) Single-channel images (single cross-sectional plane) at select time points. Scale bar, 3 µm. (D) Inset from yellow boxes in C, magnified 5.3×. Two spots of GFP-PRC1 intensity in consecutive frames are indicated (yellow circles). (E) Single-channel images (single cross-sectional plane) after watershed processing. Images from two consecutive frames are shown. Scale bar, 3 µm. (F) Plot of the number of spots versus time detected in watershed-processed images (mean ± SD). (G) Schematic of FRAP experiment. Single microtubule bundles were targeted for photobleaching and the fluorescence recovery monitored over time. (H) Analysis of GFP-PRC1 FRAP in hTERT-RPE1 cells imaged using spinning disk confocal microscopy. Time = 0 is time of photobleach laser pulse. Overlay indicates region targeted for photobleaching (red box) and an eqivalent unphotobleached control area (gray box). Scale bar, 3 µm. (I) Plot of normalized recovery for photobleached GFP-PRC1 signal (red dots) and unbleached GFP-PRC1 control signal (gray dots) for the cell shown in H. Data were fitted to the following equation: f(x) = A[1 − exp(−kx)]; k = 0.035 (95% confidence bounds 0.023 to 0.047).
Figure 3.
Figure 3.
Examining PRC1 and EB1 localization in cross-sectional planes of dividing cells. (A and B) Near-simultaneous two-color LLSM was used to image Halo-PRC1 and GFP-EB1 during anaphase in hTERT-RPE1 cells. Cell volumes (58 images in each channel at 350-nm step size) were captured at 1-s intervals. A select time point from an early anaphase (A) and a late anaphase (B) spindle from two different cells is shown. Single-channel images (maximum-intensity projections) and overlays show Halo-PRC1 (green) and GFP-EB1 (magenta). Time-lapse recording is provided in Video 2. Scale bar, 3 µm. (C and D) Schematics of anaphase spindles show PRC1 and EB1 decoration in a plane incident with the pole-to-pole axis (C) or in the spindle midplane, the plane equidistant from the two spindle poles and perpendicular to the spindle long axis (D). (C) The position of the spindle midplane is indicated (dashed line). (D) Inset shows schematic of nearest neighbor distances measured between two PRC1 spots (dashed line), two EB1 spots (dotted line), or one PRC1 and one EB1 spot (solid line). (E) Midplane of the cell shown in B. T = 0 indicates the start of movie. Time-lapse recording is provided in Video 3. (F–H) Nearest-neighbor distances versus time show mean ± SD for each frame of the video for the cell shown in B and E. T = 0 indicates the start of movie. Measurements between pairs of PRC1 spots (F), pairs of EB1 spots (G), and PRC1 and EB1 spots (H) are shown. (I) Average nearest-neighbor distance measurements (pooled from the first 30 frames of each movie, n = 3 cells; PRC1–PRC1: 1.03 ± 0.12 µm; EB1–EB1: 1.04 ± 0.09 µm; PRC1–EB1: 0.71 ± 0.06 µm; **, P < 0.02; ***, P < 0.004). Error bars are SD. (J) Time series of a select region (single plane) in the midzone from the cell shown in B, indicating relative position of a single microtubule bundle and GFP-EB1 signal. Single-channel images and overlays show Halo-PRC1 (green) and GFP-EB1 (magenta) in consecutive frames. Scale bar, 3 µm.
Figure 4.
Figure 4.
PRC1 knockdown results in increased chromosome segregation rate and distance. (A) Western blot analysis of cell lysates of HeLa control cells and HeLa cells containing shRNA to PRC1 before (− tet) and after (+ tet) tetracycline induction of shRNA construct. Antibodies against α-tubulin (α-tub) and PRC1 are indicated. Expected position of PRC1 protein is indicated (red arrow). Full blots are provided in Figs. S3 and S5. (B) Analysis of mitotic index from control cells (ctr) and those expressing shRNA to PRC1 (+sh) cells. (C and D) Immunofluorescence of HeLa cells. Single-channel images (maximum-intensity projections) and overlays show DNA (blue), tubulin (green), and PRC1 (red) in HeLa control cells (C) and cells expressing shRNA to PRC1 (D). Scale bar, 3 µm. (E–G) Live-cell imaging of HeLa cells. Single-channel (single z slice) and overlay images show differential interference contrast (DIC) images (gray), chromosomes (magenta), and GFP-PRC1 (green) in HeLa control cells (E), HeLa cells expressing shRNA to PRC1 (shPRC1; F), and HeLa cells expressing shRNA to PRC1 and shRNA-resistant GFP-tagged full-length PRC1 (shPRC1+GFP-PRC1FL; G). T = 0 was assigned to the frame immediately before that with detectable chromatid separation. Time-lapse recordings are provided in Videos 4 and 5. Scale bar, 3 µm. (H) Segmented binary image showing outline of cortex and chromosome mask. The position of chromosome centroid (yellow squares), the axis of chromosome segregation (blue line), the position of the midplane (dotted line), the distance from the midplane to the cortex (gray line), and the distance from chromosome to cortex (pink line) are indicated. (I–N) Analysis of chromosome and cortical position in HeLa control (black; n = 15), shRNA (blue; n = 19), and shPRC1+GFP-PRC1 (gray; n = 14) cells. Mean ± SD. (I and J) Interchromosome distance over time (I) and at T = 5 min (J; control: 11.9 ± 1.5 µm; shPRC1: 14.5 ± 1.4 µm; shPRC1+GFP-PRC1FL: 12.1 ± 1.5 µm; P < 0.003). (K and L) Chromosome-to-cortex distance over time (K) and at T = 5 min (L; control: 6.0 ± 0.9 µm; shPRC1: 4.2 ± 0.5 µm; shPRC1+GFP-PRC1FL: 5.9 ± 0.7 µm; P << 0.0001). (M and N) Relative chromosome distance to cortex over time (M) and at T = 5 min (N; control: 0.50 ± 0.06; shPRC1: 0.63 ± 0.04; shPRC1+GFP-PRC1FL: 0.50 ± 0.06; P < 0.0001). n.s., not significant.
Figure 5.
Figure 5.
Defects in microtubule bundle assembly increase the rate of anaphase spindle elongation. (A–D) Live-cell imaging of centromere and spindle pole position by spinning disk confocal microscopy. Example hTERT-RPE1 cells expressing GFP-CENP-A to label the kinetochores and GFP-Centrin to label the centrosomes are shown. Select images from time series are shown. A control cell (A and B) and a cell expressing shRNA to PRC1 (shPRC1; C and D) are shown. T = 0 was assigned to the frame immediately prior to that with detectable sister kinetochore separation. (A and C) Maximum-intensity projections (MIPs) show select time points from a cell in anaphase. Time-lapse recordings are provided in Videos 6 and 7. (B and D) Single image planes show consecutive images (15-s intervals) from the cells shown in A (B) or C (D). Selected kinetochore pairs are highlighted (orange and yellow circles). (E and F) Kymograph generated from the time-lapse videos of the cell shown in A (E) or C (F). Horizontal scale bar, 3 µm. Vertical scale bar, 2 min. (G and H) Analysis of normalized kinetochore-to-pole (k-to-p) distance show individual kinetochores (thin lines) and average (bold line) traces from an example control cell (G) and an example shPRC1 cell (H). Error bars are SD. (I) Box-and-whisker plots of kinetochore-to-pole velocity. Each point represents the velocity of a single kinetochore. Velocity was determined by linear fit to kinetochore-to-pole distance versus time in the T = 0.5–3-min time window. Negative sign indicates direction of slope. Data were pooled data from all experiments (n = 59 and 111 kinetochores for control and shPRC1 cells, respectively) and fit to a Gaussian. (J) Plots of pole-to-pole distance versus time for control (n = 12 cells; black traces) and shPRC1 (n = 21 cells; red traces) cells. (K) Plot of relative pole separation distance (ΔLength), defined as the pole-to-pole distance at time t (Lt) minus the pole-to-pole distance at T = 0 (L0). (L) Pole separation velocity for control and shPRC1 cells (***, P < 0.003). Mean ± SD.
Figure 6.
Figure 6.
Mutations in PRC1 that reduce microtubule binding affinity can form microtubule bundles but cannot rescue chromosome hypersegregation defects. (A–C) Immunofluorescence analysis of HeLa cells in anaphase. Single-channel images (maximum-intensity projections) and overlays show DNA (blue), PRC1 (red), and tubulin (green). GFP fluorescence (maximum-intensity projection) is shown as reference (gray). HeLa cells coexpressing shRNA to endogenous PRC1 (shPRC1) and shRNA-resistant GFP-PRC1FL (A), GFP-PRC1AA (B), or GFP-PRC1ΔC (C). Scale bar, 3 µm. (D) Analysis of the number of PRC1-tagged microtubule bundles in cells with interchromosome distances between 12 and 16 µm. Error bars are SD. (E–G) Analysis of PRC1 signal intensity in fixed cells. (E) PRC1 channel image from A showing position of linescan (yellow) used to measure PRC1 signal intensity along the pole-to-pole axis. (F and G) Plots show example traces from cells expressing shRNA to PRC1 (shPRC1) and shRNA-resistant GFP-PRC1FL (F) or GFP-PRC1AA (G). Signal intensity data were fit to a Gaussian (red traces) to determine the FWHM. Gaussian fits with R2 values >0.90 were retained for analysis. (H) Bar chart of average FWHM, binned by interchromosome distances. Error bars are SD. (I) Histogram of the number of anaphase cells, binned by interchromosome distance. n = 53 (shPRC1+GFP-PRC1FL) and 28 (shPRC1+GFP-PRC1AA) cells.

Similar articles

Cited by

References

    1. Aist J.R., and Berns M.W.. 1981. Mechanics of chromosome separation during mitosis in Fusarium (Fungi imperfecti): new evidence from ultrastructural and laser microbeam experiments. J. Cell Biol. 91:446–458. 10.1083/jcb.91.2.446 - DOI - PMC - PubMed
    1. Asbury C.L. 2017. Anaphase A: Disassembling Microtubules Move Chromosomes toward Spindle Poles. Biology (Basel). 6:E15 10.3390/biology6010015 - DOI - PMC - PubMed
    1. Bieling P., Telley I.A., and Surrey T.. 2010. A minimal midzone protein module controls formation and length of antiparallel microtubule overlaps. Cell. 142:420–432. 10.1016/j.cell.2010.06.033 - DOI - PubMed
    1. Braun M., Lansky Z., Fink G., Ruhnow F., Diez S., and Janson M.E.. 2011. Adaptive braking by Ase1 prevents overlapping microtubules from sliding completely apart. Nat. Cell Biol. 13:1259–1264. 10.1038/ncb2323 - DOI - PubMed
    1. Brinkley B.R., and Cartwright J. Jr. 1971. Ultrastructural analysis of mitotic spindle elongation in mammalian cells in vitro. Direct microtubule counts. J. Cell Biol. 50:416–431. 10.1083/jcb.50.2.416 - DOI - PMC - PubMed

Publication types

Associated data