. 2019 Jun 28;364(6447):1271-1274.
doi: 10.1126/science.aax1184.

Obesity remodels activity and transcriptional state of a lateral hypothalamic brake on feeding

Affiliations

Obesity remodels activity and transcriptional state of a lateral hypothalamic brake on feeding

Mark A Rossi et al. Science. .

Abstract

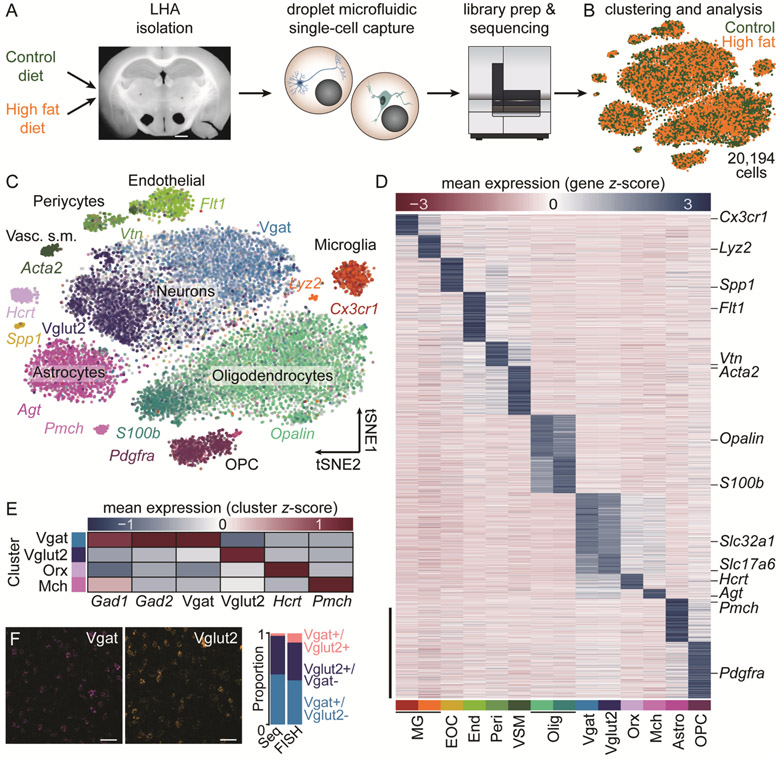
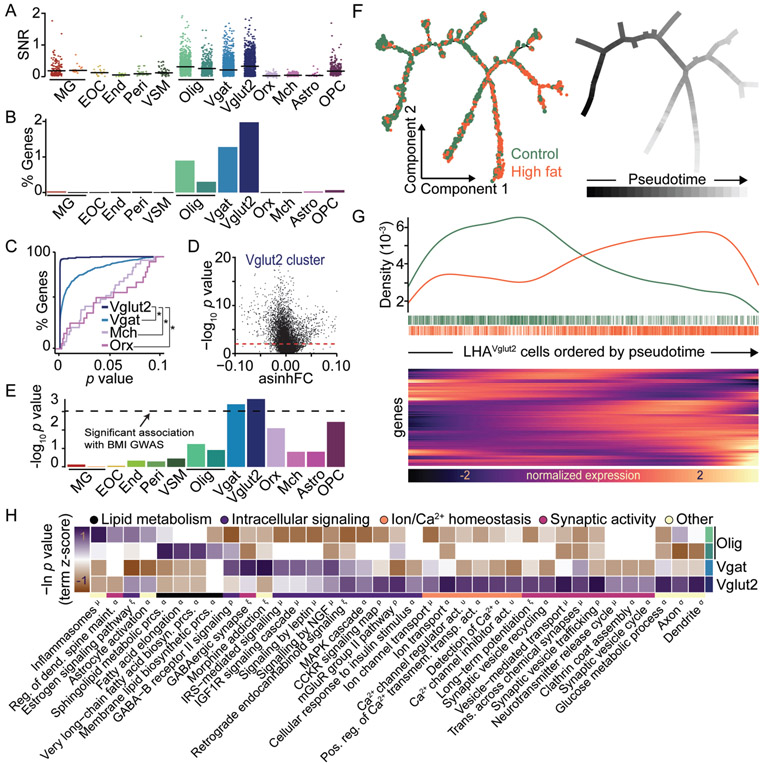
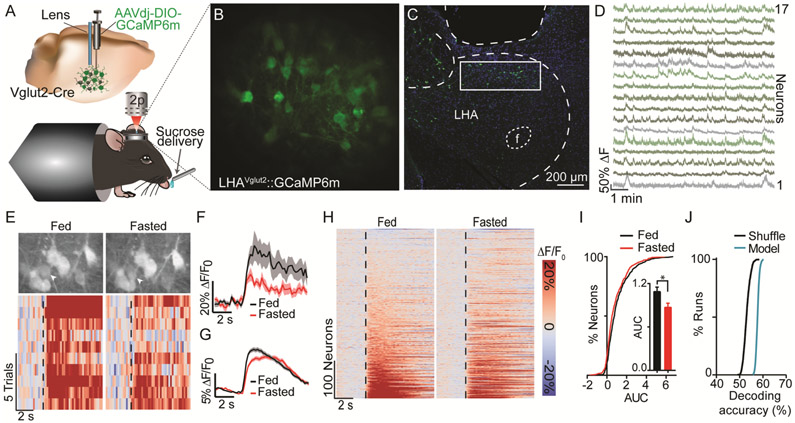
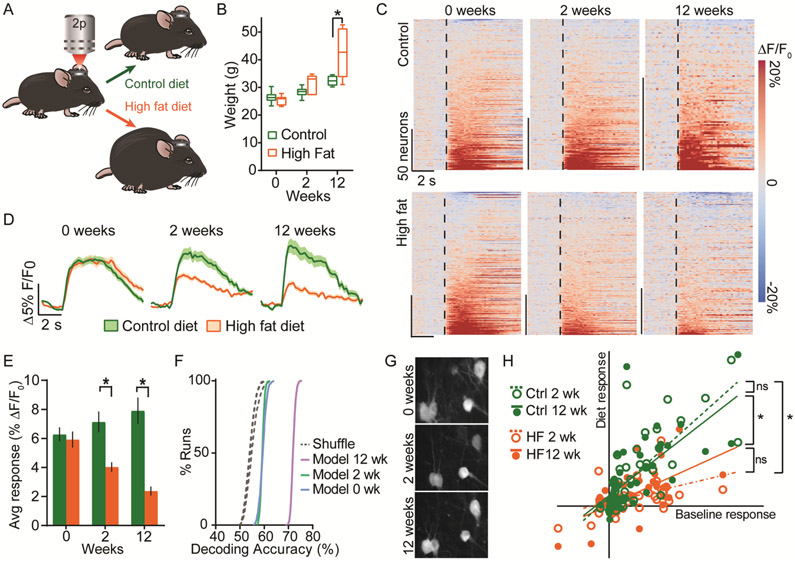
The current obesity epidemic is a major worldwide health concern. Despite the consensus that the brain regulates energy homeostasis, the neural adaptations governing obesity are unknown. Using a combination of high-throughput single-cell RNA sequencing and longitudinal in vivo two-photon calcium imaging, we surveyed functional alterations of the lateral hypothalamic area (LHA)-a highly conserved brain region that orchestrates feeding-in a mouse model of obesity. The transcriptional profile of LHA glutamatergic neurons was affected by obesity, exhibiting changes indicative of altered neuronal activity. Encoding properties of individual LHA glutamatergic neurons were then tracked throughout obesity, revealing greatly attenuated reward responses. These data demonstrate how diet disrupts the function of an endogenous feeding suppression system to promote overeating and obesity.


Conflict of interest statement

Competing interests: GB has received grant funding from and served as a consultant to Eli Lilly and has received honoraria from Illumina. CMB is a grant recipient from and has served on advisory boards for Shire. She receives royalties from Pearson and Walker. All interests are unrelated to this work.

Figures

Fig. 1.
Fig. 1.. Transcriptional profiling of LHA cells following chronic HFD exposure.
A. Schematic of experimental pipeline (n=7 control mice, 10,086 cells; n=7 HFD mice, 10,108 cells). Scale bar, 1 mm. B. tSNE visualization of 20,194 cells. Control and HFD cells were clustered together. C. tSNE visualization of 14 transcriptionally distinct clusters expressing canonical markers. D. Statistically defined clusters exhibit distinct expression patterns. Scale bar, 500 genes. E. Four clusters represent known LHA neuronal populations. F. Fluorescence in situ hybridization (FISH). Scale bar, 50 μm. The proportion of cells expressing Vgat, Vglut2, or both Vgat and Vglut2 is similar for sequencing (Seq) and FISH. Astro, astrocytes; Endo, endothelial; EOC, extraosseous osteopontin-expressing cells; Mch, melanin-concentrating hormone; MG, microglia; Olig, oligodendrocytes; OPC, oligodendrocyte precursor cells; Orx, orexin/hypocretin; Peri, pericytes; VSM, vascular smooth muscle.
Fig. 2.
Fig. 2.. HFD alters the transcriptional profile of LHAVglut2 neurons.
A. Signal-to-noise ratio (SNR) of significantly altered genes (p≤0.001) within each cluster. Outliers with SNR>2 are clipped for display. B. Percent of total genes significantly altered (p≤0.0001) in ≥50% of cells per cluster. C. Cumulative distribution of p-values (p≤0.1) for differentially expressed genes (DEGs) within each neuronal cluster detected in ≥50% of cells per cluster. *p<0.0001. D. p-values vs. asinh fold-change for all genes within the Vglut2 cluster. E. Gene-level genetic association with human BMI across clusters. Dashed line, Bonferroni significance threshold. F. Pseudotime trajectories across control and HFD cells. G. HFD cells are enriched at later pseudotimes (top) and show unique gene expression patterns (bottom, abridged from Fig. S4). H. DEGs (p≤0.001) were queried against multiple annotation databases revealing altered expression in activity-dynamic-associated functional classes (see Methods). (A-E, H) DEGs between HFD and control cells were identified within each cluster (see Methods and Supplementary Data S1).
Fig. 3.
Fig. 3.. LHAVglut2 neurons encode satiety state.
A. Schematic of head-fixed two-photon imaging. B. Example imaging plane (mean projection). C. Confocal micrograph of lens position and GCaMP6m expression. Scale bar, 200 μm. D. extracted signals from a subset of neurons in B. E. Example neuron (arrow) whose response to sucrose was mediated by satiety. Data are aligned to sucrose consumption (dashed line). F. Average response of neuron in E. G. Population average (452 neurons; 13 mice). H. Responses from all neurons in the fasted and fed states. I. Area under the curve (AUC) distributions (*p<0.05). J. Neural activity was used to decode the mouse’s satiety state (p=0.002). Values are mean ±s.e.m.
Fig. 4.
Fig. 4.. Chronic HFD suppresses LHAVglut2 activity.
A. Experimental design schematic. B. Mouse weights (n=7 HFD; n=6 control). C. Responses of all neurons to sucrose consumption. D. Average response of LHAVglut2 neurons to sucrose consumption during obesity. 0 weeks: 232 neurons (6 control mice), 220 neurons (7 HFD mice); 2 weeks: 188 neurons (6 control mice), 231 neurons (7 HFD mice); 12 weeks: 105 neurons (4 control mice), 201 neurons (7 HFD mice). E. Mean sucrose response magnitude during diet exposure. F. Diet was decoded from sucrose responses. Decoding was most accurate at 12 weeks (p<0.01 12 wk vs. 0 and 2 wk). G. Example of neurons tracked during obesity (mean projections). H. A subset of neurons was tracked throughout obesity (control: 44 cells, 4 mice; HFD: 33 cells, 4 mice). Sucrose response magnitudes at 2 and 12 weeks are plotted against the magnitude of the baseline (0 weeks) responses. *p<0.05.

Comment in

  • Releasing the brake on eating.
    Borgland SL. Borgland SL. Science. 2019 Jun 28;364(6447):1233-1234. doi: 10.1126/science.aay0204. Science. 2019. PMID: 31249046 No abstract available.

References

    1. Finucane MM et al., National, regional, and global trends in body-mass index since 1980: systematic analysis of health examination surveys and epidemiological studies with 960 country-years and 9.1 million participants. Lancet 377, 557–567 (2011). - PMC - PubMed
    1. Kopelman PG, Obesity as a medical problem. Nature 404, 635–643 (2000). - PubMed
    1. Hoebel BG, Teitelbaum P, Hypothalamic control of feeding and self-stimulation. Science 135, 375–377 (1962). - PubMed
    1. Rossi MA, Stuber GD, Overlapping Brain Circuits for Homeostatic and Hedonic Feeding. Cell Metab, (2017). - PMC - PubMed
    1. Wise RA, Hypothalamic motivational systems: fixed or plastic neural circuits? Science 162, 377–379 (1968). - PubMed

Publication types

Substances