. 2019 Jun 28;364(6447):1279-1282.
doi: 10.1126/science.aat9689. Epub 2019 Jun 27.

Subcellular antibiotic visualization reveals a dynamic drug reservoir in infected macrophages

Affiliations

Subcellular antibiotic visualization reveals a dynamic drug reservoir in infected macrophages

Daniel J Greenwood et al. Science. .

Abstract

Tuberculosis, caused by the intracellular pathogen Mycobacterium tuberculosis, remains the world's deadliest infectious disease. Sterilizing chemotherapy requires at least 6 months of multidrug therapy. Difficulty visualizing the subcellular localization of antibiotics in infected host cells means that it is unclear whether antibiotics penetrate all mycobacteria-containing compartments in the cell. Here, we combined correlated light, electron, and ion microscopy to image the distribution of bedaquiline in infected human macrophages at submicrometer resolution. Bedaquiline accumulated primarily in host cell lipid droplets, but heterogeneously in mycobacteria within a variety of intracellular compartments. Furthermore, lipid droplets did not sequester antibiotic but constituted a transferable reservoir that enhanced antibacterial efficacy. Thus, strong lipid binding facilitated drug trafficking by host organelles to an intracellular target during antimicrobial treatment.


Conflict of interest statement

Competing interests: None.

Figures

Fig. 1
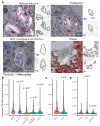
Fig. 1. Bedaquiline accumulated in host LD and Mtb.
(A-C) Mtb-infected hMDM, treated with 2.5 mg/L BDQ. EM overlaid with 79Br and 31P signals. Scale: 2 μm. (D) (Left) Maximum projection of macrophage infected with Mtb-RFP, treated with 2.5 mg/L BDQ. LD stained with BODIPY appear yellow due to spectral overlap. (Right) LD staining and 79Br signal on EM. Scale: 5 μm. (E) BDQ in macrophages treated with 2.5 mg/L BDQ. Data shows means from 4-6 technical replicates from 2-3 donors. (F) EM with 79Br signal on mitochondria, starred. Scale: 2 μm. (G) Normalised 79Br (BDQ) signal by area. Data shows mean intensity per object, 3 biological replicates, S.E., p-values from Wilcox test, n=6-221. Y-axis square-root scaled.
Fig. 2
Fig. 2. Mtb induced host LD accumulation and consumption in hMDM.
(A) LD area per macrophage, dots show means. (B) Fold-changes of significantly (p<0.05) altered lipids relative to uninfected control, n=6 technical replicates. (C) Mtb vs LD area 96 h post infection. Axes square root scaled. Scale: 10 μm. (D) Mean LD and Mtb burden measured by area, averaged from 38 infected macrophages. LD normalised to uninfected average, starting point of 1. Curve LOESS fitted with 95% confidence interval. (E) Mtb infected hMDM stained anti-PLIN2 antibody. (F) Maximum-projection from live-cell video of Mtb infected macrophages with LD diameter, right.
Fig. 3
Fig. 3. BDQ was transferred from host LD to Mtb.
(A) (Top-left) hMDM treated with 2.5 mg/L BDQ for 24 h, then infected for 24 h; (top-right) 10 mg/L pradigastat during 48 h infection, then 24 h treatment with pradigastat and 2.5 mg/L BDQ; (bottom-left) 2.5 mg/L BDQ and 10 mg/L pradigastat for 24 h prior to infection for 24 h; (bottom-right) 400 μM oleate, followed by 48 h infection and 24 h treatment with 2.5 mg/L BDQ. (B) Quantification of (A). Data shows mean signal from 187-640 bacteria per condition, 3 biological replicates, p-values from linear regression. (C) 79Br signal from hMDM infected and treated with 2.5 mg/L BDQ for 24 h. P-values as in (B), 221–643 bacteria analysed per condition, 3 biological replicates. (D) 79Br signal from hMDM infected and treated with 2.5 mg/L BDQ for 24 h. In ‘PFA’, macrophages infected with pre-killed Mtb or 40 mg/L verapamil added with BDQ. P-values as in B, 221–350 bacteria analysed per condition, 3 biological replicates.
Fig. 4
Fig. 4. LD enhanced BDQ efficacy against intracellular Mtb.
(A) Experimental timelines, hours in brackets. (B) Bacterial area per macrophage at 96 h normalised to BDQ-untreated control for each condition. Data shown are means, S.E.M. from 12937-17180 infected macrophages per LD modulator from 3 donors, p-values from linear regression. Y-axis log-scaled. A922500 overlaps with T863. Significance-codes: ‘***’<0.001, ‘**’<0.01, ‘*’<0.05. (C) Bacterial area normalised to BDQ-untreated control. P-values as in B, 38795–48466 infected macrophages analysed per LD modulator, 5 monocyte donors. Y-axis log-scaled.

Comment in

References

    1. Lerner TR, et al. J Cell Biol. 2017
    1. Carryn S, Van Bambeke F, Mingeot-Leclercq M-P, Tulkens PM. Antimicrob Agents Chemother. 2002;46:2095–2103. - PMC - PubMed
    1. Andries K, et al. Science. 2005;307:223–7. - PubMed
    1. Tong AST, et al. ACS Med Chem Lett. 2017;8:1019–1024. - PMC - PubMed
    1. Waring MJ. Expert Opin Drug Discov. 2010;5:235–248. - PubMed

Publication types

MeSH terms