Local features determine Ty3 targeting frequency at RNA polymerase III transcription start sites
- PMID: 31249062
- PMCID: PMC6673722
- DOI: 10.1101/gr.240861.118
Local features determine Ty3 targeting frequency at RNA polymerase III transcription start sites
Abstract
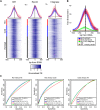
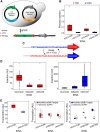
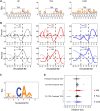
Retroelement integration into host genomes affects chromosome structure and function. A goal of a considerable number of investigations is to elucidate features influencing insertion site selection. The Saccharomyces cerevisiae Ty3 retrotransposon inserts proximal to the transcription start sites (TSS) of genes transcribed by RNA polymerase III (RNAP3). In this study, differential patterns of insertion were profiled genome-wide using a random barcode-tagged Ty3. Saturation transposition showed that tRNA genes (tDNAs) are targeted at widely different frequencies even within isoacceptor families. Ectopic expression of Ty3 integrase (IN) showed that it localized to targets independent of other Ty3 proteins and cDNA. IN, RNAP3, and transcription factor Brf1 were enriched at tDNA targets with high frequencies of transposition. To examine potential effects of cis-acting DNA features on transposition, targeting was tested on high-copy plasmids with restricted amounts of 5' flanking sequence plus tDNA. Relative activity of targets was reconstituted in these constructions. Weighting of genomic insertions according to frequency identified an A/T-rich sequence followed by C as the dominant site of strand transfer. This site lies immediately adjacent to the adenines previously implicated in the RNAP3 TSS motif (CAA). In silico DNA structural analysis upstream of this motif showed that targets with elevated DNA curvature coincide with reduced integration. We propose that integration mediated by the Ty3 intasome complex (IN and cDNA) is subject to inputs from a combination of host factor occupancy and insertion site architecture, and that this results in the wide range of Ty3 targeting frequencies.
© 2019 Patterson et al.; Published by Cold Spring Harbor Laboratory Press.
Figures


Similar articles
-
Structural basis of Ty3 retrotransposon integration at RNA Polymerase III-transcribed genes.Nat Commun. 2021 Nov 30;12(1):6992. doi: 10.1038/s41467-021-27338-w. Nat Commun. 2021. PMID: 34848735 Free PMC article.
-
Retrotransposon profiling of RNA polymerase III initiation sites.Genome Res. 2012 Apr;22(4):681-92. doi: 10.1101/gr.131219.111. Epub 2012 Jan 27. Genome Res. 2012. PMID: 22287102 Free PMC article.
-
Requirement of RNA polymerase III transcription factors for in vitro position-specific integration of a retroviruslike element.Science. 1995 Mar 10;267(5203):1488-91. doi: 10.1126/science.7878467. Science. 1995. PMID: 7878467
-
Reverse Transcription in the Saccharomyces cerevisiae Long-Terminal Repeat Retrotransposon Ty3.Viruses. 2017 Mar 15;9(3):44. doi: 10.3390/v9030044. Viruses. 2017. PMID: 28294975 Free PMC article. Review.
-
Regulation of tRNA synthesis by the general transcription factors of RNA polymerase III - TFIIIB and TFIIIC, and by the MAF1 protein.Biochim Biophys Acta Gene Regul Mech. 2018 Apr;1861(4):320-329. doi: 10.1016/j.bbagrm.2018.01.011. Epub 2018 Feb 6. Biochim Biophys Acta Gene Regul Mech. 2018. PMID: 29378333 Review.
Cited by
-
Light and shadow on the mechanisms of integration site selection in yeast Ty retrotransposon families.Curr Genet. 2021 Jun;67(3):347-357. doi: 10.1007/s00294-021-01154-7. Epub 2021 Feb 15. Curr Genet. 2021. PMID: 33590295 Review.
-
Species-Wide Transposable Element Repertoires Retrace the Evolutionary History of the Saccharomyces cerevisiae Host.Mol Biol Evol. 2021 Sep 27;38(10):4334-4345. doi: 10.1093/molbev/msab171. Mol Biol Evol. 2021. PMID: 34115140 Free PMC article.
-
Structural basis of Ty3 retrotransposon integration at RNA Polymerase III-transcribed genes.Nat Commun. 2021 Nov 30;12(1):6992. doi: 10.1038/s41467-021-27338-w. Nat Commun. 2021. PMID: 34848735 Free PMC article.
-
Evolution of a Restriction Factor by Domestication of a Yeast Retrotransposon.Mol Biol Evol. 2024 Mar 1;41(3):msae050. doi: 10.1093/molbev/msae050. Mol Biol Evol. 2024. PMID: 38442736 Free PMC article.
-
A small targeting domain in Ty1 integrase is sufficient to direct retrotransposon integration upstream of tRNA genes.EMBO J. 2020 Sep 1;39(17):e104337. doi: 10.15252/embj.2019104337. Epub 2020 Jul 17. EMBO J. 2020. PMID: 32677087 Free PMC article.
References
-
- Achuthan V, Perreira JM, Sowd GA, Puray-Chavez M, McDougall WM, Paulucci-Holthauzen A, Wu X, Fadel HJ, Poeschla EM, Multani AS, et al. 2018. Capsid-CPSF6 interaction licenses nuclear HIV-1 trafficking to sites of viral DNA integration. Cell Host Microbe 24: 392–404.e8. 10.1016/j.chom.2018.08.002 - DOI - PMC - PubMed
-
- Aiyer S, Swapna GV, Malani N, Aramini JM, Schneider WM, Plumb MR, Ghanem M, Larue RC, Sharma A, Studamire B, et al. 2014. Altering murine leukemia virus integration through disruption of the integrase and BET protein family interaction. Nucleic Acids Res 42: 5917–5928. 10.1093/nar/gku175 - DOI - PMC - PubMed
Publication types
MeSH terms
Substances
Grants and funding
LinkOut - more resources
Full Text Sources
Molecular Biology Databases
Research Materials
