. 2019 Jun 27;6(1):101.
doi: 10.1038/s41597-019-0084-8.

Mapping global development potential for renewable energy, fossil fuels, mining and agriculture sectors

Affiliations

Mapping global development potential for renewable energy, fossil fuels, mining and agriculture sectors

James R Oakleaf et al. Sci Data. .

Abstract

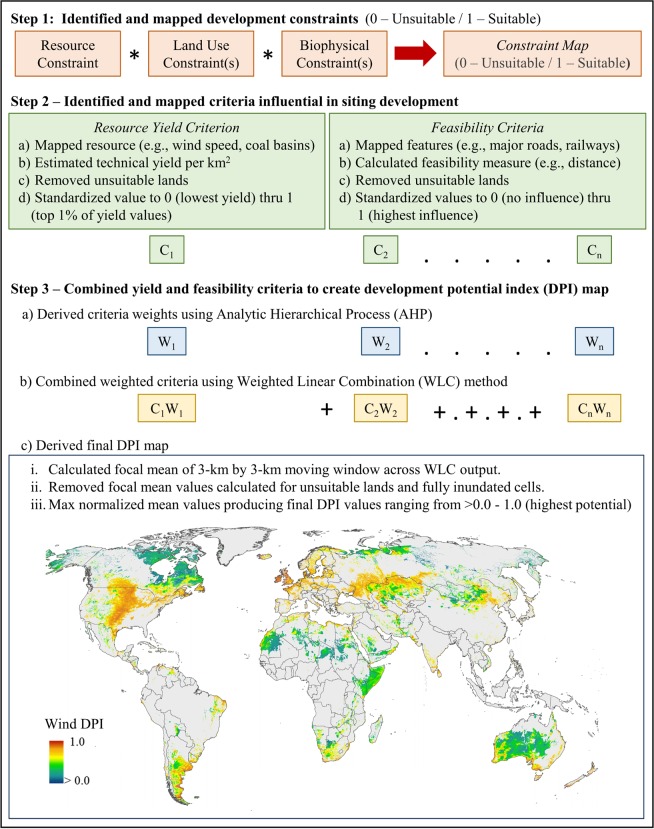
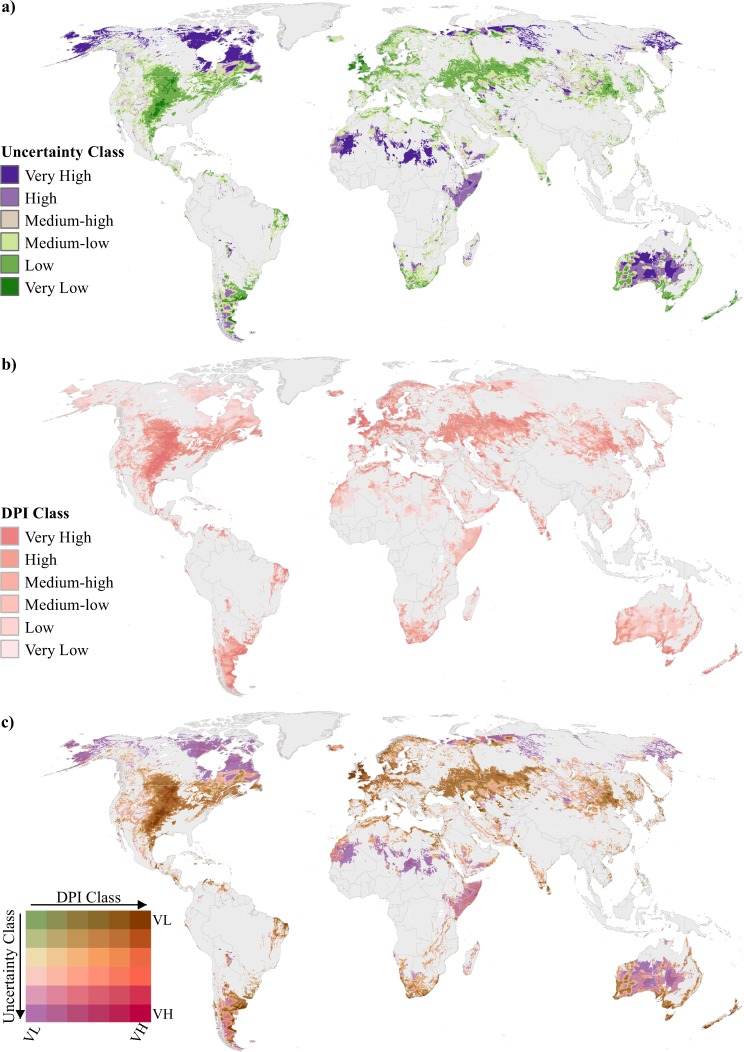
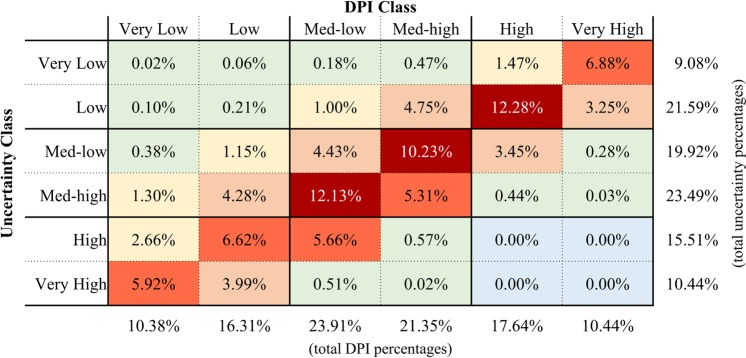
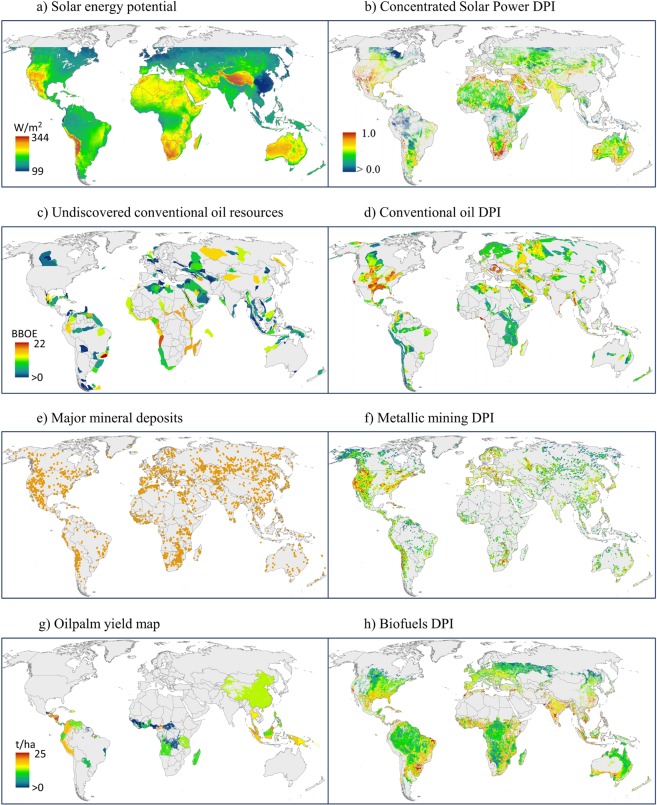
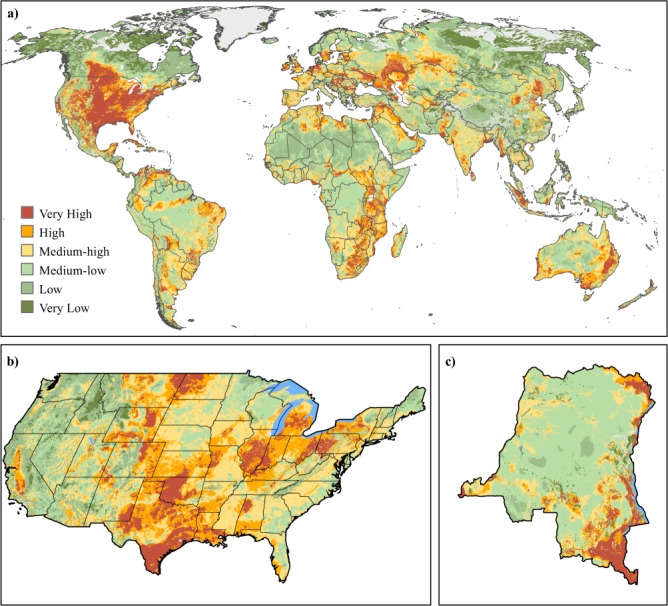
Mapping suitable land for development is essential to land use planning efforts that aim to model, anticipate, and manage trade-offs between economic development and the environment. Previous land suitability assessments have generally focused on a few development sectors or lack consistent methodologies, thereby limiting our ability to plan for cumulative development pressures across geographic regions. Here, we generated 1-km spatially-explicit global land suitability maps, referred to as "development potential indices" (DPIs), for 13 sectors related to renewable energy (concentrated solar power, photovoltaic solar, wind, hydropower), fossil fuels (coal, conventional and unconventional oil and gas), mining (metallic, non-metallic), and agriculture (crop, biofuels expansion). To do so, we applied spatial multi-criteria decision analysis techniques that accounted for both resource potential and development feasibility. For each DPI, we examined both uncertainty and sensitivity, and spatially validated the map using locations of planned development. We illustrate how these DPIs can be used to elucidate potential individual sector expansion and cumulative development patterns.


Conflict of interest statement

The authors declare no competing interests.

Figures

Fig. 1
Fig. 1
Procedures used to produce all development potential index (DPI) maps. Analysis steps were applied for the 13 sectors related to renewable energy, fossil fuels, mining, and agriculture.
Fig. 2
Fig. 2
Example spatial uncertainty analysis for wind development potential index (DPI). Spatial datasets used for wind DPI uncertainty analyses: (a) classified wind uncertainty map, (b) classified wind DPI map, and (c) resulting map produced by intersection of two maps. In the legend for map (c), arrows indicate the direction of classes going from “Very Low” (VL) to “Very High” (VH). For example, purple areas classified as VL for DPI and VH for uncertainty, whereas dark brown areas classified as VH for DPI and VL for uncertainty. Non-classified areas are identified in grey and were excluded based on a lack of available future resources or by constraints applied during the DPI analysis.
Fig. 3
Fig. 3
Cross tabular average percentages of development potential index (DPI) classes in each corresponding uncertainty class. Data for each DPI and uncertainty class were averaged across all 13 sectors and total percentages are summarized at the bottom (total percentage in DPI class) and right (total percentage in uncertainty class) of the table. Six colors classify percentages from lowest to highest (i.e., light-blue [0%], light-green [0–1%], yellow [1–3%], light-red [3–5%], red [5–7%], and dark-red [>10%]).
Fig. 4
Fig. 4
Comparison of DPIs with publicly available resource data. Data on resources were obtained from WRI Resource Watch and partners (left side panel) with the most analogous DPI maps produced by this study (right side panel). Color ramp for all maps are the same, with highest values in dark orange and lowest values in blue and null value in grey. Legend in first DPI map (b) can be applied to all other DPI maps (d,f,h). Map of only potential resource locations are displayed in a uniform orange color, i.e., large mineral deposit locations (e). Legend abbreviations for resource maps (a,c,g) are as follows: watts per square meter (W/m2), billion barrels of oil equivalent (BBOE), and tons per hectare (t/ha).
Fig. 5
Fig. 5
Global and regional-level cumulative development maps produced from standardized DPIs. Maps that display (a) global cumulative development potential map based on summing standardized global DPIs, and two regional-level cumulative development potential based on standardizing DPIs at the scale of the (b) United States (US) and (c) Democratic Republic of Congo (DRC). All maps use previously described z-score binning with legend in map (a) also applicable to maps (b,c).

References

    1. Ellis EC, Klein Goldewijk K, Siebert S, Lightman D, Ramankutty N. Anthropogenic transformation of the biomes, 1700 to 2000. Glob. Ecol. Biogeogr. 2010;19:598–606.
    1. Foley JA, et al. Global consequences of land use. Science. 2005;309:570–4. doi: 10.1126/science.1111772. - DOI - PubMed
    1. Steffen W, et al. Planetary boundaries: Guiding human development on a changing planet. Science. 2015;347:1259855. doi: 10.1126/science.1259855. - DOI - PubMed
    1. Ceballos G, Ehrlich PR, Dirzo R. Biological annihilation via the ongoing sixth mass extinction signaled by vertebrate population losses and declines. Proc. Natl. Acad. Sci. USA. 2017;114:E6089–E6096. doi: 10.1073/pnas.1704949114. - DOI - PMC - PubMed
    1. Gerland P, et al. World population stabilization unlikely this century. Science. 2014;346:234–237. doi: 10.1126/science.1257469. - DOI - PMC - PubMed

Publication types